【每日一学】pandas_透视表函数&交叉表函数
每日一悟
【分开工作内外8小时】

前一个月,我经常把工作内的问题带到路上、地铁上、睡觉前,甚至是周末。

然而很快发现,我工作外的成就几乎没有,而工作内的进展也并不理想。

仔细想想,工作外是需要学新东西,产生新灵感。一方面是工作内的支撑,另一方面也是新的方向。而不是低效率地光在脑子里想工作内的解决方案。

所以,我觉得有必要明确工作内外的目标和行动,比如工作外每周一本书,每天的原版技术书阅读;工作内做好事务优先级,处理前先想清楚思路再着手准备。

高效且多产,这才是目的。
pandas.pivot_table
pivot_table(data, values=None, index=None, columns=None, aggfunc='mean', fill_value=None, margins=False, dropna=True, margins_name='All')
简介:
method of pandas.core.frame.DataFrame instance Create a spreadsheet-style pivot table as a DataFrame. The levels in the pivot table will be stored in MultiIndex objects (hierarchical indexes) on the index and columns of the result DataFrame.
pandas核心实例的方法,创建一个大宽表的透视表数据框,在这个结果数据框中的索引和列等级,将会被存储在多重索引对象中(分层索引)。
应用格式:
pandas.pivot_table(dataframe,Other parameters)
等同于
dataframe.pivot_table(Other parameters)
参数:
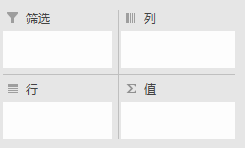
在看参数之前我们先看看Excel中透视表的结构,结构为筛选、列、行、值。除了筛选,列、行、值与下面要介绍的pandas.pivot_table功能一值。

data : 要应用透视表的数据框;
values: 可选,是要聚合的列,相当于“值”,例如 values=["Price"];
index : 是要聚合值的分组,相当于“行”,多个层次格式例如 index=["Name","Rep","Manager"];
columns : 是要聚合值的分组,相当于“列”;
aggfunc : 是要应用的聚合函数,指定不同值使用不同聚合函数时可用字典格式,例如 aggfunc=[np.mean,len],aggfunc={"Quantity":len,"Price":[np.sum,np.mean]};
fill_value : 有时候聚合结果里出现了NaN,想替换成0时,fill_value=0;
margins : 是否添加所有行或列的小计/总计,margins=True;
margins_name : 当margins设置为True时,设置总计的名称,默认是“ALL”。
举例:
见help(pandas.pivot_table)
pandas.crosstab
crosstab(index, columns, values=None, rownames=None, colnames=None, aggfunc=None, margins=False,margins_name='All', dropna=True, normalize=False)
    Compute a simple cross-tabulation of two (or more) factors. By default

    computes a frequency table of the factors unless an array of values and an

    aggregation function are passed

    Parameters

    ----------

    index : array-like, Series, or list of arrays/Series

        Values to group by in the rows

    columns : array-like, Series, or list of arrays/Series

        Values to group by in the columns

    values : array-like, optional

        Array of values to aggregate according to the factors.

        Requires `aggfunc` be specified.

    aggfunc : function, optional

        If specified, requires `values` be specified as well

    rownames : sequence, default None

        If passed, must match number of row arrays passed

    colnames : sequence, default None

        If passed, must match number of column arrays passed

    margins : boolean, default False

        Add row/column margins (subtotals)

    margins_name : string, default 'All'

        Name of the row / column that will contain the totals

        when margins is True.

        .. versionadded:: 0.21.0

    dropna : boolean, default True

        Do not include columns whose entries are all NaN

    normalize : boolean, {'all', 'index', 'columns'}, or {0,1}, default False

        Normalize by dividing all values by the sum of values.

        - If passed 'all' or `True`, will normalize over all values.

        - If passed 'index' will normalize over each row.

        - If passed 'columns' will normalize over each column.

        - If margins is `True`, will also normalize margin values.

        .. versionadded:: 0.18.1

    Notes

    -----

    Any Series passed will have their name attributes used unless row or column

    names for the cross-tabulation are specified.

    Any input passed containing Categorical data will have **all** of its

    categories included in the cross-tabulation, even if the actual data does

    not contain any instances of a particular category.

    In the event that there aren't overlapping indexes an empty DataFrame will

    be returned.

    Examples

    --------

a = np.array(["foo", "foo", "foo", "foo", "bar", "bar",

              "bar", "bar", "foo", "foo", "foo"], dtype=object)

b = np.array(["one", "one", "one", "two", "one", "one",

              "one", "two", "two", "two", "one"], dtype=object)

c = np.array(["dull", "dull", "shiny", "dull", "dull", "shiny",

              "shiny", "dull", "shiny", "shiny", "shiny"],

              dtype=object)

pd.crosstab(a, [b, c], rownames=['a'], colnames=['b', 'c'])

# doctest: +NORMALIZE_WHITESPACE

    b   one        two

    c   dull shiny dull shiny

    a

    bar    1     2    1     0

    foo    2     2    1     2

foo = pd.Categorical(['a', 'b'], categories=['a', 'b', 'c'])

bar = pd.Categorical(['d', 'e'], categories=['d', 'e', 'f'])

crosstab(foo, bar)  # 'c' and 'f' are not represented in the data,

                    # but they still will be counted in the output

# doctest: +SKIP

    col_0  d  e  f

    row_0

    a      1  0  0

    b      0  1  0

    c      0  0  0

    Returns

    -------

    crosstab : DataFrame
【每日一学】pandas_透视表函数&交叉表函数的更多相关文章
- pandas_使用透视表与交叉表查看业绩汇总数据
# 使用透视表与交叉表查看业绩汇总数据 import pandas as pd import numpy as np import copy # 设置列对齐 pd.set_option("d ...
- Pandas透视表和交叉表
透视表 参数名 说明 values 待聚合的列的名称.默认聚合所有数值列 index 用于分组的列名或其他分组键,出现在结果透视表的行 columns 用于分组的列表或其他分组键,出现在结果透视表的列 ...
- 2018.03.29 python-pandas 数据透视pivot table / 交叉表crosstab
#透视表 pivot table #pd.pivot_table(data,values=None,index=None,columns=None, import numpy as np import ...
- FastReport的交叉表实际使用的一个例子
计算发行-->定义份数月表(打开)出现 PosFraisPaysInput选择时间段后,点击“打印”.这个设计表格,就是交叉表. 交叉表的特点是:数据库是一条一条并列的但是出来的结果却是:横向是 ...
- RS导出Excel交叉表角对应的列占用多列问题
在Cognos报表展示的时候,很多用户为了计算会把数据报表导出成excel然后再做统计,于是乎我做的一张报表导出成Excel的时候就出现了这样的问题 从上图可以看出交叉表角对应的列 ‘一级手术’和‘二 ...
- pandas交叉表和透视表及案例分析
一.交叉表: 作用: 交叉表是一种用于计算分组频率的特殊透视图,对数据进行汇总 考察预测数据和正式数据的对比情况,一个作为行,一个作为列 案例: 医院预测病人病情: 真实病情如下数组(B:有病,M:没 ...
- pandas 之 交叉表-透视表
import numpy as np import pandas as pd 认识 A pivot table is a data summarization tool(数据汇总工具) frequen ...
- 你真的会玩SQL吗?表表达式,排名函数
你真的会玩SQL吗?系列目录 你真的会玩SQL吗?之逻辑查询处理阶段 你真的会玩SQL吗?和平大使 内连接.外连接 你真的会玩SQL吗?三范式.数据完整性 你真的会玩SQL吗?查询指定节点及其所有父节 ...
- 通过sql做数据透视表,数据库表行列转换(pivot和Unpivot用法)(一)
在mssql中大家都知道可以使用pivot来统计数据,实现像excel的透视表功能 一.MSsqlserver中我们通常的用法 1.Sqlserver数据库测试 ---创建测试表 Create tab ...
随机推荐
- Linux命令之sed
sed命令格式 sed [options] 'command' file(s) 选项 -e :直接在命令行模式上进行sed动作编辑,此为默认选项; -f :将sed的动作写在一个文件内,用–f fil ...
- CPS(Cyber-Physical Systems)白皮书-摘选
<中国制造2025>提出,“基于信息物理系统的智能装备.智能工厂等智能制造正在引领制造方式变革”,要围绕控制系统.工业软件.工业网络.工业云服务和工业大数据平台等,加强信息物理系统的研发与 ...
- iphone越狱安装python2.7
cydia 添加源地址:http://apt.so/whitefur 选择python 进行安装 打开ssh连接后输入python 显示python2.7.3 安装成功
- DataGridView之编码列重绘
实现方式如下: private void dgvRelation_RowPostPaint(object sender, DataGridViewRowPostPaintEventArgs e) { ...
- 黄聪:C# webBrowser控件禁用alert,confirm之类的弹窗解决方案
同样的代码,我尝试了很多次都没有成功.最后终于成功了,是因为我没有在正确的事件里面调用这段代码. private void InjectAlertBlocker() { HtmlElement hea ...
- 黄聪:HBuilder左侧项目管理器如何不与标签页一起自动切换
把这个按钮取消就好了
- ALGO-152_蓝桥杯_算法训练_8-2求完数
记: 掌握完数的概念 AC代码: #include <stdio.h> int main(void) { int i,j,sum; ; i <= ; i ++) { sum = ; ...
- 【剑指offer】二进制中1的个数
输入一个整数,输出该数二进制表示中1的个数.其中负数用补码表示. 思路:将原数字与1按位进行与操作. public class Solution { public int NumberOf1(int ...
- 阿里云服务器 ECS Linux SWAP 配置概要说明
SWAP 简介 Linux 中的 SWAP(交换分区),类似于 Windows 的虚拟内存.系统会把一部分硬盘空间虚拟成内存使用,将系统内非活动内存换页到 SWAP,以提高系统可用内存. 注:参阅 E ...
- JavaScript之图片操作5
本次的图片操作是要实现模仿天猫淘宝的放大镜效果,如下图所示: 其实现原理其实很简单,主要就是定位的运用,在上面的图中,左边是一个div,它的大小就是左边图片的大小,我们称为左窗口(原图),红色部分我们 ...
