ELK展示NGINX访问IP地理位置图
一、设置NGINX日志格式
[root@zabbix_server ~]# vim /etc/nginx/nginx.conf
    log_format access_json_log  '{"@timestamp":"$time_local",'

                                  '"http_host":"$http_host",'

                                  '"clinetip":"$remote_addr",'

                                  '"request":"$request",'

                                  '"status":"$status",'

                                  '"size":"$body_bytes_sent",'

                                  '"upstream_addr":"$upstream_addr",'

                                  '"upstream_status":"$upstream_status",'

                                  '"upstream_response_time":"$upstream_response_time",'

                                  '"request_time":"$request_time",'

                                  '"http_referer":"$http_referer",'

                                  '"http_user_agent":"$http_user_agent",'

                                  '"http_x_forwarded_for":"$http_x_forwarded_for"}';

    access_log  /var/log/nginx/access.log  access_json_log;
二、在logstash目录下,下载geolite数据库。
geoip是logstash的一个过滤插件,用于分析IP获取地理位置。
root@server- logstash]# wget http://geolite.maxmind.com/download/geoip/database/GeoLite2-City.tar.gz
---- ::--  http://geolite.maxmind.com/download/geoip/database/GeoLite2-City.tar.gz

正在解析主机 geolite.maxmind.com (geolite.maxmind.com)... 104.17.200.89, 104.17.201.89, ::::c859, ...

正在连接 geolite.maxmind.com (geolite.maxmind.com)|104.17.200.89|:... 已连接。

已发出 HTTP 请求,正在等待回应...  OK

长度: (29M) [application/gzip]

正在保存至: “GeoLite2-City.tar.gz”

% [===========================>                                                     ] ,,  .1KB/s 用时 11m 30s

-- :: (15.0 KB/s) - 在  字节处连接关闭。重试中。

---- ::--  (尝试次数: )  http://geolite.maxmind.com/download/geoip/database/GeoLite2-City.tar.gz

正在连接 geolite.maxmind.com (geolite.maxmind.com)|104.17.200.89|:... 已连接。

已发出 HTTP 请求,正在等待回应...  Partial Content

长度: (29M),剩余  (18M) [application/gzip]

正在保存至: “GeoLite2-City.tar.gz”

%[++++++++++++++++++++++++++++====================================================>] ,,  .2KB/s 用时 9m 9s

-- :: (34.4 KB/s) - 已保存 “GeoLite2-City.tar.gz” [/])
三、解压
[root@server- logstash]# tar -zxvf  GeoLite2-City.tar.gz

GeoLite2-City_20191119/

GeoLite2-City_20191119/LICENSE.txt

GeoLite2-City_20191119/GeoLite2-City.mmdb

GeoLite2-City_20191119/COPYRIGHT.txt

GeoLite2-City_20191119/README.txt

[root@server- logstash]#
四、设置logstash配置文件
在/etc/logstash/conf.d目录下新建一个nginx.conf的配置文件
[root@server- conf.d]# vim /etc/logstash/conf.d/nginx.conf
input {

  beats {

   port =>

  }

}

filter {

geoip {

  source => "clientip"

  target => "geoip"

  database => "/etc/logstash/GeoLite2-City_20191119/GeoLite2-City.mmdb"

  add_field => ["[geoip][coordinates]","%{[geoip][longitude]}"]

  add_field => ["[geoip][coordinates]","%{[geoip][latitude]}"]

}

}

output {

  stdout{

    codec=>rubydebug

  }

}
source:需要查询IP位置的源字段
target:目标字段。默认为geoip
database:IP位置信息数据库目录
add_field:增加经纬度字段
五、测试配置文件
[root@server- conf.d]# logstash -f /etc/logstash/conf.d/nginx.conf

WARNING: Could not find logstash.yml which is typically located in $LS_HOME/config or /etc/logstash. You can specify the path using --path.settings. Continuing using the defaults

Could not find log4j2 configuration at path /usr/share/logstash/config/log4j2.properties. Using default config which logs errors to the console

[INFO ] -- ::04.916 [main] scaffold - Initializing module {:module_name=>"fb_apache", :directory=>"/usr/share/logstash/modules/fb_apache/configuration"}

[INFO ] -- ::04.931 [main] scaffold - Initializing module {:module_name=>"netflow", :directory=>"/usr/share/logstash/modules/netflow/configuration"}

[WARN ] -- ::05.931 [LogStash::Runner] multilocal - Ignoring the 'pipelines.yml' file because modules or command line options are specified

[INFO ] -- ::06.292 [LogStash::Runner] runner - Starting Logstash {"logstash.version"=>"6.2.4"}

[INFO ] -- ::06.542 [Api Webserver] agent - Successfully started Logstash API endpoint {:port=>}

[INFO ] -- ::08.302 [Ruby--Thread-: /usr/share/logstash/vendor/bundle/jruby/2.3./gems/stud-0.0./lib/stud/task.rb:] pipeline - Starting pipeline {:pipeline_id=>"main", "pipeline.workers"=>, "pipeline.batch.size"=>, "pipeline.batch.delay"=>}

[INFO ] -- ::08.329 [[main]-pipeline-manager] geoip - Using geoip database {:path=>"/etc/logstash/GeoLite2-City_20191119/GeoLite2-City.mmdb"}

[INFO ] -- ::09.704 [[main]-pipeline-manager] beats - Beats inputs: Starting input listener {:address=>"0.0.0.0:10001"}

[INFO ] -- ::09.911 [Ruby--Thread-: /usr/share/logstash/vendor/bundle/jruby/2.3./gems/stud-0.0./lib/stud/task.rb:] pipeline - Pipeline started successfully {:pipeline_id=>"main", :thread=>"#<Thread:0x17715055@/usr/share/logstash/logstash-core/lib/logstash/pipeline.rb:247 run>"}

[INFO ] -- ::09.936 [Ruby--Thread-: /usr/share/logstash/vendor/bundle/jruby/2.3./gems/stud-0.0./lib/stud/task.rb:] agent - Pipelines running {:count=>, :pipelines=>["main"]}

[INFO ] -- ::09.948 [[main]<beats] Server - Starting server on port:
新开一个SSH连接,查看JAVA进程
[root@server- conf.d]# netstat -tunlp|grep java

tcp6              172.28.18.69:       :::*                    LISTEN      /java

tcp6              :::                :::*                    LISTEN      /java

tcp6              172.28.18.69:       :::*                    LISTEN      /java

tcp6              127.0.0.1:          :::*                    LISTEN      /java

tcp6              172.28.18.69:       :::*                    LISTEN      /java

tcp6              :::                  :::*                    LISTEN      /java
此时,10001端口已经被监听,启动成功,过一会屏幕打印收到的NGINX日志数据如如下:
              "http_referer" => "http://zabbix.9500.cn/zabbix.php?action=dashboard.view&ddreset=1",

             "upstream_addr" => "127.0.0.1:9000",

                  "clinetip" => "219.239.8.14",

                    "source" => "/var/log/nginx/access.log",

                      "beat" => {

            "name" => "zabbix_server.jinglong",

         "version" => "6.2.4",

        "hostname" => "zabbix_server.jinglong"

    },

                    "fields" => {

        "log_topics" => "nginx-172.28.18.75"

    },

                  "@version" => "",

           "upstream_status" => "",

           "http_user_agent" => "Mozilla/5.0 (Windows NT 6.1; WOW64) AppleWebKit/537.36 (KHTML, like Gecko) Chrome/49.0.2623.221 Safari/537.36 SE 2.X MetaSr 1.0",

                    "offset" => ,

                "prospector" => {

        "type" => "log"

    },

              "request_time" => "0.639",

                    "status" => "",

                      "host" => "zabbix_server.jinglong"

}

{

    "upstream_response_time" => "0.828",

                "@timestamp" => --20T09::.368Z,

                 "http_host" => "zabbix.9500.cn",

                      "tags" => [

        [] "beats_input_raw_event"

    ],

                   "request" => "GET /map.php?sysmapid=8&severity_min=0&sid=126eba41a3be1fb9&curtime=1574242326679&uniqueid=BCYQV&used_in_widget=1 HTTP/1.1",

      "http_x_forwarded_for" => "-",

                      "size" => "",

                     "geoip" => {

                    "ip" => "219.239.8.14",

             "longitude" => 116.3883,

         "country_code2" => "CN",

           "region_code" => "BJ",

         "country_code3" => "CN",

        "continent_code" => "AS",

              "timezone" => "Asia/Shanghai",

              "latitude" => 39.9289,

          "country_name" => "China",

           "region_name" => "Beijing",

              "location" => {

            "lon" => 116.3883,

            "lat" => 39.9289

        }

    },
此时已经能够看到geoip的数据了,包括经纬度、国家代码,国家名称、城市名称。
修改配置文件,指定需要的字段
[root@server- conf.d]# vim nginx.conf
filter {

geoip {

  source => "clinetip"

  database => "/etc/logstash/GeoLite2-City_20191119/GeoLite2-City.mmdb"

  fileds => ["country_name","region_name","longitude","latitude"]

}

}
fields:指定需要的字段
保存,退出,重新启动配置文件
             "request" => "POST /elasticsearch/_msearch HTTP/1.1",

           "upstream_status" => "",

                    "fields" => {

        "log_topics" => "nginx-172.28.18.75"

    },

                      "size" => "",

                      "beat" => {

            "name" => "zabbix_server.jinglong",

        "hostname" => "zabbix_server.jinglong",

         "version" => "6.2.4"

    },

              "request_time" => "0.159",

                    "offset" => ,

                  "@version" => "",

             "upstream_addr" => "172.28.18.69:5601",

                 "http_host" => "elk.9500.cn"

}

{

                     "geoip" => {

            "latitude" => 39.9289,

         "region_name" => "Beijing",

           "longitude" => 116.3883,

        "country_name" => "China"

    },

           "http_user_agent" => "Mozilla/5.0 (Windows NT 6.1; WOW64) AppleWebKit/537.36 (KHTML, like Gecko) Chrome/49.0.2623.221 Safari/537.36 SE 2.X MetaSr 1.0",

                "prospector" => {

        "type" => "log"

    },
此时geoip的数据字段就只显示我们指定的那几个了。修改配置文件将数据输出到elasticsearch
input {

  beats {

   port =>

  }

}

filter {

geoip {

  source => "clinetip"

  database => "/etc/logstash/GeoLite2-City_20191119/GeoLite2-City.mmdb"

  fields => ["country_name","region_name","longitude","latitude"]

}

}

output {

    elasticsearch {

     hosts=>["172.28.18.69:9200"]

      index=>"nginx-172.28.18.75-%{+YYYY.MM.dd}"

     }

}
启动logstash配置文件nginx.conf
~

[root@server- conf.d]# logstash -f /etc/logstash/conf.bak/nginx.conf

WARNING: Could not find logstash.yml which is typically located in $LS_HOME/config or /etc/logstash. You can specify the path using --path.settings. Continuing using the defaults

Could not find log4j2 configuration at path /usr/share/logstash/config/log4j2.properties. Using default config which logs errors to the console

[INFO ] -- ::40.934 [main] scaffold - Initializing module {:module_name=>"fb_apache", :directory=>"/usr/share/logstash/modules/fb_apache/configuration"}

[INFO ] -- ::40.965 [main] scaffold - Initializing module {:module_name=>"netflow", :directory=>"/usr/share/logstash/modules/netflow/configuration"}

[WARN ] -- ::41.962 [LogStash::Runner] multilocal - Ignoring the 'pipelines.yml' file because modules or command line options are specified

[INFO ] -- ::42.365 [LogStash::Runner] runner - Starting Logstash {"logstash.version"=>"6.2.4"}

[INFO ] -- ::42.637 [Api Webserver] agent - Successfully started Logstash API endpoint {:port=>}

[INFO ] -- ::44.436 [Ruby--Thread-: /usr/share/logstash/vendor/bundle/jruby/2.3./gems/stud-0.0./lib/stud/task.rb:] pipeline - Starting pipeline {:pipeline_id=>"main", "pipeline.workers"=>, "pipeline.batch.size"=>, "pipeline.batch.delay"=>}

[INFO ] -- ::45.078 [[main]-pipeline-manager] elasticsearch - Elasticsearch pool URLs updated {:changes=>{:removed=>[], :added=>[http://172.28.18.69:9200/]}}

[INFO ] -- ::45.089 [[main]-pipeline-manager] elasticsearch - Running health check to see if an Elasticsearch connection is working {:healthcheck_url=>http://172.28.18.69:9200/, :path=>"/"}

[WARN ] -- ::45.337 [[main]-pipeline-manager] elasticsearch - Restored connection to ES instance {:url=>"http://172.28.18.69:9200/"}

[INFO ] -- ::45.856 [[main]-pipeline-manager] elasticsearch - ES Output version determined {:es_version=>}

[WARN ] -- ::45.857 [[main]-pipeline-manager] elasticsearch - Detected a .x and above cluster: the `type` event field won't be used to determine the document _type {:es_version=>6}

[INFO ] -- ::45.874 [[main]-pipeline-manager] elasticsearch - Using mapping template from {:path=>nil}

[INFO ] -- ::45.878 [[main]-pipeline-manager] elasticsearch - Attempting to install template {:manage_template=>{"template"=>"logstash-*", "version"=>, "settings"=>{"index.refresh_interval"=>"5s"}, "mappings"=>{"_default_"=>{"dynamic_templates"=>[{"message_field"=>{"path_match"=>"message", "match_mapping_type"=>"string", "mapping"=>{"type"=>"text", "norms"=>false}}}, {"string_fields"=>{"match"=>"*", "match_mapping_type"=>"string", "mapping"=>{"type"=>"text", "norms"=>false, "fields"=>{"keyword"=>{"type"=>"keyword", "ignore_above"=>}}}}}], "properties"=>{"@timestamp"=>{"type"=>"date"}, "@version"=>{"type"=>"keyword"}, "geoip"=>{"dynamic"=>true, "properties"=>{"ip"=>{"type"=>"ip"}, "location"=>{"type"=>"geo_point"}, "latitude"=>{"type"=>"half_float"}, "longitude"=>{"type"=>"half_float"}}}}}}}}

[INFO ] -- ::45.897 [[main]-pipeline-manager] elasticsearch - New Elasticsearch output {:class=>"LogStash::Outputs::ElasticSearch", :hosts=>["//172.28.18.69:9200"]}

[INFO ] -- ::45.902 [[main]-pipeline-manager] geoip - Using geoip database {:path=>"/etc/logstash/GeoLite2-City_20191119/GeoLite2-City.mmdb"}

[INFO ] -- ::46.712 [[main]-pipeline-manager] beats - Beats inputs: Starting input listener {:address=>"0.0.0.0:10001"}

[INFO ] -- ::46.846 [Ruby--Thread-: /usr/share/logstash/vendor/bundle/jruby/2.3./gems/stud-0.0./lib/stud/task.rb:] pipeline - Pipeline started successfully {:pipeline_id=>"main", :thread=>"#<Thread:0x1b610349@/usr/share/logstash/logstash-core/lib/logstash/pipeline.rb:247 run>"}

[INFO ] -- ::46.909 [Ruby--Thread-: /usr/share/logstash/vendor/bundle/jruby/2.3./gems/stud-0.0./lib/stud/task.rb:] agent - Pipelines running {:count=>, :pipelines=>["main"]}

[INFO ] -- ::46.911 [[main]<beats] Server - Starting server on port:
六、配置kibana展示
打开kibana,建立索引
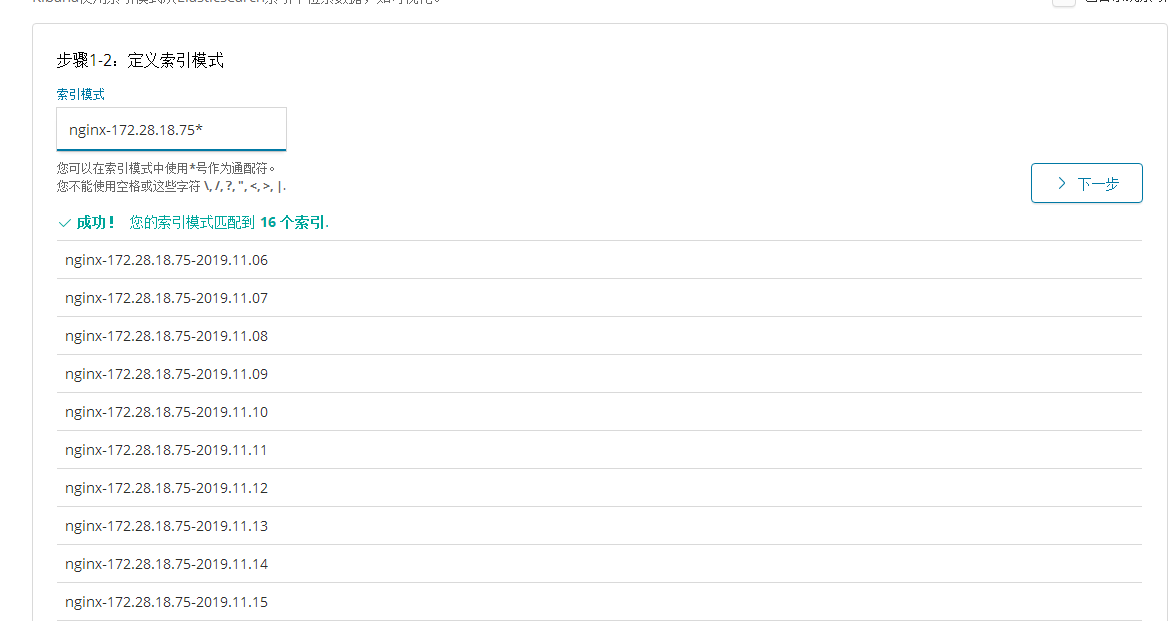
下一步,点击创建索引模式,创建成功后,就能看到索引对应的字段列表,其中包含geoip字段

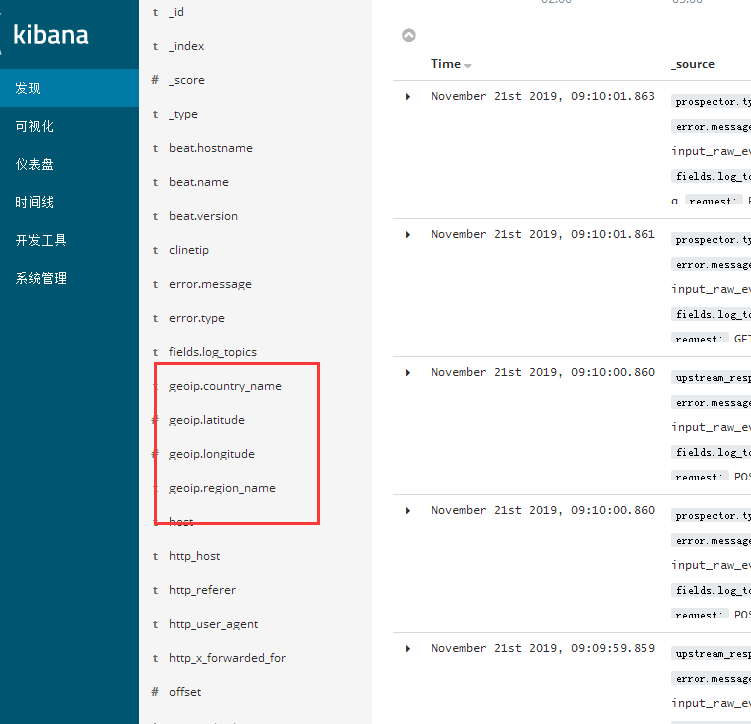
在“发现“里,新建,选择刚才建立的索引模式,,此时能看到关于geoip的相关字段

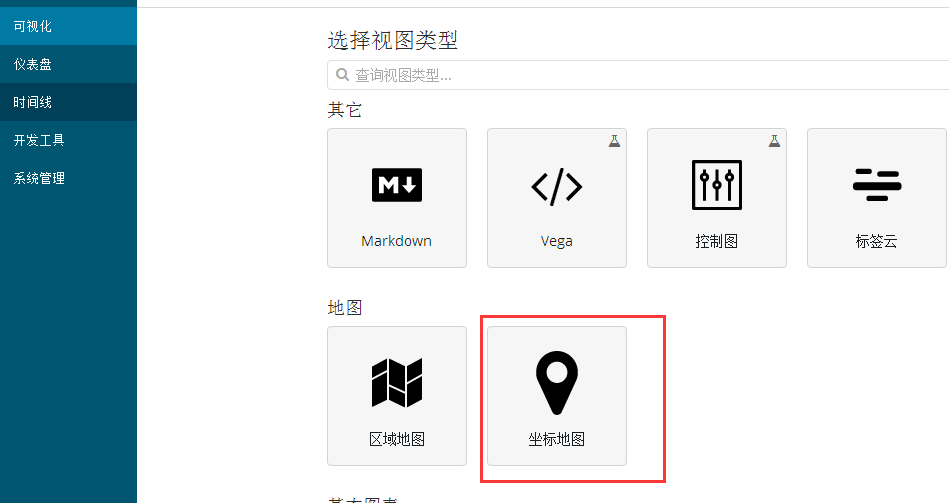
接下来,用地图展示数据
“可视化”里面点击创建一个可视化视图“,选择“坐标地图”
选择创建的索引,选择“选择buckets类型”为"GEOHASH"
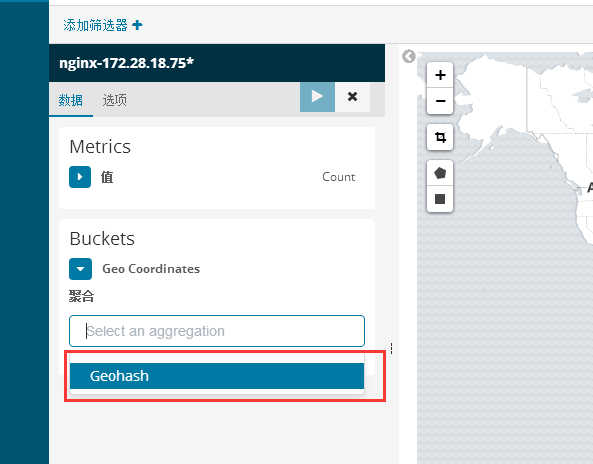
此时报错:
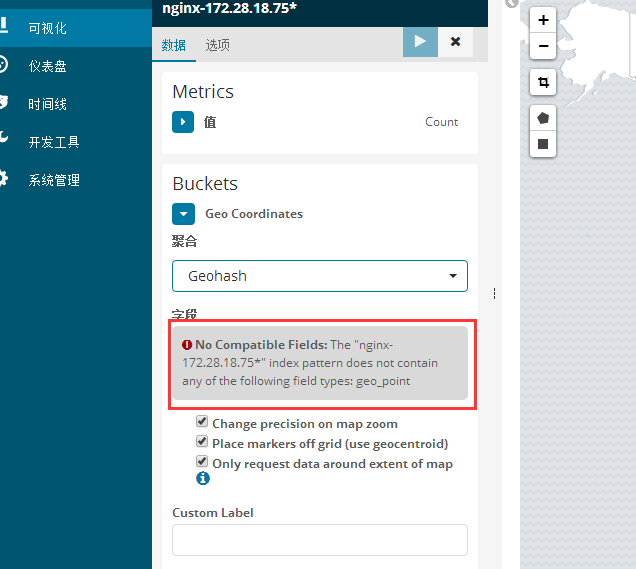
说没有发现字段类型为geo_point的数据字段,此时需要修改logstash配置文件,增加location字段
input {

  beats {

   port =>

  }

}

filter {

geoip {

  source => "clinetip"

  database => "/etc/logstash/GeoLite2-City_20191119/GeoLite2-City.mmdb"

  fields => ["country_name","region_name","location"]

}

}

output {

    elasticsearch {

     hosts=>["172.28.18.69:9200"]

      index=>"nginx-172.28.18.75-%{+YYYY.MM.dd}"

     }

}
重启logstash配置文件,并删除elasticsearch 的索引
[root@server- conf.d]# curl -XDELETE http://172.28.18.69:9200/nginx-172.28.18.75-*
重启kibana
root@server- conf.d]# systemctl restart kibana
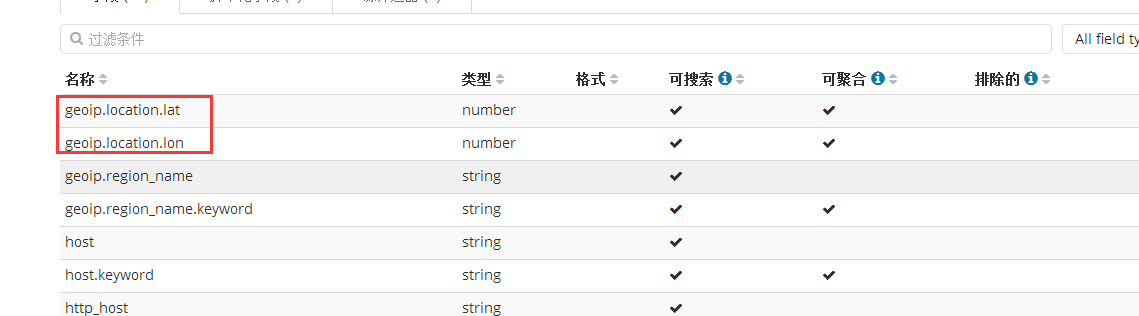
打开kibana,重新建立索引,发现已经有了geoip.location字段
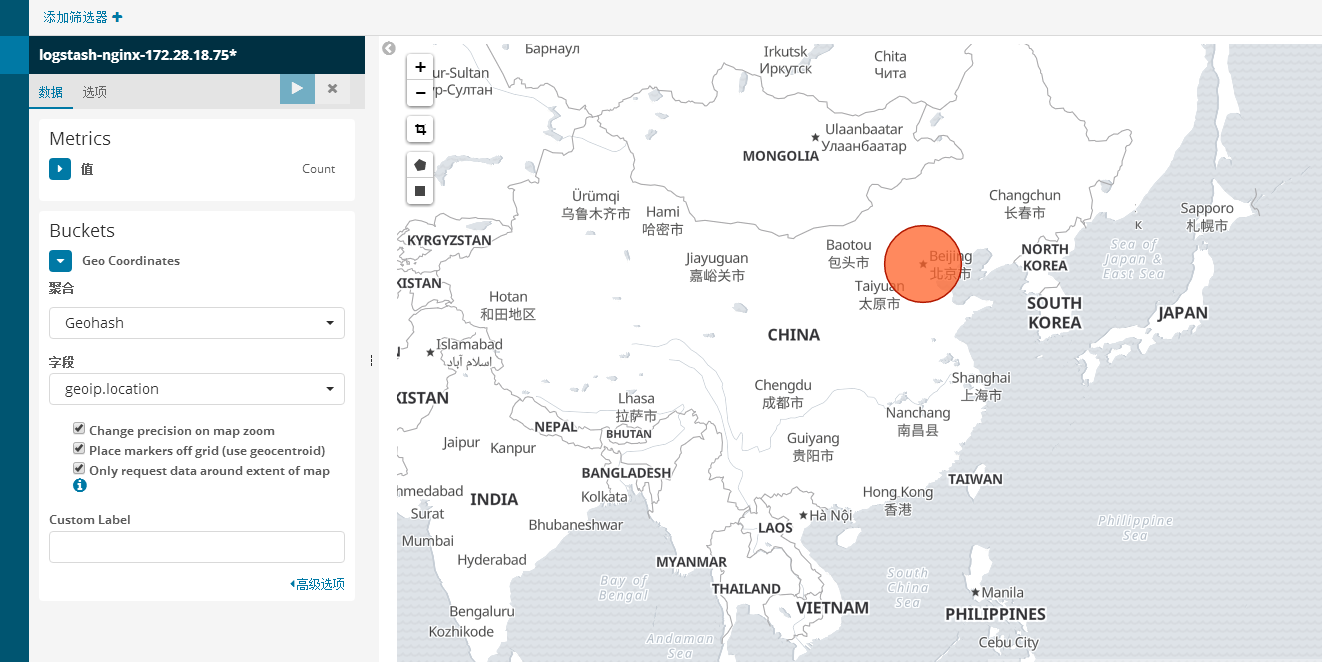
再建立坐标地图,还是报错
后来,百度发现是因为输出index的文件名不对,必须以logstash开头才可以使location字段输出为geo_point类型,于是修改logstash配置文件
input {

  beats {

   port =>

  }

}

filter {

geoip {

  source => "clinetip"

  database => "/etc/logstash/GeoLite2-City_20191119/GeoLite2-City.mmdb"

  fields => ["country_name","region_name","location"]

  #add_field => [ "[geoip][coordinates]", "%{[geoip][longitude]}" ]

  #add_field => [ "[geoip][coordinates]", "%{[geoip][latitude]}" ]

}

}

output {

    elasticsearch {

     hosts=>["172.28.18.69:9200"]

     index=>"logstash-nginx-172.28.18.75-%{+YYYY.MM.dd}"

     }

}
将index文件名改为logstash-nginx-172.28.18.75-%{+YYYY.MM.dd},重新启动配置文件,并删除以前的index
[root@server- conf.d]# logstash -f /etc/logstash/conf.bak/nginx.conf
curl -XDELETE http://172.28.18.69:9200/nginx-172.28.18.75-2019.11.21
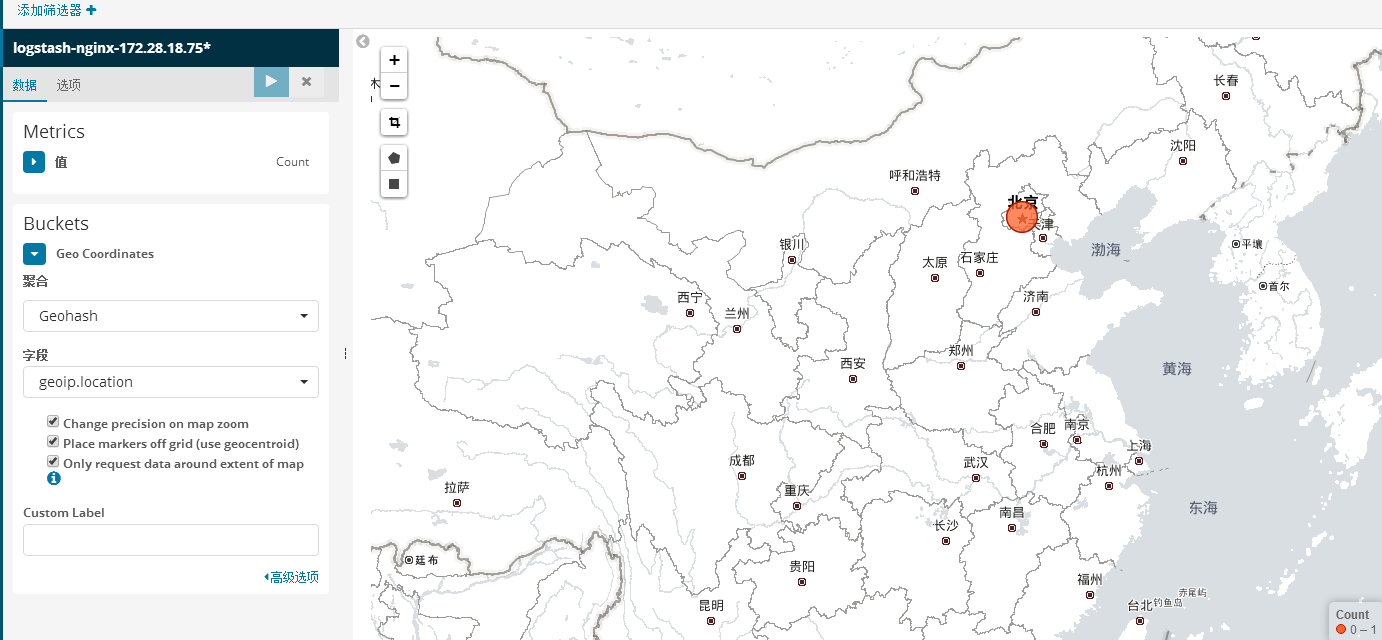
打开kibana,删除之前的索引,重新建立索引

此时,发现geoip.location字段的类型变成了geo_point,问题解决,重新建立坐标地图
展示数据成功。
七、使用高德地图展示数据为中文
编辑kibana配置文件,在最后加一行
tilemap.url: 'http://webrd02.is.autonavi.com/appmaptile?lang=zh_cn&size=1&scale=1&style=7&x={x}&y={y}&z={z}'
[root@server- conf.d]# vim /etc/kibana/kibana.yml
# The default locale. This locale can be used in certain circumstances to substitute any missing

# translations.

#i18n.defaultLocale: "en"

tilemap.url: 'http://webrd02.is.autonavi.com/appmaptile?lang=zh_cn&size=1&scale=1&style=7&x={x}&y={y}&z={z}'
重启kibana
[root@server- conf.d]# systemctl restart kibana
刷新kibana页面,即可显示中文地图
ELK展示NGINX访问IP地理位置图的更多相关文章
- 利用 ELK系统分析Nginx日志并对数据进行可视化展示
一.写在前面 结合之前写的一篇文章:Centos7 之安装Logstash ELK stack 日志管理系统,上篇文章主要讲了监控软件的作用以及部署方法.而这篇文章介绍的是单独监控nginx 日志分析 ...
- 设置nginx禁止IP直接访问,只能通过指定的域名访问
nginx的版本是1.2.1. 设置配置文件disableip.conf: server { listen 80; server_name _; return500; } 这是 ...
- Nginx禁止ip访问或IP网段访问方法
Nginx禁止ip访问可以防止指定IP访问我们的网站,本例子可以实现是防止单IP访问或IP网段访问了,非常的有用我们一起来看看吧. 常用的linux做法 iptables参考规则 代码如下 复制代码 ...
- Nginx 禁止IP访问
我们在使用的时候会遇到很多的恶意IP攻击,这个时候就要用到Nginx 禁止IP访问了.下面我们就先看看Nginx的默认虚拟主机在用户通过IP访问,或者通过未设置的域名访问(比如有人把他自己的域名指向了 ...
- 使用python找出nginx访问日志中访问次数最多的10个ip排序生成网页
使用python找出nginx访问日志中访问次数最多的10个ip排序生成网页 方法1:linux下使用awk命令 # cat access1.log | awk '{print $1" &q ...
- Nginx禁止IP访问,只允许域名访问
Nginx禁止IP访问,只允许域名访问 我们在使用nginx的过程中会遇到很多的恶意IP攻击,这个时候就要用到Nginx 禁止IP访问了. 1.直接返回403错误 server { listen de ...
- Nginx反向代理+Tomcat+Springmvc获取用户访问ip
Nginx+Tomcat+Springmvc获取用户访问ip 1.Nginx反向代理 修改Nginx配置文件 location / { ***********之前代码*******; proxy_se ...
- nginx 查看访问 IP 并封禁 IP 详解
1.查找服务器所有访问者ip方法: awk '{print $1}' nginx_access.log |sort |uniq -c|sort -n nginx.access.log 为nginx访问 ...
- Linux(7)- Nginx.conf主配置文件、Nginx虚拟主机/访问日志/限制访问IP/错误页面优化、Nginx反向代理、Nginx负载均衡
一.Nginx.conf主配置文件 Nginx主配置文件conf/nginx.conf是一个纯文本类型的文件,整个配置文件是以区块的形式组织的.一般,每个区块以一对大括号{}来表示开始与结束. 核心模 ...
随机推荐
- java数据机构之自定义栈
一.栈的特点 1.线性数据结构 2.后进先出 二.使用数组来实现栈 //使用数组来实现栈 public class MyArrayStack<E> { //保存数据 private Obj ...
- vue cli创建typescript项目
使用最新的Vue CLI @vue/cli创建typescript项目,使用vue -V查看当前的vue cli版本 安装命令 npm install -g @vue-cli 创建项目 vue cre ...
- nexus私服库被误删如何恢复
恢复步骤: 1,登录nexus服务器,找到nexus安装目录(默认/usr/local/下): 2,找到sonatype-work/nexus/trash 下找到你删除的库: 3,copy到指定的so ...
- hadoop第一个程序WordCount
hadoop第一个程序WordCount package test; import org.apache.hadoop.mapreduce.Job; import java.io.IOExceptio ...
- thinkPHP 出现route不起作用提示No input file specified.
修改.htaccess文件 原因在于使用的PHP是fast_cgi模式,而在某些情况下,不能正确识别path_info所造成的错误. 打开.htaccess 在RewriteRule 后面的index ...
- ip地址查询python3小工具_V0.0.1
看到同事在一个一个IP地址的百度来确认导出表格中的ip地址所对应的现实世界的地址是否正确,决定给自己新开一个坑.做一个查询ip“地址”的python小工具,读取Excel表格,在表格中的后续列输出尽可 ...
- 2019/5/13 洛谷P4742 【tarjan缩点 + 拓扑dp】
题目链接:https://www.luogu.org/problemnew/show/P4742 题目大意:给一张有向图, 每个点都有点权,第一次经过该点时,该点的点权有贡献,求这张图上一条路径(终点 ...
- hdoj6446(树形DP)
题目链接:https://vjudge.net/problem/HDU-6446 题意:简化题意后就是求距离和的2*(n-1)!倍. 思路: 简单的树形dp,通过求每条边的贡献计算距离和,边(u,v) ...
- Nginx整合Tomcat
现在先不考虑集群的配置问题,只实现Nginx实现一台tomact的代理 1.我们需要一个web项目,这里我把先准备好的web.war文件部署到Tomact服务器上 mvn clean install ...
- SQLite基础-7.子句(一)
目录 SQLite子句(一) 1. WHERE子句 2. LIKE子句 3. GLOB 子句 4. Oreder By 子句 SQLite子句(一) 1. WHERE子句 WHERE 子句后面跟着条件 ...