vue教程6-图表
引入
cnpm install echarts --save

#在vue项目目录下安装echarts
静态折线图

linechart.js
import echarts from 'echarts'
export const option = {
// backgroundColor: 'rgba(57,64,86,0.02)',
// 标题
title: {
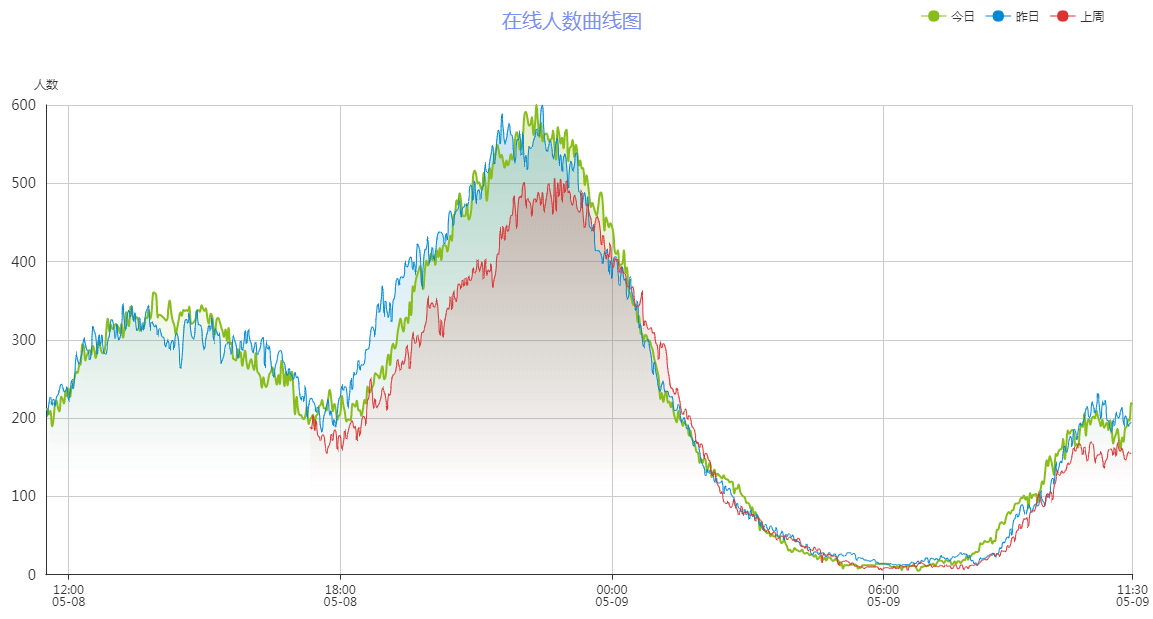
text: '在线人数曲线图',
x: 'center',
textStyle: {
fontWeight: 'normal',
fontSize: 20,
color: '#7a8ff3'
}
},
// 鼠标悬浮提示框
tooltip: {
trigger: 'axis'
},
// 图示
legend: {
data: ['今日', '昨日', '上周'],
right: '4%'
},
// 边框栅格
grid: {
top: 100,
left: '2%',
right: '2%',
bottom: '2%',
containLabel: true
},
// X轴
xAxis: [{
type: 'category',
boundaryGap: false,
data: ['13:00', '13:05', '13:10', '13:15', '13:20', '13:25', '13:30', '13:35', '13:40', '13:45', '13:50', '13:55']
}],
// Y轴
yAxis: [{
type: 'value',
name: '人数',
axisTick: {
show: false
},
axisLabel: {
margin: 10,
textStyle: {
fontSize: 14
}
}
}],
// 图示数据
series: [{
name: '今日',
type: 'line',
smooth: true,
symbol: 'circle',
symbolSize: 5,
showSymbol: false,
areaStyle: {
normal: {
color: new echarts.graphic.LinearGradient(0, 0, 0, 1, [{
offset: 0,
color: 'rgba(137, 189, 27, 0.3)'
}, {
offset: 0.8,
color: 'rgba(137, 189, 27, 0)'
}], false),
shadowColor: 'rgba(0, 0, 0, 0.1)',
shadowBlur: 10
}
},
itemStyle: {
normal: {
color: 'rgb(137,189,27)',
borderColor: 'rgba(137,189,2,0.27)',
borderWidth: 12
}
},
data: []
}, {
name: '昨日',
type: 'line',
smooth: true,
symbol: 'circle',
symbolSize: 5,
showSymbol: false,
lineStyle: {
normal: {
width: 1
}
},
areaStyle: {
normal: {
color: new echarts.graphic.LinearGradient(0, 0, 0, 1, [{
offset: 0,
color: 'rgba(0, 136, 212, 0.3)'
}, {
offset: 0.8,
color: 'rgba(0, 136, 212, 0)'
}], false),
shadowColor: 'rgba(0, 0, 0, 0.1)',
shadowBlur: 10
}
},
itemStyle: {
normal: {
color: 'rgb(0,136,212)',
borderColor: 'rgba(0,136,212,0.2)',
borderWidth: 12
}
},
data: []
}, {
name: '上周',
type: 'line',
smooth: true,
symbol: 'circle',
symbolSize: 5,
showSymbol: false,
lineStyle: {
normal: {
width: 1
}
},
areaStyle: {
normal: {
color: new echarts.graphic.LinearGradient(0, 0, 0, 1, [{
offset: 0,
color: 'rgba(219, 50, 51, 0.3)'
}, {
offset: 0.8,
color: 'rgba(219, 50, 51, 0)'
}], false),
shadowColor: 'rgba(0, 0, 0, 0.1)',
shadowBlur: 10
}
},
itemStyle: {
normal: {
color: 'rgb(219,50,51)',
borderColor: 'rgba(219,50,51,0.2)',
borderWidth: 12
}
},
data: []
}]
}
chart.vue
<template>

  <div class="chart-container">

    <!--创建一个echarts的容器,给定高宽-->

    <div id="gamechart" style="width:100%; height:100%"/>

  </div>

</template>

<script>

// 安装echarts后,直接引入

import echarts from 'echarts'

import { option } from './linechart'

export default {

  data() {

    return {

      chart: {},

      option: option

    }

  },

  created() {

    this.fetchData()

  },

  // 挂载图表函数

  mounted() {

    this.initChart()

  },

  methods: {

    fetchData() {

      this.chart = {

        today: [220, 182, 191, 134, 150, 120, 110, 125, 145, 122, 165, 122],

        lastday: [120, 110, 125, 145, 122, 165, 122, 220, 182, 191, 134, 150],

        lastweek: [220, 182, 125, 145, 122, 191, 134, 150, 120, 110, 165, 122]

      }

      this.option.series[0].data = this.chart.today

      this.option.series[1].data = this.chart.lastday

      this.option.series[2].data = this.chart.lastweek

    },

    initChart() {

      // 将chart初始化的实例绑定到一个DOM

      this.chart = echarts.init(document.getElementById('gamechart'))

      this.chart.setOption(this.option)

    }

  }

}

</script>

<style scoped>

  .chart-container{

    position: relative;

    width: 100%;

    height: calc(100vh - 84px);

  }

</style>
从后台获取数据
- echarts的时间戳格式是13位,精确到毫秒
- 后台给出的时间戳是变化的,所以在图表上,会展示最新时间的数据
[[[1557309121000,5901],[1557309241000,5962],[1557309361000,5992],[1557309480000,5983],[1557309600000,5949],[1557309720000,6047]]

#这是后台给出的api数据

#echarts可以从后台获取包含时间戳和数据的二维数组
  methods: {

    fetchData() {

      getGameChart(this.gameid).then(response => {

        this.option.series[0].data = response.today

        this.option.series[1].data = response.lastday

        this.option.series[2].data = response.lastweek

        this.chart.setOption(this.option)

        this.chart.hideLoading()

      }).catch(error => {

        this.$message.error('图表请求数据失败啦!')

        console.log(error)

      })

    },

    initChart() {

      // 将chart初始化的实例绑定到一个DOM

      this.chart = echarts.init(document.getElementById('gamechart'))

      this.chart.showLoading({

        text: '正在努力的读取数据中...'

      })

    }

  }

#在vue中请求后台api,然后将返回的数据赋值给this.option.series的几个数组
vue教程6-图表的更多相关文章
- 网页图表Highcharts实践教程之图表代码构成
网页图表Highcharts实践教程之图表代码构成 Highcharts第一个实例 下面我们来实现本书的第一个Highcharts实例. [实例1-1]下面来制作北京连续一周最高温度折线图.操作过程如 ...
- vue教程3-05 vue组件数据传递、父子组件数据获取,slot,router路由
vue教程3-05 vue组件数据传递 一.vue默认情况下,子组件也没法访问父组件数据 <!DOCTYPE html> <html lang="en"> ...
- vue教程3-04 vue.js vue-devtools 调试工具的下载安装和使用
vue教程3-04 vue.js vue-devtools vue调试工具的安装和使用 一.vue-devtools 下载与安装 1.需要 fan qiang 2.打开谷歌浏览器设置--->扩展 ...
- vue教程3-03 vue组件,定义全局、局部组件,配合模板,动态组件
vue教程3-03 vue组件,定义全局.局部组件,配合模板,动态组件 一.定义一个组件 定义一个组件: 1. 全局组件 var Aaa=Vue.extend({ template:'<h3&g ...
- vue教程3-02 vue动画
vue教程3-02 vue动画 以下代码,已经用包管理器下载好vue,animate <!DOCTYPE html> <html lang="en"> &l ...
- vue教程3-01 路由、组件、bower包管理器使用
vue教程3-01 路由.组件.包管理器 以下操作前提是 已经安装好node.js npm bower-> (前端)包管理器 下载: npm install bower -g 验证: bower ...
- vue教程2-08 自定义键盘信息、监听数据变化vm.$watch
vue教程2-08 自定义键盘信息 @keydown.up @keydown.enter @keydown.a/b/c.... 自定义键盘信息: Vue.directive('on').keyCode ...
- vue教程2-07 自定义指令
vue教程2-07 自定义指令 自定义指令: 一.属性: Vue.directive(指令名称,function(参数){ this.el -> 原生DOM元素 }); <div v-re ...
- vue教程2-07 微博评论功能
vue教程2-07 微博评论功能 <!doctype html> <html> <head> <meta charset="utf-8"& ...
- vue教程2-06 过滤器
vue教程2-06 过滤器 过滤器: vue提供过滤器: capitalize uppercase currency.... <div id="box"> {{msg| ...
随机推荐
- Spring Boot2.0之 yml的使用
yml Spring Boot 默认读取 .yml .properties 结尾的 yml非常好的作用,比properties更节约 结构清晰 server: port: 8090 con ...
- Kbuntu16.04利用快捷键调用终端Konsole
之前用其他linux,可以按ctrl alt t三个键快速调用终端.但是我用Kbuntu16.04这个版本的时候却不行.于是跑去自定义了一下下. System Settings --> Wo ...
- 加州小学grade1,学习计划
Visual vocabulary Grammar Spelling Maths Chapter 1 Patterns and Number SenseChapter 2Understanding A ...
- animate旋转动画练习,css3形变练习
<!DOCTYPE html> <!-- saved from url=(0048)http://yinjiazeng.github.io/test/dial/index.html ...
- Promise 入门与使用
Tags: ECMAScript6 参考资料 promises-book Promise对象 we-have-a-problem-with-promises Promise最初被提出是在 E语言中, ...
- 【LeetCode】026. Remove Duplicates from Sorted Array
题目: Given a sorted array, remove the duplicates in place such that each element appear only once and ...
- VijosP1100:加分二叉树
描述 设一个n个节点的二叉树tree的中序遍历为(l,2,3,…,n),其中数字1,2,3,…,n为节点编号.每个节点都有一个分数(均为正整数),记第i个节点的分数为di,tree及它的每个子树都有一 ...
- AI-Info-Micron-Solutions-Menu:Solutions
ylbtech-AI-Info-Micron-Solutions-Menu:Solutions 1.返回顶部 1. 按应用分类 汽车解决方案 美光科技不仅是你的存储提供商,更是你的长期合作伙伴.我们提 ...
- 浅析C语言中strtol()函数与strtoul()函数的用法
转自:http://www.jb51.net/article/71463.htm C语言strtol()函数:将字符串转换成long(长整型数) 头文件: ? 1 #include <stdli ...
- 深入理解和探究Java类加载机制
深入理解和探究Java类加载机制---- 1.java.lang.ClassLoader类介绍 java.lang.ClassLoader类的基本职责就是根据一个指定的类的名称,找到或者生成其对应的字 ...