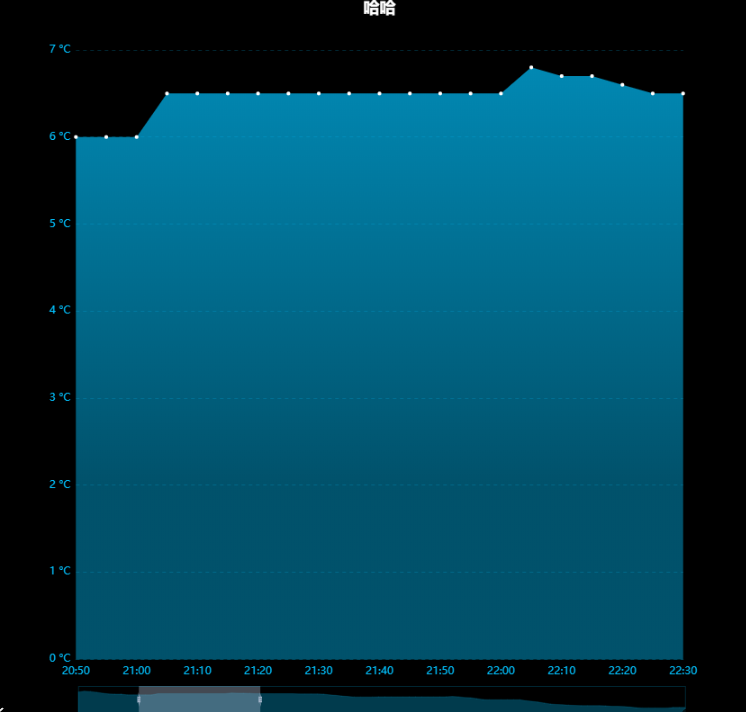
echarts-带面积的折线图
测试地址   https://gallery.echartsjs.com/editor.html?c=x6p5SsIEzt

var listN = '高温';

var unit = '°C'; //单位

var timeArray = ["20:00", "20:05", "20:10", "20:15", "20:20", "20:25", "20:30", "20:35", "20:40", "20:45", "20:50", "20:55", "21:00", "21:05", "21:10", "21:15", "21:20", "21:25", "21:30", "21:35", "21:40", "21:45", "21:50", "21:55", "22:00", "22:05", "22:10", "22:15", "22:20", "22:25", "22:30", "22:35", "22:40", "22:45", "22:50", "22:55", "23:00", "23:05", "23:10", "23:15", "23:20", "23:25", "23:30", "23:35", "23:40", "23:45", "23:50", "23:55", "00:00", "00:05", "00:10", "00:15", "00:20", "00:25", "00:30", "00:35", "00:40", "00:45", "00:50", "00:55", "01:00", "01:05", "01:10", "01:15", "01:20", "01:25", "01:30", "01:35", "01:40", "01:45", "01:50", "01:55", "02:00", "02:05", "02:10", "02:15", "02:20", "02:25", "02:30", "02:35", "02:40", "02:45", "02:50", "02:55", "03:00", "03:05", "03:10", "03:15", "03:20", "03:25", "03:30", "03:35", "03:40", "03:45", "03:50", "03:55", "04:00", "04:05", "04:10", "04:15"]; //时间

var dataArray = ["7.2", "7.6", "7.4", "7.1", "6.7", "6.4", "6.3", "6.3", "6.0", "6.0", "6.0", "6.0", "6.0", "6.5", "6.5", "6.5", "6.5", "6.5", "6.5", "6.5", "6.5", "6.5", "6.5", "6.5", "6.5", "6.8", "6.7", "6.7", "6.6", "6.5", "6.5", "6.5", "6.5", "6.5", "6.5", "6.5", "6.4", "6.4", "6.4", "6.4", "6.3", "6.0", "5.8", "5.5", "5.3", "5.1", "5.1", "5.1", "5.1", "5.2", "5.2", "5.2", "5.2", "5.2", "5.2", "5.2", "5.2", "5.2", "5.2", "5.2", "5.2", "5.3", "5.2", "4.9", "4.8", "4.4", "4.0", "3.9", "3.9", "3.9", "3.9", "3.9", "3.9", "3.5", "3.2", "2.9", "2.5", "2.1", "1.9", "1.8", "1.6", "1.5", "1.4", "1.4", "1.4", "1.4", "1.3", "1.1", "1.1", "1.0", "0.8", "0.5", "0.4", "0.4", "0.4", "0.4", "0.4", "0.6", "0.6", "0.6"]; //data

option = {

     backgroundColor: '#000',//背景颜色

     title: {

          left: 'center',

          text: '工作机器人数',

          textStyle: {

              color: '#fff' //标题颜色

          }

     },

    tooltip: {

        trigger: 'axis',

        formatter: ('{b}<br />{a}:{c}'+unit),

    },

    dataZoom: {

        bottom: '0',

         start: 10, //数据窗口范围的起始百分比

         end: 30,  //数据窗口范围的结束百分比

           handleSize: "50%",

        dataBackground: {

            lineStyle: {

                color: '#02C2FF'

            },

            areaStyle: {

                color: 'rgba(2,194,255,1)'

            }

        },

        borderColor: 'rgba(2,194,255,0.2)',

        textStyle: {

            color: '#02C2FF',

        }

    },

    xAxis: [{

        type: 'category',

        boundaryGap: false,

        axisLine: {

            show: true,

            lineStyle: {

                 color: 'rgba(2,194,255,0.2)' //横坐标那一条线的颜色

            },

         },

         axisLabel: {

            textStyle: {

                 color: '#02C2FF', //横坐标  字段名的颜色

                // color:"red",

                fontSize: 12,

                margin:15,

            },

        },

        axisTick: { show: false,},

        data: timeArray

    }],

    yAxis: [{

        type: 'value',

        splitLine: {

            show: true,

            lineStyle: {

                 color: 'rgba(2,194,255,0.2)', //横坐标  分割线颜色

            }

        },

        axisLine: {show: false,},

        axisLabel: {

             margin:6,

            textStyle: {

                color: '#02C2FF'

            },

            formatter: ('{value} '+unit)

        },

        axisTick: { show: false,},

        data:['0','4','8','12','16','20']

    }],

    series: [{

        name: listN,

        type: 'line',

           symbol:'circle',

        symbolSize:4,

        lineStyle: {

            normal: {

                opacity:0

            }

        },

        itemStyle:{

            color:'#FFFFFF'

        },

        areaStyle: { //区域填充样式

            normal: {

                color: new echarts.graphic.LinearGradient(0, 0, 0, 1, [

                   { offset: 0,  color: 'rgba(2,194,255,1)'}, //上边区域

                   { offset: 0.7,  color: 'rgba(2,194,255,0.6)'} //下边的区域

                ], false)

            }

        },

        data: dataArray

    }]

};
echarts-带面积的折线图的更多相关文章
- HighCharts之2D带Label的折线图
HighCharts之2D带Label的折线图 1.HighCharts之2D带Label的折线图源码 LineLabel.html: <!DOCTYPE html> <html&g ...
- 解决echarts的叠堆折线图数据出现坐标和值对不上的问题
原文:https://blog.csdn.net/qq_36538012/article/details/88889545 ------------------------------- 说一个小bu ...
- ECharts问题--柱状图和折线图中xAxis.data为空时报错问题解决
1. 我们在日常的开发中使用Echarts时,不像在学习的过程中是自己在option中的配置项填写图表需要的参数,而是通过ajax请求后台,获取数据后,使用javascript来动态的修改数据,但是有 ...
- echarts双y轴折线图柱状图混合实时更新图
先看下效果,自己用ps做了张gif图,发现很好玩啊..不喜勿喷 自己下载个echarts.min.js 直接上代码: <!DOCTYPE html><html><head ...
- echarts模拟highcharts实现折线图的虚实转换
多的不说直接上代码: <html><html lang="en"><head> <meta charset="utf-8&quo ...
- HighCharts中的无主题的2D折线图
HighCharts中的无主题的2D折线图 1.设计源码 <!DOCTYPE html> <html> <head> <meta charset=" ...
- HighCharts中的Ajax请求的2D折线图
HighCharts中的Ajax请求的2D折线图 设计源码: <!DOCTYPE html> <html> <head> <meta charset=&quo ...
- 又快又好!巧用ChartJS打造你的实用折线图
又快又好!巧用ChartJS打造你的实用折线图 最终效果 本示例利用官方示例改造而成,生成带图示的折线图,标出各折线的名称,可以筛选想要显示的折线. 要实现最终效果,我们要分三步走: 生成折线图: 生 ...
- 第四篇:R语言数据可视化之折线图、堆积图、堆积面积图
折线图简介 折线图通常用来对两个连续变量的依存关系进行可视化,其中横轴很多时候是时间轴. 但横轴也不一定是连续型变量,可以是有序的离散型变量. 绘制基本折线图 本例选用如下测试数据集: 绘制方法是首先 ...
随机推荐
- luoguP3531 [POI2012]LIT-Letters
(https://www.luogu.org/problem/P3531) 注意编号 #include<cstdio> #include<algorithm> #include ...
- pycharm 远程连接
1.连接远程项目 2.连接远程服务器
- jpa复杂查询groupby失败的原因以及替代方法-20190824
问题 1 jpa specification 复杂查询,拼接group by 时,分页会触发select count (*),导致指定select * from table group by 字段 ...
- R语言填充空缺值
在R语言中, imputeMissings包的特点是,如果空值是数值型,则使用median代替,如果使用的是character类型,则使用mode值代替. imputeMissing中,需要的包是im ...
- APP兼容性测试(三)测试方案设计
1. 背景 App的兼容性问题可能会导致流失潜在的客户,为了尽量减少因兼容性问题导致的同类问题,进一步提高产品的质量,提升用户体验,所以进行兼容性测试,尽可能多的保证更多的用户都可以正常使用app. ...
- tensorflow之tf.to_float
1. tf.to_float() # 将张量转换为float32类型 2. tf.to_int32() # 将张量转换为int32类型 等等, 就是将张量转换成某一种类型.
- CodeForce 359C Prime Number
Prime Number CodeForces - 359C Simon has a prime number x and an array of non-negative integers a1, ...
- 也作一下装配脑袋的Expression习题【转】
一.习题 http://www.cnblogs.com/Ninputer/archive/2009/08/28/expression_tree1.html 二.参考 http://msdn.micro ...
- VS 中批量格式化、删除未使用的 using 语句代码的插件
插件名称:Format All Files 插件地址:https://marketplace.visualstudio.com/items?itemName=munyabe.FormatAllFile ...
- Weblogic-SSRF漏洞复现
Weblogic-SSRF漏洞复现 一.SSRF概念 服务端请求伪造(Server-Side Request Forgery),是一种有攻击者构造形成有服务端发起请求的一个安全漏洞.一般情况下,SSR ...