
ELK实时日志分析平台环境部署,以及可视化展示
ELK是三个开源软件的缩写,分别表示:Elasticsearch , Logstash, Kibana , 它们都是开源软件。新增了一个FileBeat,它是一个轻量级的日志收集处理工具(Agent),Filebeat占用资源少,适合于在各个服务器上搜集日志后传输给Logstash,官方也推荐此工具。
Elasticsearch是个开源分布式搜索引擎,提供搜集、分析、存储数据三大功能。它的特点有:分布式,零配置,自动发现,索引自动分片,索引副本机制,restful风格接口,多数据源,自动搜索负载等。
Logstash 主要是用来日志的搜集、分析、过滤日志的工具,支持大量的数据获取方式。一般工作方式为c/s架构,client端安装在需要收集日志的主机上,server端负责将收到的各节点日志进行过滤、修改等操作在一并发往elasticsearch上去。
Kibana 也是一个开源和免费的工具,Kibana可以为 Logstash 和 ElasticSearch 提供的日志分析友好的 Web 界面,可以帮助汇总、分析和搜索重要数据日志。
系统环境(rhel7.3):
elasticsearch:6.6.1
logstash:6.6.1
kibana:6.6.1
1.elasticsearch的搭建
[root@base1 ~]# ls
elasticsearch-6.6.1.rpm
jdk-8u181-linux-x64.rpm
[root@base1 ~]# rpm -ivh jdk-8u181-linux-x64.rpm
[root@base1 ~]# rpm -ivh elasticsearch-6.6.1.rpm
[root@base1 ~]# cd /etc/elasticsearch/
[root@base1 elasticsearch]# vim elasticsearch.yml
17 cluster.name: my-es
23 node.name: base1
43 bootstrap.memory_lock: true # 内存锁定,不会交互到swap
55 network.host: 172.25.78.11
59 http.port: 9200
[root@base1 elasticsearch]# vim /etc/security/limits.conf
elasticsearch soft memlock unlimited # 内存资源限制
elasticsearch hard memlock unlimited
elasticsearch - nofile 65536
elasticsearch - nproc 4096
[root@base1 elasticsearch]# vim /usr/lib/systemd/system/elasticsearch.service
36 LimitMEMLOCK=infinity
[root@base1 elasticsearch]# systemctl daemon-reload
[root@base1 elasticsearch]# systemctl start elasticsearch
[root@base1 elasticsearch]# systemctl status elasticsearch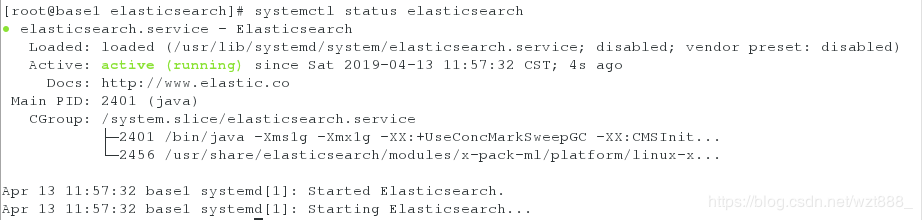
[root@base1 elasticsearch]# netstat -antlp | grep :9200 # 出现端口,说明服务开启成功
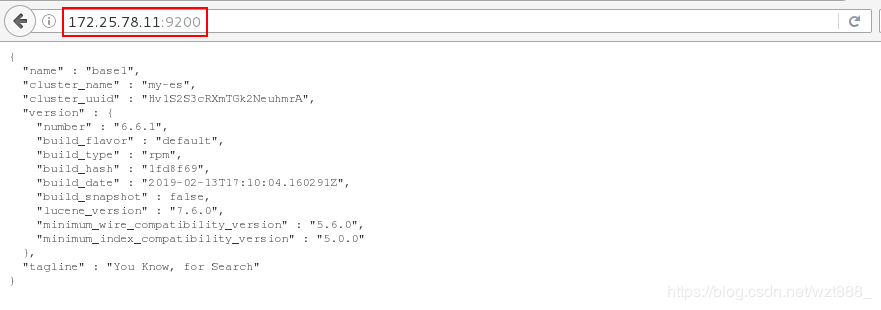
[root@base1 elasticsearch]# curl -s -XGET http://172.25.78.11:9200/_cat/health?v # 查看健康状态,green代表健康
[root@base1 elasticsearch]# curl -s -XGET http://172.25.78.11:9200/_cat/nodes
172.25.78.11 10 95 0 0.00 0.01 0.05 mdi * base1
[root@base1 elasticsearch]# cd
[root@base1 ~]# ls # nodejs是JavaScript 运行环境,因为elashstack是用java语言编写的
nodejs-9.11.2-1nodesource.x86_64.rpm
[root@base1 ~]# rpm -ivh nodejs-9.11.2-1nodesource.x86_64.rpm
[root@base1 ~]# node -v # 查看版本号
v9.11.2
[root@base1 ~]# npm -v
5.6.0
[root@foundation78 ~]# iptables -t nat -I POSTROUTING -s 172.25.78.0/24 -j MASQUERADE # 让虚拟机上网
[root@base1 ~]# route add default gw 172.25.78.250 # 添加临时网关
[root@base1 ~]# route -n # 查看网关
[root@base1 ~]# ping www.baidu.com # 保证可以上网
[root@base1 ~]# yum install -y bzip2
[root@base1 ~]# tar jxf phantomjs-2.1.1-linux-x86_64.tar.bz2
[root@base1 ~]# ls
phantomjs-2.1.1-linux-x86_64
phantomjs-2.1.1-linux-x86_64.tar.bz2
[root@base1 ~]# yum install -y unzip
[root@base1 ~]# unzip elasticsearch-head-master.zip
[root@base1 ~]# cd elasticsearch-head-master
[root@base1 elasticsearch-head-master]# npm install --registry=https://registry.npm.taobao.org
[root@base1 elasticsearch-head-master]# vim _site/app.js
4360 this.base_uri = this.config.base_uri || this.prefs.get("app-base_uri") || "http://172.25.78.11:9200";
[root@base1 elasticsearch-head-master]# npm run start & # 打入后台运行
[root@base1 elasticsearch-head-master]# netstat -antlp |grep :9100
[root@base1 elasticsearch-head-master]# vim /etc/elasticsearch/elasticsearch.yml # 使用head等插件监控集群信息,需要打开以下配置项
61 http.cors.enabled: true
62 http.cors.allow-origin: '*'
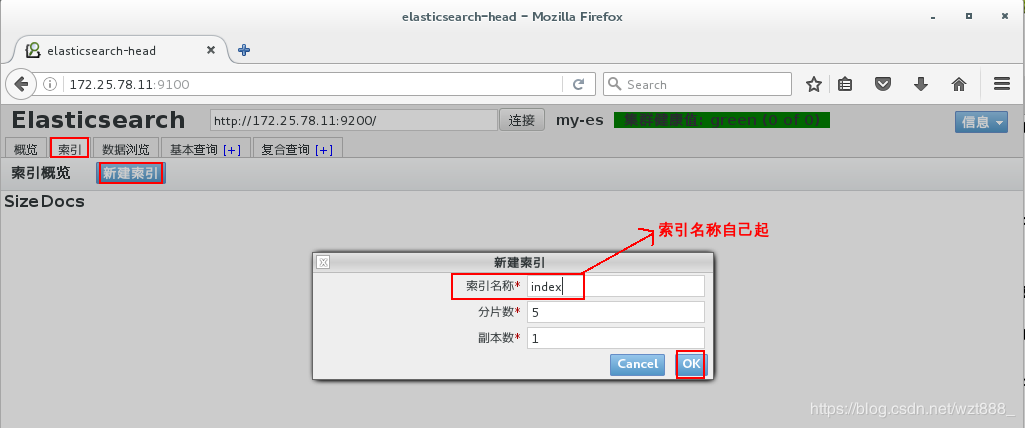
[root@base1 elasticsearch-head-master]# systemctl restart elasticsearch # 重启的过程可能有点慢,请耐心等待

2.开始搭建集群
base1 172.25.78.11 master
base2 172.25.78.12 data节点
base3 172.25.78.13 data节点
[root@base1 ~]# id elasticsearch # 这是master中elasticsearch的id
uid=997(elasticsearch) gid=995(elasticsearch) groups=995(elasticsearch)
[root@base2 ~]# ls
elasticsearch-6.6.1.rpm
jdk-8u181-linux-x64.rpm
[root@base2 ~]# rpm -ivh elasticsearch-6.6.1.rpm
[root@base2 ~]# rpm -ivh elasticsearch-6.6.1.rpm
[root@base2 ~]# id elasticsearch # 集群中的用户必须要保证一致
uid=997(elasticsearch) gid=995(elasticsearch) groups=995(elasticsearch)
[root@base2 ~]# vim /usr/lib/systemd/system/elasticsearch.service
36 LimitMEMLOCK=infinity
[root@base2 ~]# systemctl daemon-reload
[root@base2 ~]# vim /etc/elasticsearch/elasticsearch.yml
17 cluster.name: my-es # 集群名称
23 node.name: base2 # 节点名称
33 path.data: /var/lib/elasticsearch # 数据存放位置
37 path.logs: /var/log/elasticsearch # 日志存放位置
43 bootstrap.memory_lock: true # 锁定内存
55 network.host: 172.25.78.12
59 http.port: 9200 # 网络的监听端口
60
61 http.cors.enabled: true
62 http.cors.allow-origin: '*'
71 discovery.zen.ping.unicast.hosts: ["base1", "base2","base3"] # 设置集群的节点个数
[root@base2 ~]# systemctl start elasticsearch
[root@base3 ~]# ls
elasticsearch-6.6.1.rpm
jdk-8u181-linux-x64.rpm
[root@base3 ~]# rpm -ivh elasticsearch-6.6.1.rpm
[root@base3 ~]# rpm -ivh elasticsearch-6.6.1.rpm
[root@base3 ~]# id elasticsearch
uid=997(elasticsearch) gid=995(elasticsearch) groups=995(elasticsearch)
[root@base3 ~]# vim /usr/lib/systemd/system/elasticsearch.service
36 LimitMEMLOCK=infinity
[root@base3 ~]# systemctl daemon-reload
[root@base3 ~]# vim /etc/elasticsearch/elasticsearch.yml
17 cluster.name: my-es
23 node.name: base3
33 path.data: /var/lib/elasticsearch
37 path.logs: /var/log/elasticsearch
43 bootstrap.memory_lock: true
55 network.host: 172.25.78.13
59 http.port: 9200
60
61 http.cors.enabled: true
62 http.cors.allow-origin: '*'
71 discovery.zen.ping.unicast.hosts: ["base1", "base2","base3"]
[root@base3 ~]# systemctl start elasticsearch
[root@base1 ~]# vim /etc/elasticsearch/elasticsearch.yml
71 discovery.zen.ping.unicast.hosts: ["base1", "base2","base3"]
[root@base1 ~]# systemctl restart elasticsearch
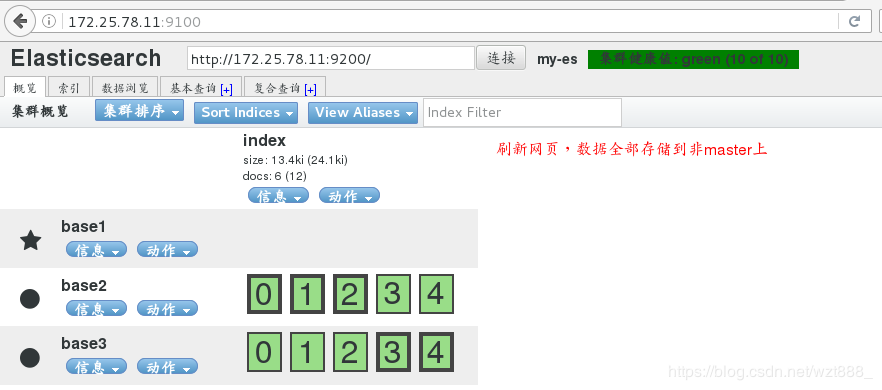
浏览器刷新,因为集群中三个服务器都可以竞选master,也都可以存储数据,所以数据会分布式存储在三台服务器上

[root@base1 ~]# vim /etc/elasticsearch/elasticsearch.yml
25 node.master : true
26 node.data: false # 不做数据节点,即不存储数据
[root@base1 ~]# systemctl restart elasticsearch
[root@base2 ~]# vim /etc/elasticsearch/elasticsearch.yml
24 node.master: false # 不竞选master
25 node.data: true # 只做数据存储
[root@base2 ~]# systemctl restart elasticsearch
[root@base3 ~]# vim /etc/elasticsearch/elasticsearch.yml
24 node.master: false
25 node.data: true
[root@base3 ~]# systemctl restart elasticsearch
3.数据采集(logstash)
base1 172.25.78.11 master
base2 172.25.78.12 data节点,logstash
base3 172.25.78.13 data节点

(1)终端采集数据
[root@base2 ~]# ls
logstash-6.6.1.rpm
[root@base2 ~]# rpm -ivh logstash-6.6.1.rpm
[root@base2 ~]# cd /usr/share/logstash
[root@base2 logstash]# bin/logstash -e 'input { stdin {} } output{ stdout{} }' #调用input模块,stdin 是终端目录,stdout是终端输出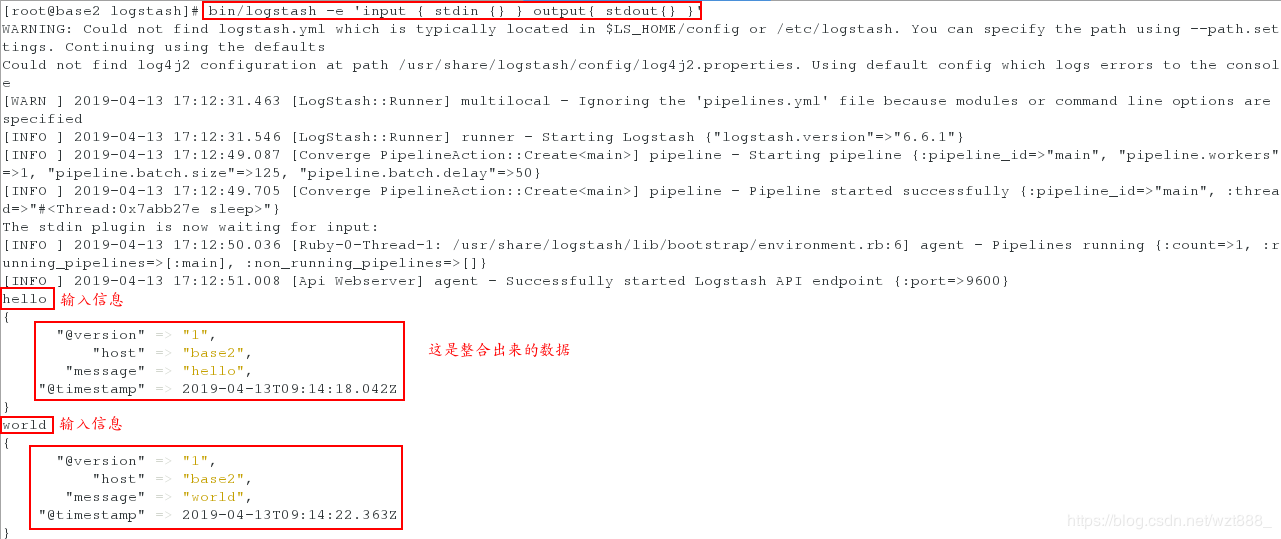
(2)以文件形式采集数据
[root@base2 logstash]# cd /etc/logstash/conf.d/
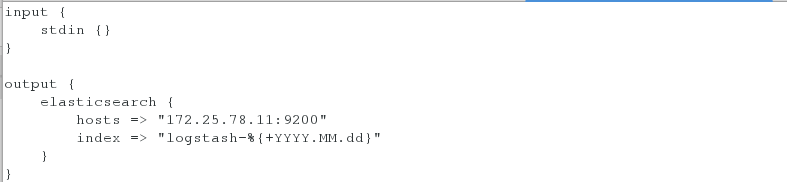
[root@base2 conf.d]# vim ex.conf
input {
stdin {}
}
output {
elasticsearch {
hosts => "172.25.78.11:9200"
index => "logstash-%{+YYYY.MM.dd}" # 索引,唯一
}
}
[root@base2 conf.d]# /usr/share/logstash/bin/logstash -f /etc/logstash/conf.d/ex.conf 
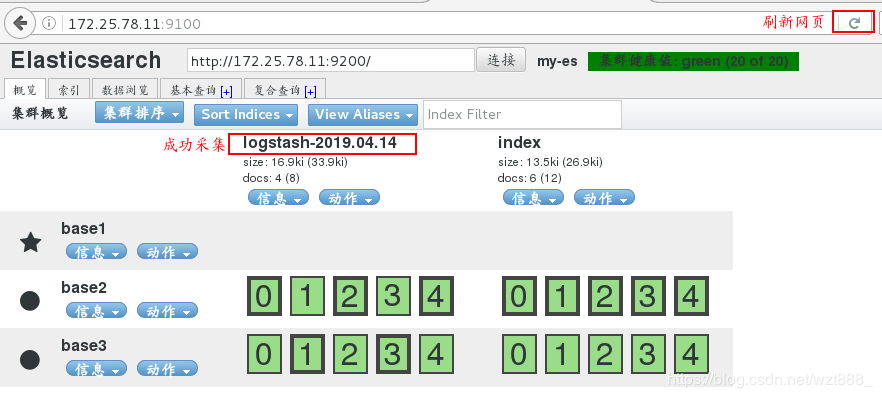
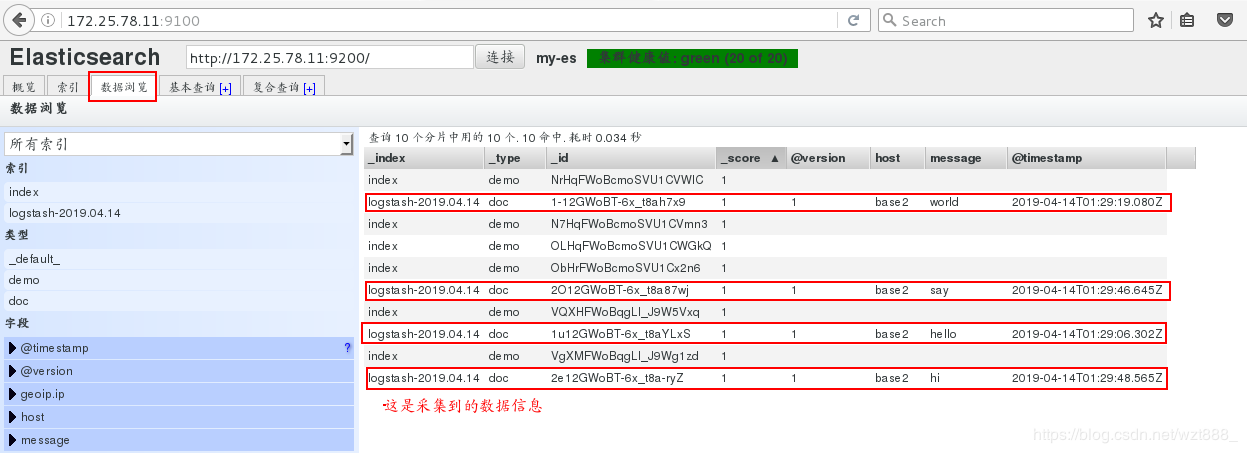
在浏览器查看是否采集到数据
4.文件模块的使用
(1)控制日志的输出格式
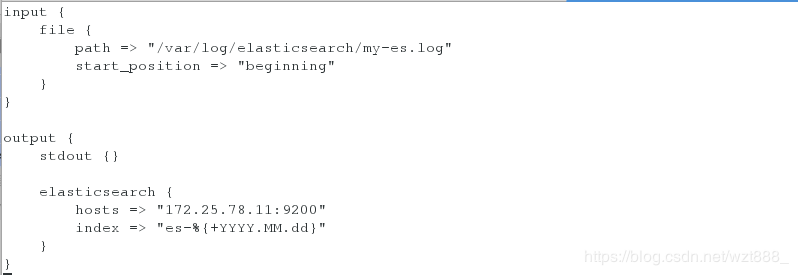
[root@base2 conf.d]# vim ex.conf
input {
file {
path => "/var/log/elasticsearch/my-es.log" # 这是存放日志的文件路径
start_position => "beginning"
}
}
output {
stdout {}
elasticsearch {
hosts => "172.25.78.11:9200"
index => "es-%{+YYYY.MM.dd}"
}
}
[root@base2 conf.d]# /usr/share/logstash/bin/logstash -f /etc/logstash/conf.d/ex.conf
1
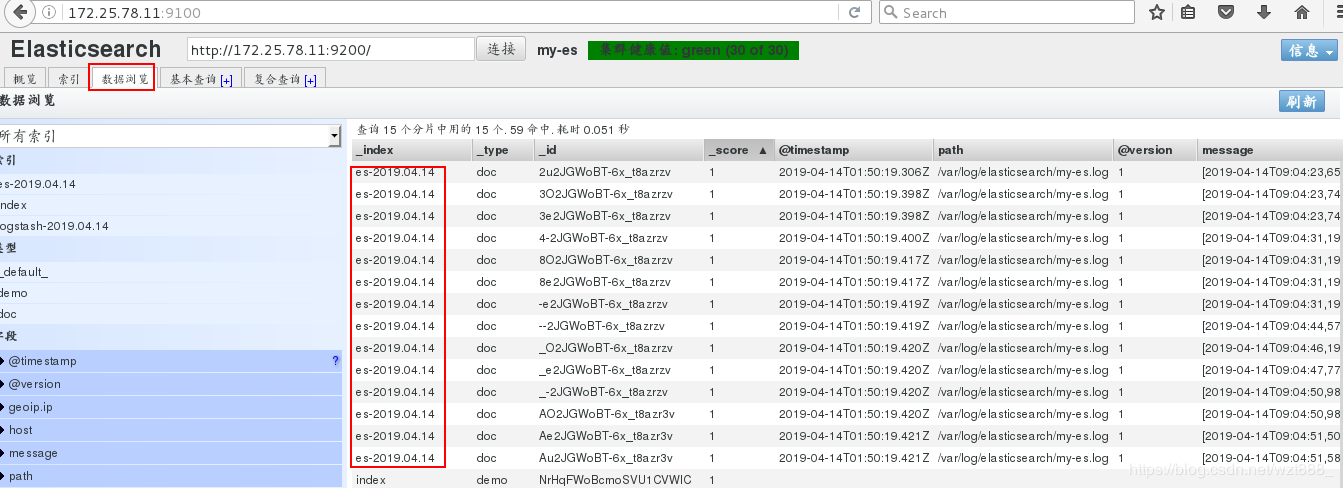
浏览器查看

(2)rsylog日志的数据收集
[root@base2 conf.d]# vim ex.conf
input {
syslog {
port => 514
}
}
output {
stdout {}
elasticsearch {
hosts => "172.25.78.11:9200"
index => "syslog-%{+YYYY.MM.dd}"
}
}
[root@base2 conf.d]# /usr/share/logstash/bin/logstash -f /etc/logstash/conf.d/ex.conf # 不能终止服务
重新打开一个shell
[root@base2 ~]# netstat -antlp | grep :514
[root@base2 ~]# vim /etc/rsyslog.conf
*.* @@172.25.78.12:514
[root@base2 ~]# systemctl restart rsyslog
[root@base2 ~]# netstat -antlp | grep :514
[root@base2 ~]# logger hello
[root@base2 ~]# logger world
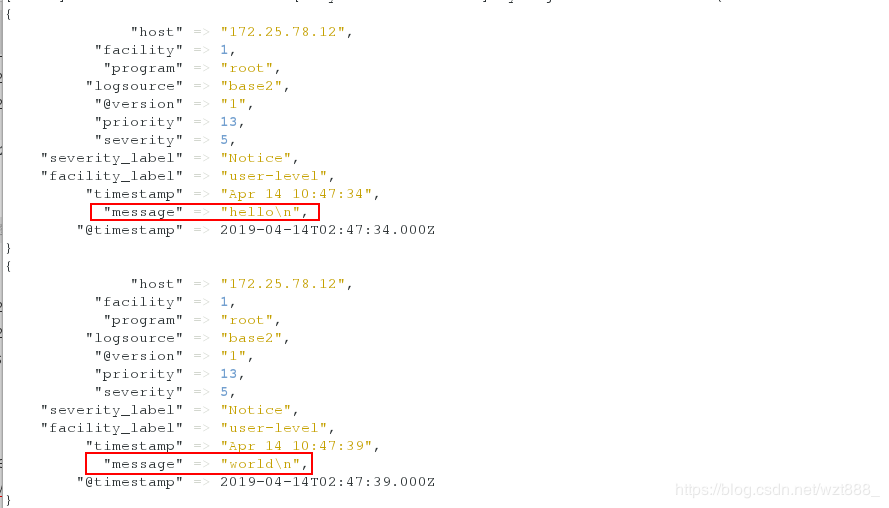
在另外一个shell查看,有数据输出
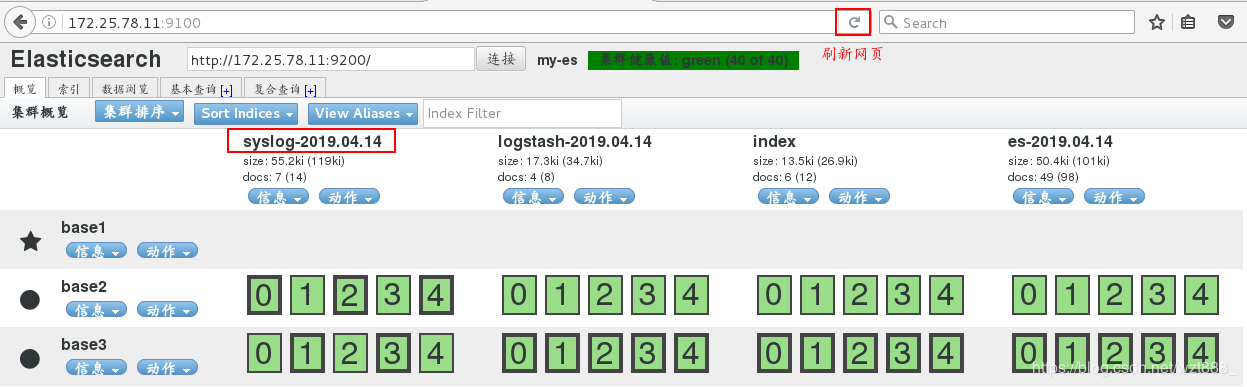
浏览器查看
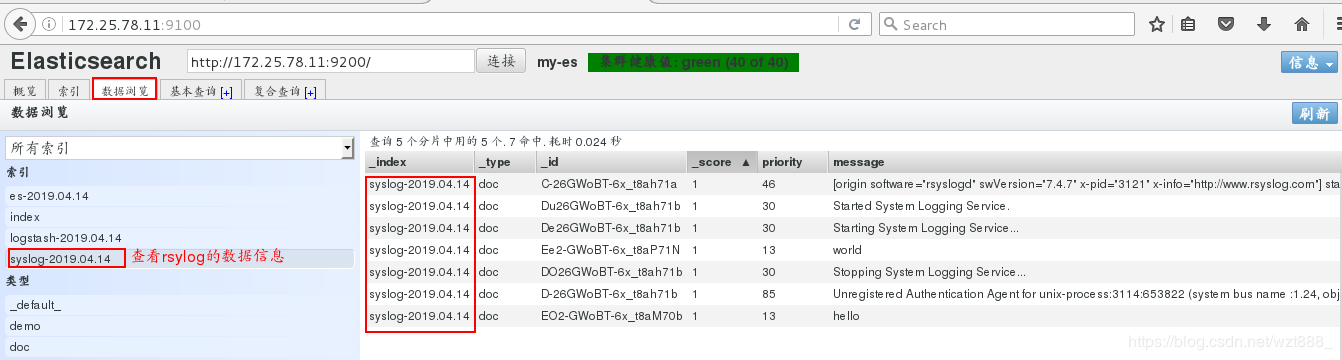
(3)多行整合数据
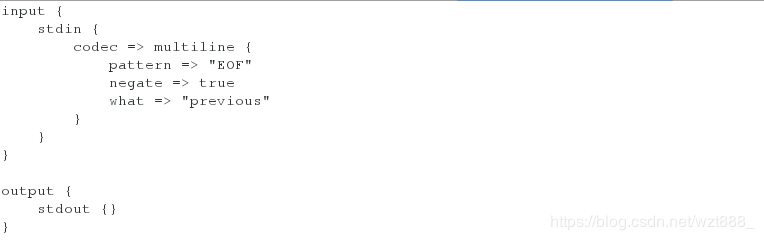
当匹配到EOF关键字时,整合上面所有的数据到一行
[root@base2 conf.d]# vim test.conf
input {
stdin {
codec => multiline {
pattern => "EOF" # 设定匹配字符
negate => true # 当你匹配到设定字符时
what => "previous" # 向前显示信息
}
}
}
output {
stdout {}
}
[root@base2 conf.d]# /usr/share/logstash/bin/logstash -f /etc/logstash/conf.d/test.conf 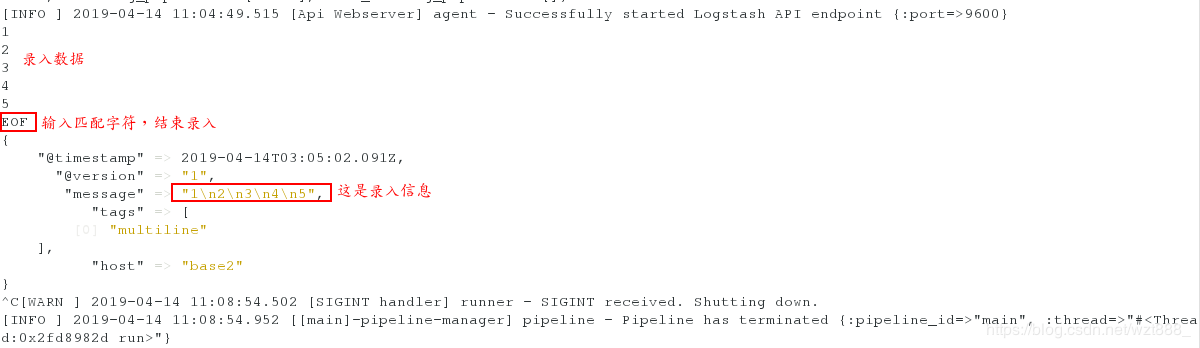
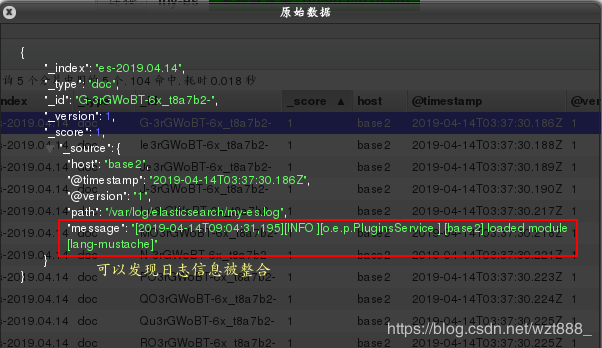
当匹配到文件中的[]时,把之前的数据整合到一行
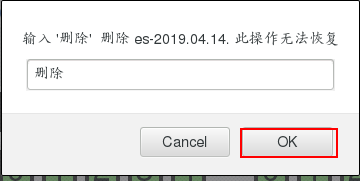
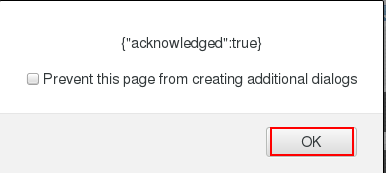
我们就输出到es索引中,但是因为之前es索引被使用过,所以我们要先删除,重新生成索引
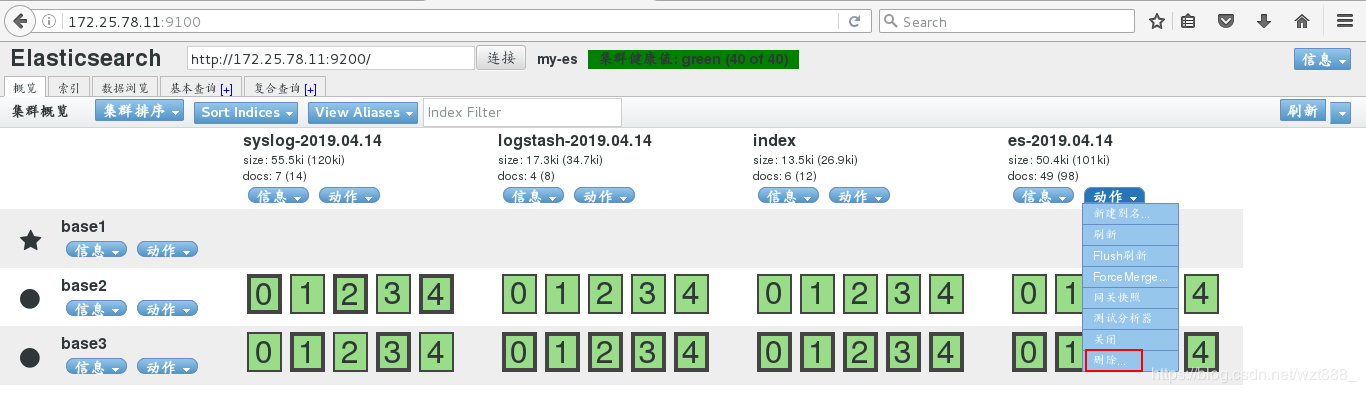
[root@base2 conf.d]# cd /usr/share/logstash/data/plugins/inputs/file/ # 只要索引创建,就会有隐藏文件来记录文件信息
[root@base2 file]# l. # 查看隐藏文件
. .. .sincedb_d5a86a03368aaadc80f9eeaddba3a9f5
[root@base2 file]# rm -fr .sincedb_d5a86a03368aaadc80f9eeaddba3a9f5 # 删除隐藏文件,即删除之前es索引创建的信息
[root@base2 file]# cd /etc/logstash/conf.d
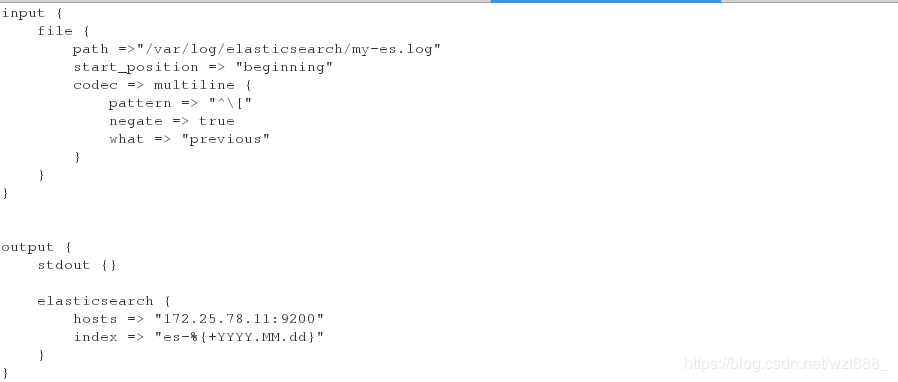
[root@base2 conf.d]# vim ex.conf # 重新编辑文件
input {
file {
path =>"/var/log/elasticsearch/my-es.log"
start_position => "beginning"
codec => multiline {
pattern => "^\["
negate => true
what => "previous"
}
}
}
output {
stdout {}
elasticsearch {
hosts => "172.25.78.11:9200"
index => "es-%{+YYYY.MM.dd}"
}
} 
[root@base2 conf.d]# /usr/share/logstash/bin/logstash -f /etc/logstash/conf.d/ex.conf 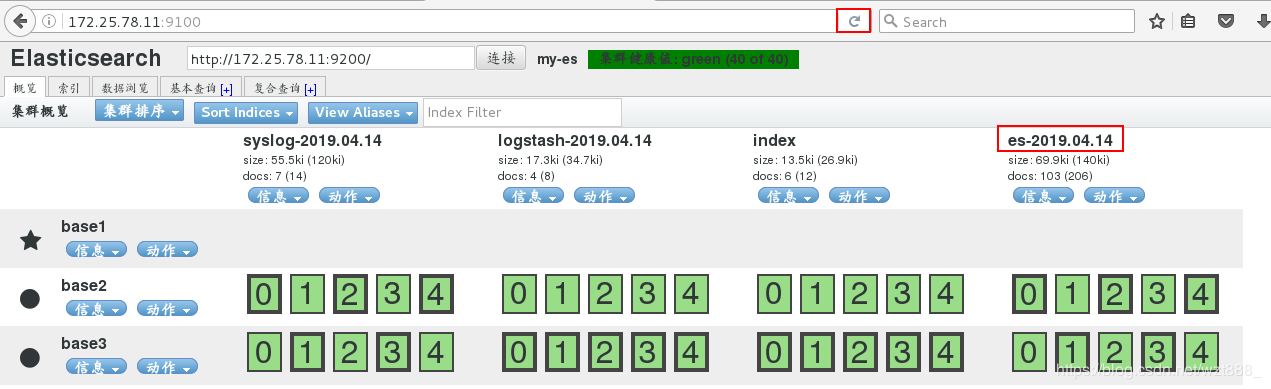

(4)数据格式化
我们先简单的部署以下,在终端看一下效果
[root@base2 conf.d]# vim test.conf
input {
stdin {}
}
filter {
grok {
match => { "message" => "%{IP:client} %{WORD:method} %{URIPATHPARAM:request} %{NUMBER:bytes} %{NUMBER:duration}"}
}
}
output {
stdout {}
} 
[root@base2 conf.d]# /usr/share/logstash/bin/logstash -f /etc/logstash/conf.d/test.conf 
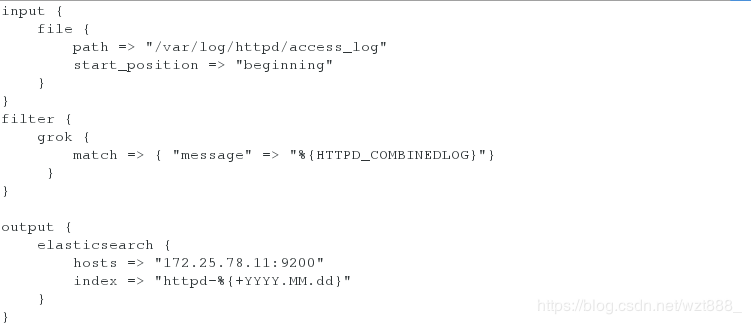
以 httpd为例,格式化httpd的日志
[root@base2 conf.d]# yum install -y httpd
[root@base2 conf.d]# systemctl start httpd
[root@base2 conf.d]# vim /var/www/html/index.html
www.westos.org - httpd
[root@base2 conf.d]# ll /var/log/httpd/access_log
-rw-r--r-- 1 root root 10300 Apr 14 12:51 /var/log/httpd/access_log
[root@base2 conf.d]# ll -d /var/log/httpd/
drwx------ 2 root root 41 Apr 14 12:48 /var/log/httpd/
[root@base2 conf.d]# chmod 755 /var/log/httpd/
[root@base2 conf.d]# ll -d /var/log/httpd/
drwxr-xr-x 2 root root 41 Apr 14 12:48 /var/log/httpd/
[root@base2 conf.d]# vim ex.conf
input {
file {
path => "/var/log/httpd/access_log" # 日志文件路径
start_position => "beginning"
}
}
filter {
grok {
match => { "message" => "%{HTTPD_COMBINEDLOG}"} # 这是httpd日志的输出格式
}
}
output {
elasticsearch {
hosts => "172.25.78.11:9200"
index => "httpd-%{+YYYY.MM.dd}" # 索引名称
}
}
[root@base2 conf.d]# /usr/share/logstash/bin/logstash -f /etc/logstash/conf.d/ex.conf
1
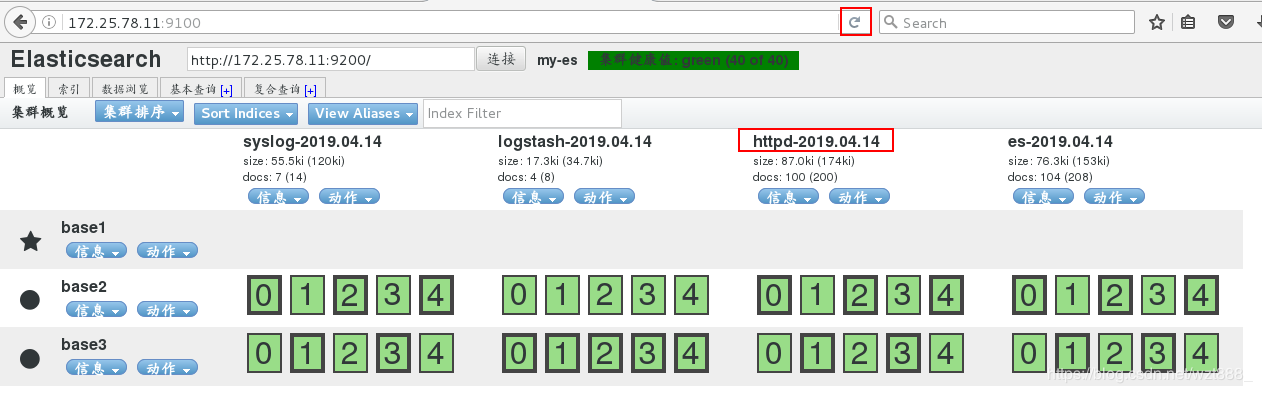
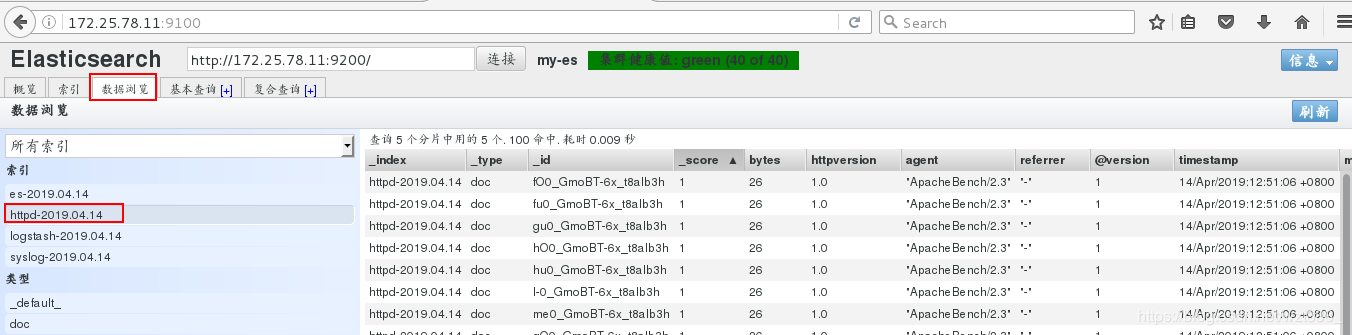
浏览器查看
5.数据可视化
base1 172.25.78.11 master
base2 172.25.78.12 data节点
base3 172.25.78.13 data节点, kibana
[root@base3 ~]# ls
elasticsearch-6.6.1.rpm
jdk-8u181-linux-x64.rpm
kibana-6.6.1-x86_64.rpm
[root@base3 ~]# rpm -ivh kibana-6.6.1-x86_64.rpm
[root@base3 ~]# cd /etc/kibana/
[root@base3 kibana]# ls
kibana.yml
[root@base3 kibana]# vim kibana.yml
2 server.port: 5601
7 server.host: "172.25.78.13"
28 elasticsearch.hosts: ["http://172.25.78.11:9200"]
37 kibana.index: ".kibana"
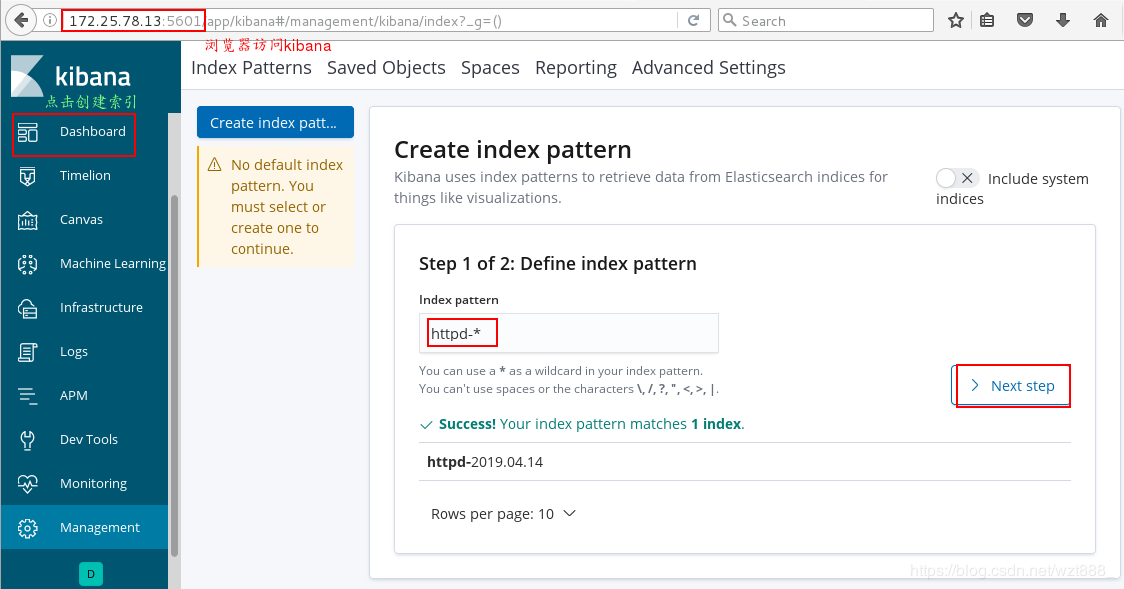
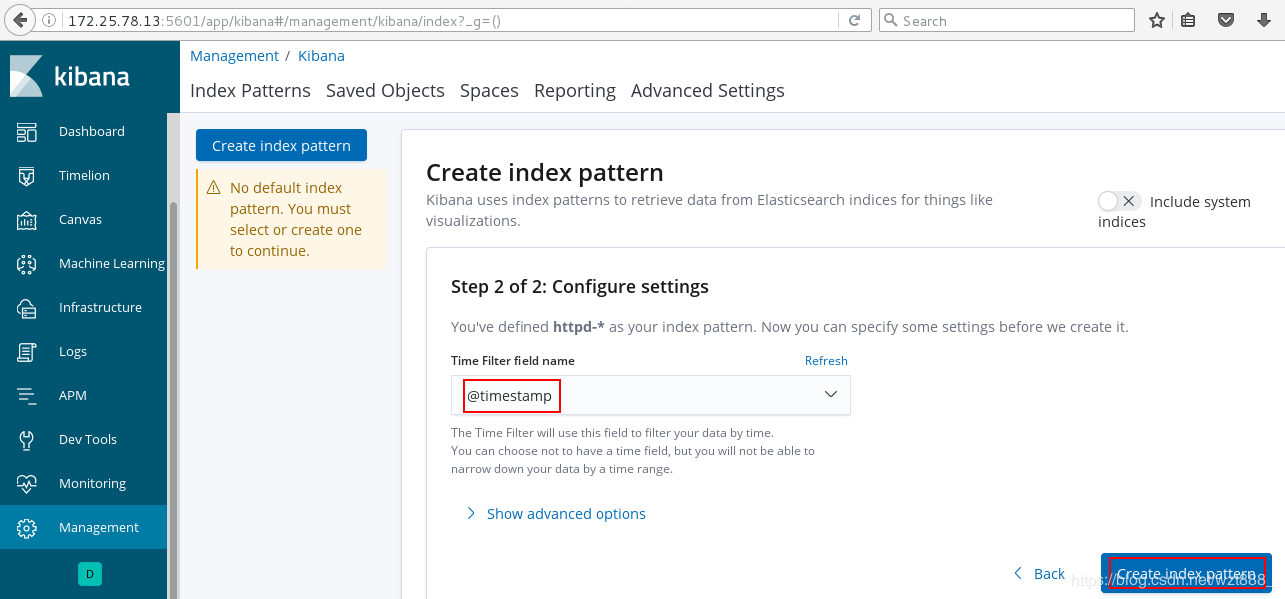
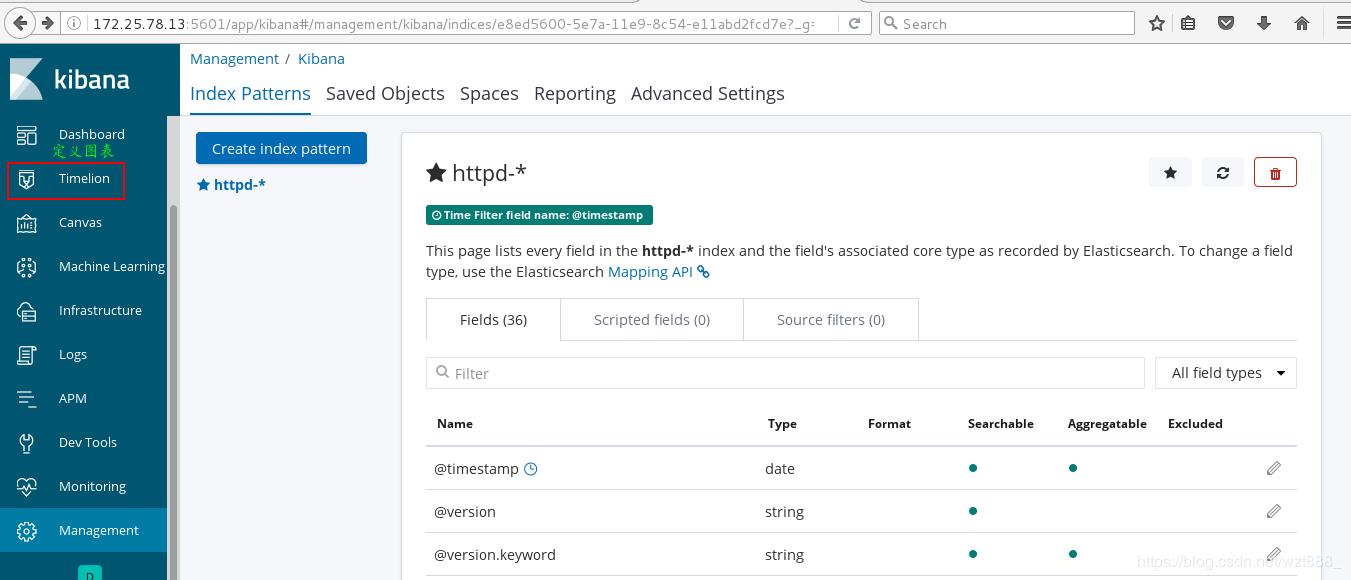
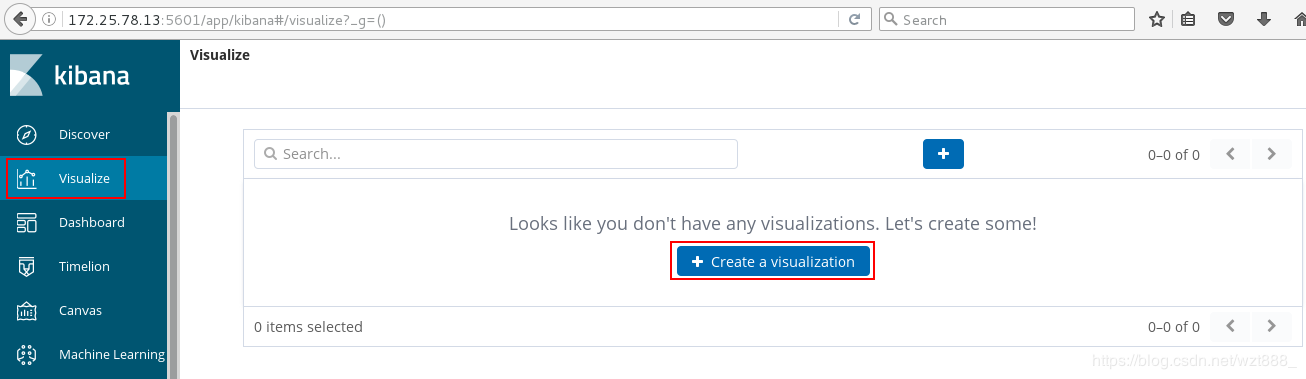
[root@base3 kibana]# netstat -antlp | grep :5601 # 5601是kibana的端口号


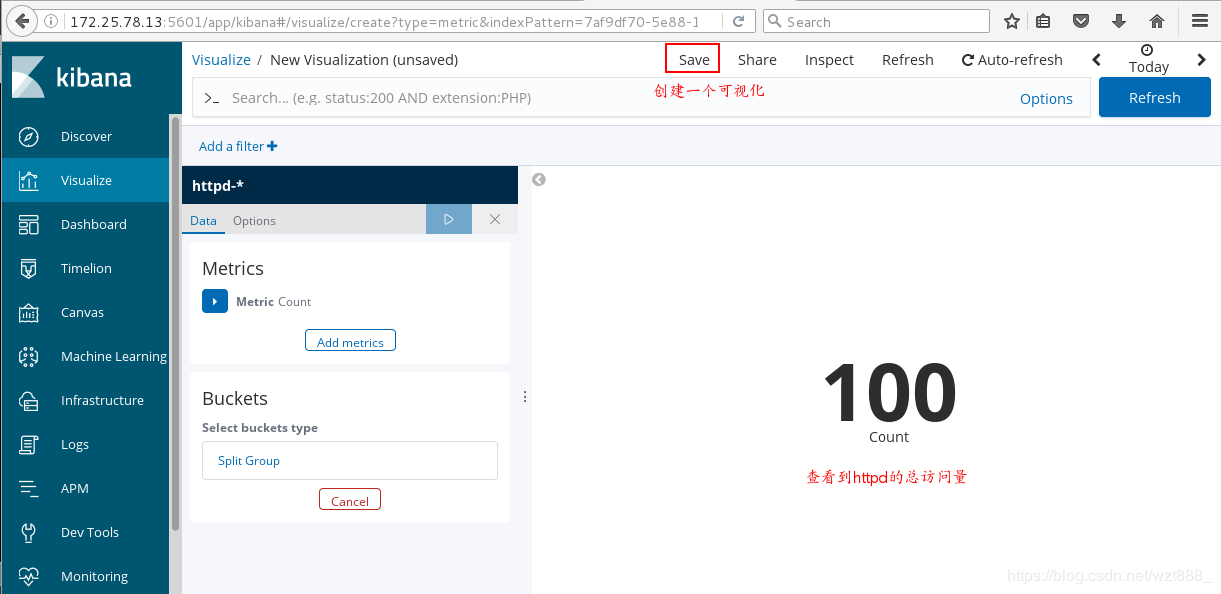
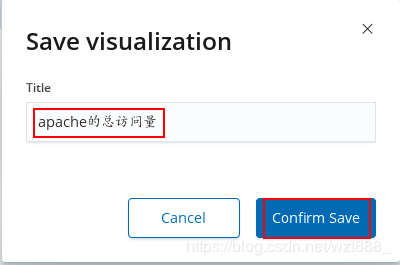
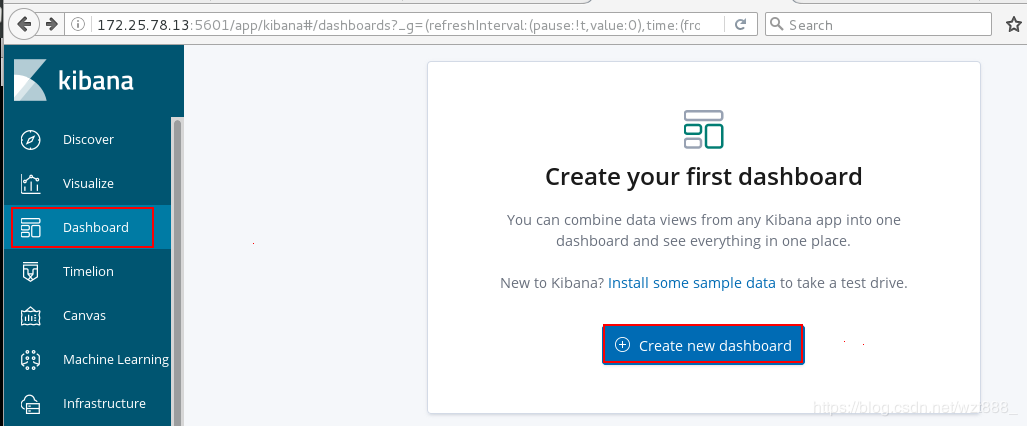

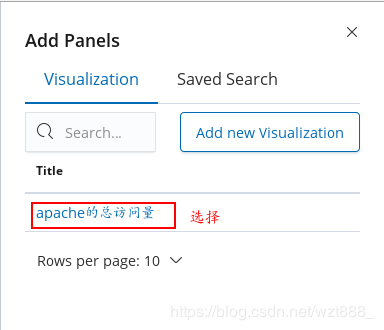
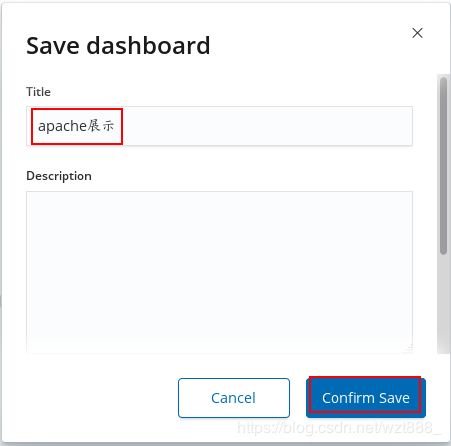
[root@base1 ~]# yum install -y httpd-tools
[root@base1 ~]# ab -c 1 -n 100 http://172.25.78.12/index.html
[root@base3 kibana]# yum install -y httpd-tools
[root@base3 kibana]# ab -c 1 -n 100 http://172.25.78.12/index.html
[root@base2 conf.d]# /usr/share/logstash/bin/logstash -f /etc/logstash/conf.d/ex.conf 


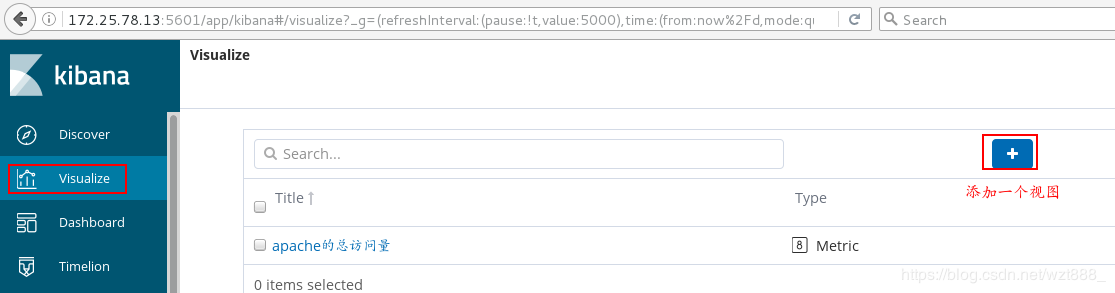
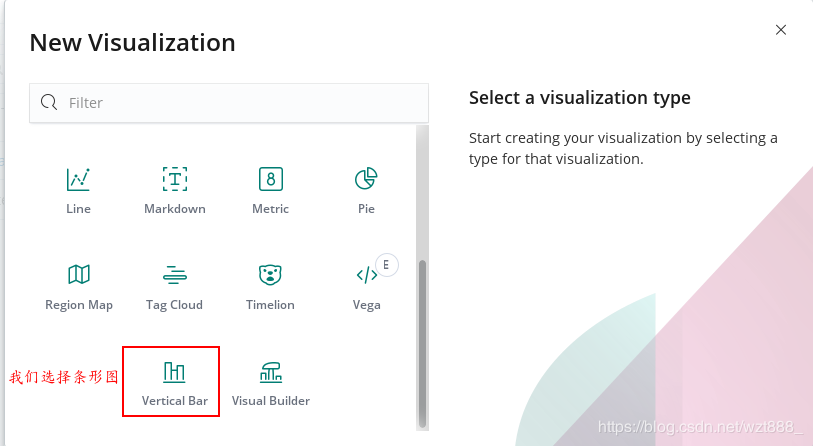
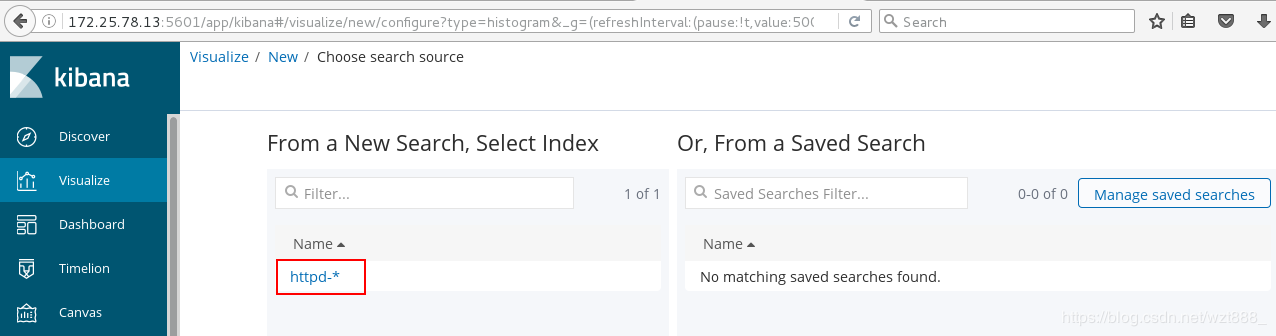
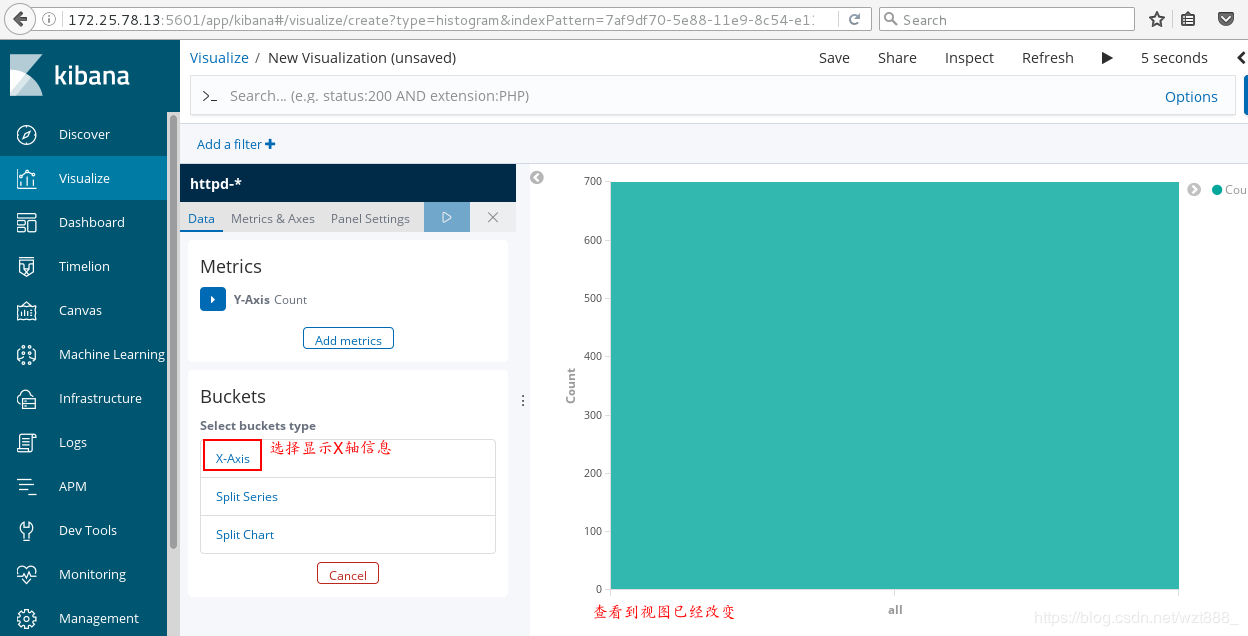
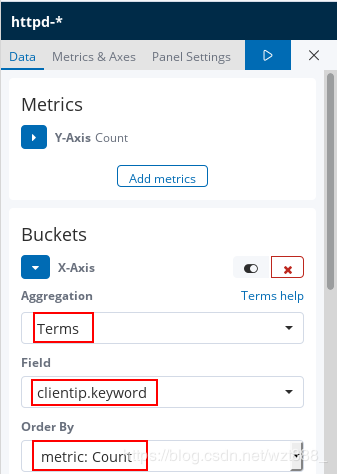
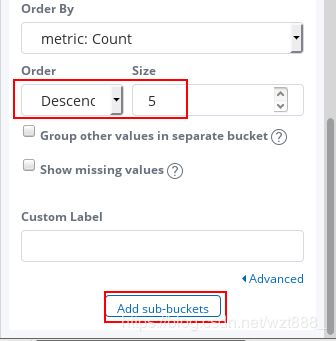
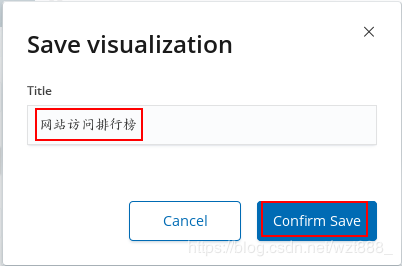
查看具体的访问来源



ELK实时日志分析平台环境部署,以及可视化展示的更多相关文章
- ELK实时日志分析平台环境部署--完整记录
在日常运维工作中,对于系统和业务日志的处理尤为重要.今天,在这里分享一下自己部署的ELK(+Redis)-开源实时日志分析平台的记录过程(仅依据本人的实际操作为例说明,如有误述,敬请指出)~ ==== ...
- ELK实时日志分析平台环境部署--完整记录(转)
在日常运维工作中,对于系统和业务日志的处理尤为重要.今天,在这里分享一下自己部署的ELK(+Redis)-开源实时日志分析平台的记录过程(仅依据本人的实际操作为例说明,如有误述,敬请指出)~ ==== ...
- ELK实时日志分析平台环境部署
为什么要用到ELK一般我们需要进行日志分析场景是:直接在日志文件中 grep.awk 就可以获得自己想要的信息.但在规模较大的场景中,此方法效率低下,面临问题包括日志量太大如何归档.文本搜索太慢怎么办 ...
- ELK实时日志分析平台环境部署--完整记录(ElasticSearch+Logstash+Kibana )
https://blog.csdn.net/oLevin/article/details/81020794
- asp.net core结合NLog搭建ELK实时日志分析平台
0.整体架构 整体架构目录:ASP.NET Core分布式项目实战-目录 一.介绍ELK 1.说明(此篇ELK采用rpm的方式安装在服务器上)-牛刀小试 承接上一篇文章的内容准备部署ELK来展示asp ...
- 手把手教你搭建 ELK 实时日志分析平台
本篇文章主要是手把手教你搭建 ELK 实时日志分析平台,那么,ELK 到底是什么呢? ELK 是三个开源项目的首字母缩写,这三个项目分别是:Elasticsearch.Logstash 和 Kiban ...
- elk实时日志分析平台部署搭建详细实现过程
原文:http://blog.csdn.net/mchdba/article/details/52132663 1.ELK平台介绍 在搜索ELK资料的时候,发现这篇文章比较好,于是摘抄一小段:以下内容 ...
- ELK日志分析平台环境部署 (yum安装)
前言:通常体质被分散存储在不同的设备上面,在庞大的服务器集群中,我们需要集中化的管理,日志的统计和检索,一般我们使用grep和awk,wc等linux命令虽然能够实现检索和统计,但是呢,对于要求更高的 ...
- ELK搭建实时日志分析平台之一ElasticSearch搭建
文:铁乐与猫 系统:CentOS Linux release 7.3.1611 (Core) 注:我这里为测试和实验方便,ELK整套都装在同一台服务器环境中了,生产环境的话,可以分开搭建在不同的服务器 ...
随机推荐
- C# 取得对象属性类型
1.对象 Object obj; 2.对象属性 Type postType = obj.GetType(); PropertyInfo[] postTypeInfos = postType.GetPr ...
- django中navie时间和aware时间详解
navie时间和aware时间: 什么是navie时间?什么是aware时间? navie时间:不知道自己的时间表示的是哪个时区的.也就是不知道自己几斤几两.比较幼稚. aware时间:知道自己的时间 ...
- 新版GRANAFA K8S插件 K8S NODE 图表不显示问题解决方法
原文:https://www.wchao.site/archives/granafa-k8s 其他参考:https://blog.csdn.net/bbwangj/article/details/82 ...
- Mybatis映射器接口代理对象的方式 运行过程
查询一张表的所有数据. 环境: 使用工具IntelliJ IDEA 2018.2版本. 创建Maven工程不用骨架 1.pom.xml <?xml version="1.0" ...
- 使用 HttpWebRequest 类做 POST 请求没有应反
这几天给系统做第三方集成, 需要调用另一个软件的一个接口, 通过 HTTP 的方式调用,调用代码也挺简单的: string serviceUrl = string.Format("{0}/{ ...
- div css字间距
div:nth-child(1){ color: #FFFFFF; font-size: 13px; font-weight: bold; margin-bottom: 25px; letter-sp ...
- 如何实现android和服务器长连接
转载 这种功能实际上就是数据同步,同时要考虑手机本身.电量.网络流量等等限制因素,所以通常在移动端上有一下两个解决方案: 1.一种是定时去server查询数据,通常是使用HTTP协议来访问web服务器 ...
- Solr基础理论【相关度计算】
一.简介 寻找匹配的文档是构建优质搜索体验的关键步骤,但这仅仅是第一步.大多数用户不愿意通过逐页翻阅搜索结果来找到想要的文档.根据一般经验,仅有10%的用户在网页搜索中有意愿继续翻阅第一页以后的搜索结 ...
- Solr基础理论【排名检索、查准率、查全率】
一.排名检索 搜索引擎代表了基于查询,返回优先文档的一种方法.在关系型数据库的SQL查询中,表的一行要么匹配一个查询,要么不匹配,查询结果基于一列或多列排序.搜索引擎根据文档与查询匹配的程度为文档打分 ...
- mybatis update 返回值
mybatis sql: <update id="test" parameterType="map"> update test_0731 set n ...