ZedGraph控件生成饼图、拆线图和柱状图例程
这几天做了个自己觉得还蛮NB的功能,在GRID中选中一块数据,然后右键菜单即可生成三种图形,还可以互相切换,对了,饼图还添加了鼠标点击分离的处理,大致如图:
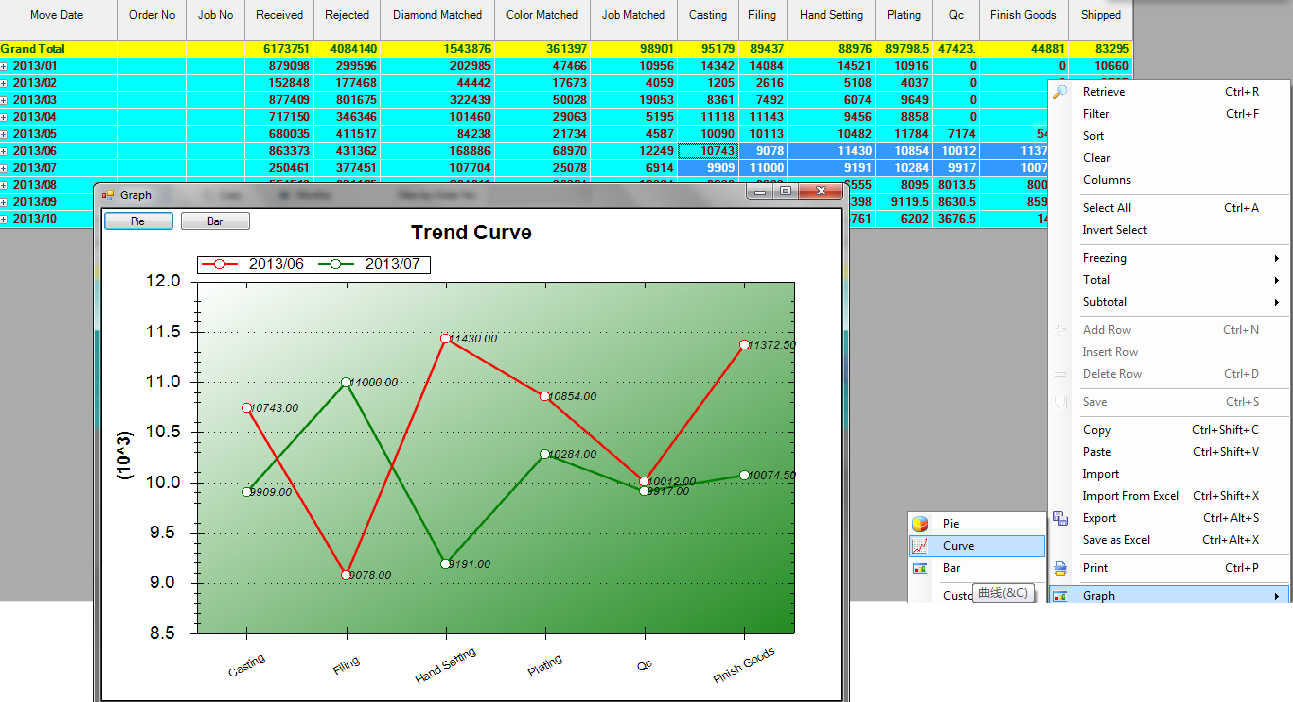
用的控件就是ZedGraph,我把它继承封装了一下,方便调用:
 Imports ZedGraph

 Public Class MyGraph

     '用于切换图型的

     Private dtSource As DataTable

     Private Function MyGraph_MouseDownEvent(ByVal sender As ZedGraph.ZedGraphControl, ByVal e As System.Windows.Forms.MouseEventArgs) As System.Boolean Handles MyBase.MouseDownEvent

         If e.Button = Windows.Forms.MouseButtons.Left Then

             Dim pane As GraphPane = sender.GraphPane

             Dim pt As New PointF(e.X, e.Y)

             Dim curve As CurveItem = Nothing

             Dim i%

             If pane.FindNearestPoint(pt, curve, i) Then

                 If curve.IsPie Then

                     Dim pi As PieItem = CType(curve, PieItem)

                     If pi.Displacement >  Then

                         pi.Displacement =

                     Else

                         pi.Displacement = 0.3

                     End If

                     sender.Refresh()

                 End If

             End If

         End If

         Return True

     End Function

     Public Sub SetTitle(ByVal title As String)

         '' Set the pane title

         GraphPane.Title.Text = title

     End Sub

     Public Sub SetPieDataB(ByVal dt As DataTable, ByVal title As String)

         '为多列一行的数据,按列分块,不支持切换,不推荐使用

         Dim ds As New DataSet

         Dim i, j As Integer

         Dim cc, rc As Integer

         rc = dt.Rows.Count

         cc = dt.Columns.Count

         If rc =  Or cc =  Then Return

         GraphPane.CurveList.Clear()

         GraphPane.GraphObjList.Clear()

         GraphPane.Legend.IsVisible = True

         GraphPane.Legend.Position = LegendPos.Right

         GraphPane.Legend.FontSpec.Size =

         If String.IsNullOrEmpty(title) = False Then

             GraphPane.Title.Text = title

         End If

         Dim labels(cc - ) As String

         Dim values(cc - ) As Double

         For i =  To cc -

             labels(i) = dt.Columns(i).ColumnName

             values(i) = dt.Rows().Item(i)

         Next

         'Dim colors() As Color = {Color.Red, Color.Blue, Color.Green, Color.Yellow, Color.Purple, Color.Brown, Color.Coral, Color.ForestGreen}

         Dim slices() As PieItem = GraphPane.AddPieSlices(values, labels)

         GraphPane.Fill = New Fill(Color.Cornsilk)

         GraphPane.Chart.Fill = New Fill(Color.Cornsilk)

         'GraphPane.Fill = New Fill(Color.White, Color.Goldenrod, 45.0F)

         For i =  To cc -

             slices(i).LabelType = PieLabelType.Name_Value_Percent

         Next

         GraphPane.AxisChange()

         Refresh()

         dtSource = Nothing

         FlowLayoutPanel1.Controls.Clear()

     End Sub

     Public Sub SetPieData(ByVal dt As DataTable, ByVal title As String)

         'TABLE内容应为第一列为各块名称,第二列为各块的值,不能只有一列

         Dim ds As New DataSet

         Dim i, j As Integer

         Dim cc, rc As Integer

         rc = dt.Rows.Count

         cc = dt.Columns.Count

         If rc =  Or cc <=  Then Return

         GraphPane.CurveList.Clear()

         GraphPane.GraphObjList.Clear()

         GraphPane.Legend.IsVisible = True

         GraphPane.Legend.Position = LegendPos.Right

         GraphPane.Legend.FontSpec.Size =

         If String.IsNullOrEmpty(title) = False Then

             GraphPane.Title.Text = title

         End If

         Dim labels(rc - ) As String

         Dim values(rc - ) As Double

         For j =  To cc -

             For i =  To rc -

                 labels(i) = dt.Rows(i).Item()

                 values(i) = dt.Rows(i).Item(j)

             Next

             'Dim colors() As Color = {Color.Red, Color.Blue, Color.Green, Color.Yellow, Color.Purple, Color.Brown, Color.Coral, Color.ForestGreen}

             Dim slices() As PieItem = GraphPane.AddPieSlices(values, labels)

             GraphPane.Fill = New Fill(Color.Cornsilk)

             GraphPane.Chart.Fill = New Fill(Color.Cornsilk)

             'GraphPane.Fill = New Fill(Color.White, Color.Goldenrod, 45.0F)

             For i =  To rc -

                 slices(i).LabelType = PieLabelType.Name_Value_Percent

             Next

         Next

         GraphPane.AxisChange()

         Refresh()

         dtSource = dt

         FlowLayoutPanel1.Controls.Clear()

         AddButton("Curve", AddressOf btnCurve_Click)

         AddButton("Bar", AddressOf btnBar_Click)

     End Sub

     Public Sub SetPieData(ByVal dt As DataTable)

         SetPieData(dt, "")

     End Sub

     Public Sub SetCurveData(ByVal dt As DataTable)

         SetCurveData(dt, "", "", "")

     End Sub

     Public Sub SetCurveData(ByVal dt As DataTable, ByVal title As String)

         SetCurveData(dt, title, "", "")

     End Sub

     Public Sub SetCurveData(ByVal dt As DataTable, ByVal title As String, ByVal xAxisTitle As String, ByVal yAxisTitle As String)

         'TABLE内容应为第一列为X轴值,第二列开始为Y轴数值,除非只有一列

         If dt Is Nothing Then Return

         Dim cc As Integer = dt.Columns.Count

         Dim rc As Integer = dt.Rows.Count

         If rc =  Or cc =  Then Return

         GraphPane.CurveList.Clear()

         GraphPane.GraphObjList.Clear()

         If String.IsNullOrEmpty(title) = False Then

             GraphPane.Title.Text = title

         End If

         If String.IsNullOrEmpty(xAxisTitle) Then

             GraphPane.XAxis.Title.Text = xAxisTitle

         End If

         If String.IsNullOrEmpty(yAxisTitle) Then

             GraphPane.YAxis.Title.Text = yAxisTitle

         End If

         GraphPane.Legend.IsVisible = cc >

         GraphPane.Legend.Position = LegendPos.Top

         Dim values(rc - ) As Double

         Dim labels(rc - ) As String

         Dim i%, j%, k%, b%

         Dim alone As Boolean = cc =

         '只有一列的情况下,X轴为序号

         For i =  To rc -

             If alone Then

                 labels(i) = i +

             Else

                 labels(i) = dt.Rows(i).Item()

             End If

         Next

         Dim colors() As Color = {Color.Red, Color.Green, Color.Blue, Color.Orange, Color.Purple, Color.Pink}

         Dim curve As LineItem

         b = IIf(alone, , )

         For j = b To dt.Columns.Count -

             For i =  To dt.Rows.Count -

                 values(i) = dt.Rows(i).Item(j)

             Next

             k = j - b

             If k >= colors.Length Then

                 k = j - b - colors.Length

             End If

             curve = GraphPane.AddCurve(dt.Columns(j).ColumnName, Nothing, values, colors(k), SymbolType.Circle)

             curve.Line.Width = 2.5

             curve.Line.IsAntiAlias = True

             curve.Symbol.Fill = New Fill(Color.White)

             curve.Symbol.Size =

             For i =  To curve.Points.Count -

                 Dim pt As PointPair = curve.Points(i)

                 Dim text As New TextObj(pt.Y.ToString("f2"), pt.X, pt.Y + GraphPane.YAxis.Scale.Max * 0.02, CoordType.AxisXYScale, AlignH.Left, AlignV.Center)

                 text.ZOrder = ZOrder.A_InFront

                 text.FontSpec.Size =

                 text.FontSpec.Border.IsVisible = False

                 text.FontSpec.Fill.IsVisible = False

                 'text.FontSpec.Fill = new Fill( Color.FromArgb( 100, Color.White ) )

                 text.FontSpec.IsItalic = True

                 'text.FontSpec.Angle = 30  '字体倾斜度

                 GraphPane.GraphObjList.Add(text)

             Next

         Next

         GraphPane.Chart.Fill = New Fill(Color.White, Color.FromArgb(, Color.ForestGreen), .0F)

         GraphPane.XAxis.Scale.TextLabels = labels

         GraphPane.XAxis.Type = AxisType.Text

         GraphPane.XAxis.Scale.FontSpec.Size =

         If labels.Length >  And labels().Length >  Then

             GraphPane.XAxis.Scale.FontSpec.Angle =

         End If

         GraphPane.XAxis.IsVisible = True

         GraphPane.YAxis.IsVisible = True

         GraphPane.YAxis.MajorGrid.IsVisible = True

         GraphPane.AxisChange()

         Refresh()

         dtSource = dt

         FlowLayoutPanel1.Controls.Clear()

         AddButton("Pie", AddressOf btnPie_Click)

         AddButton("Bar", AddressOf btnBar_Click)

     End Sub

     Public Sub SetBarData(ByVal dt As DataTable)

         SetBarData(dt, Nothing, Nothing, Nothing)

     End Sub

     Public Sub SetBarData(ByVal dt As DataTable, ByVal title As String)

         SetBarData(dt, title, Nothing, Nothing)

     End Sub

     Public Sub SetBarData(ByVal dt As DataTable, ByVal title As String, ByVal xAxisTitle As String, ByVal yAxisTitle As String)

         'TABLE内容应为第一列为X轴值,第二列开始为Y轴数值,除非只有一列

         Dim cc As Integer = dt.Columns.Count

         Dim rc As Integer = dt.Rows.Count

         If cc =  Or rc =  Then Return

         Dim x(rc - ) As Double

         Dim values(rc - ) As Double

         Dim labels(rc - ) As String

         GraphPane.CurveList.Clear()

         GraphPane.GraphObjList.Clear()

         If String.IsNullOrEmpty(title) = False Then

             GraphPane.Title.Text = title

         End If

         If String.IsNullOrEmpty(xAxisTitle) Then

             GraphPane.XAxis.Title.Text = xAxisTitle

         End If

         If String.IsNullOrEmpty(yAxisTitle) Then

             GraphPane.YAxis.Title.Text = yAxisTitle

         End If

         GraphPane.Legend.IsVisible = cc >

         GraphPane.Legend.Position = LegendPos.Top

         Dim i%, j%, k%, b%

         Dim alone As Boolean = cc =

         Dim bi As BarItem

         '只有一列的情况下,X轴为序号

         For i =  To rc -

             If alone Then

                 labels(i) = i +

             Else

                 labels(i) = dt.Rows(i).Item()

             End If

         Next

         If alone Then

             For i =  To rc -

                 x(i) = i +

                 values(i) = dt.Rows(i).Item()

             Next

             bi = GraphPane.AddBar(dt.Columns().ColumnName, x, values, Color.Blue)

             bi.Bar.Fill = New Fill(Color.Blue, Color.White, Color.Green)

         Else

             Dim colors() As Color = {Color.Red, Color.Green, Color.Blue, Color.Orange, Color.Purple, Color.Pink}

             For j =  To dt.Columns.Count -

                 For i =  To rc -

                     values(i) = dt.Rows(i).Item(j)

                 Next

                 k = j -

                 If k >= colors.Length Then

                     k = j -  - colors.Length

                 End If

                 bi = GraphPane.AddBar(dt.Columns(j).ColumnName, Nothing, values, colors(k))

                 bi.Bar.Fill = New Fill(colors(k), Color.White, colors(k))

             Next

             For i =  To bi.Points.Count -

                 Dim pt As PointPair = bi.Points(i)

                 Dim text As New TextObj(pt.Y.ToString("f2"), pt.X, pt.Y + GraphPane.YAxis.Scale.Max * 0.02, CoordType.AxisXYScale, AlignH.Left, AlignV.Center)

                 text.ZOrder = ZOrder.A_InFront

                 text.FontSpec.Size =

                 text.FontSpec.Border.IsVisible = False

                 text.FontSpec.Fill.IsVisible = False

                 text.FontSpec.IsItalic = True

                 GraphPane.GraphObjList.Add(text)

             Next

         End If

         GraphPane.Chart.Fill = New Fill(Color.White, Color.FromArgb(, Color.ForestGreen), .0F)

         'GraphPane.XAxis.Scale.TextLabels = labels

         GraphPane.XAxis.Type = AxisType.Text

         GraphPane.XAxis.Scale.FontSpec.Size =

         If labels.Length >  And labels().Length >  Then

             GraphPane.XAxis.Scale.FontSpec.Angle =

         End If

         GraphPane.XAxis.IsVisible = True

         GraphPane.YAxis.IsVisible = True

         GraphPane.YAxis.MajorGrid.IsVisible = True

         GraphPane.AxisChange()

         Refresh()

         dtSource = dt

         FlowLayoutPanel1.Controls.Clear()

         AddButton("Pie", AddressOf btnPie_Click)

         AddButton("Curve", AddressOf btnCurve_Click)

     End Sub

     Private Sub AddButton(ByVal text As String, ByVal clickEvent As EventHandler)

         Dim btn As New Button

         btn.Text = text

         AddHandler btn.Click, clickEvent

         FlowLayoutPanel1.Controls.Add(btn)

     End Sub

     Private Sub btnPie_Click(ByVal sender As Object, ByVal e As System.EventArgs)

         If dtSource Is Nothing Then Return

         SetPieData(dtSource, CType(sender, Button).Text)

     End Sub

     Private Sub btnCurve_Click(ByVal sender As Object, ByVal e As System.EventArgs)

         If dtSource Is Nothing Then Return

         SetCurveData(dtSource, CType(sender, Button).Text)

     End Sub

     Private Sub btnBar_Click(ByVal sender As Object, ByVal e As System.EventArgs)

         If dtSource Is Nothing Then Return

         SetBarData(dtSource, CType(sender, Button).Text)

     End Sub

     Private Sub FinexGraph_Resize(ByVal sender As System.Object, ByVal e As System.EventArgs) Handles MyBase.Resize

         GraphPane.AxisChange()

         Refresh()

     End Sub

 End Class
注意,我拖了个FlowLayoutPanel1放在控件最上面,放切换图型按钮的
调用方法很简单,把它拖到FORM上,然后准备好数据源(datatable),完了调用控件的setxxxdata()方法即可,当然我这里是在GRID的菜单点击后弹出个窗口来显示的
ZedGraph控件生成饼图、拆线图和柱状图例程的更多相关文章
- ZedGraph控件的使用 --归类(转帖)
在我们编写程序的时候,有时候是要做一些统计的,为了达到一目了然的效果,饼状图,曲线图,柱状图都是很好的表现统计的直观形式.这个时候,ZedGraph控件给我们带来了极大的方便. 1.下载ZedGrap ...
- ZedGraph控件的使用
http://blog.chinaunix.net/uid-20776117-id-1847015.html 在我们编写程序的时候,有时候是要做一些统计的,为了达到一目了然的效果,饼状图,曲线图,柱状 ...
- 用ZedGraph控件作图圆
转自原文 用ZedGraph控件作图圆 用ZedGraph控件绘制圆各位: 我想利用第三方控ZedGraph在WinForm窗体中绘制图形如,圆,填充圆,只是简单的圆图形,但一直没有找到相应的方 ...
- Windows高DPI系列控件(一) - 饼图
目录 一.醉一醉 二.效果展示 三.高DPI适配 1.高DPI框架运作 2.适配高DPI 3.适配饼图 四.相关文章 原文链接:Windos高DPI系列控件(一) - 饼图 一.醉一醉 眨眼功夫,20 ...
- c# 通过.net自带的chart控件绘制饼图pie chart
c# 通过.net自带的chart控件绘制饼图pie chart 需要实现的目标是: 1.将数据绑定到pie的后台数据中,自动生成饼图. 2.生成的饼图有详细文字的说明. 具体的实现步骤: > ...
- 双缓冲绘图和窗口控件的绘制——ATL ActiveX 窗口控件生成向导绘制代码OnDraw的一个错误 .
双缓冲绘图和窗口控件的绘制 ---ATL ActiveX 窗口控件生成向导绘制代码OnDraw的一个错误 cheungmine 我们通常使用ATL COM组件,生成一个带窗口的ActiveX控件,然后 ...
- zedgraph控件的一些比较有用的属性 转
(1)zedgraph控件属性具体解释: AxisChange()() ->> This performs an axis change command on the graphPane. ...
- zedgraph控件怎么取得鼠标位置的坐标值(转帖)
我想取得zedgraph控件上任意鼠标位置的坐标值,IsShowCursorValues可以显示鼠标位置的值但是不能提取赋值给其他的变量.用PointValueEvent这个事件又只能得到已经画出的点 ...
- zedgraph控件的一些比较有用的属性
(1)zedgraph控件属性具体解释: AxisChange()() ->> This performs an axis change command on the graphPane. ...
随机推荐
- loadView是干什么用的
文/natewang(简书作者)原文链接:http://www.jianshu.com/p/f8d261d49615著作权归作者所有,转载请联系作者获得授权,并标注“简书作者”. viewContro ...
- pl sql developer登陆界面找不到oracle数据库选项
window 64位的操作系统 装的数据库win64_11gR2的数据库,PL SQL是PLSQL Developer 7.1.5最后是下载了一个instantclient_11_2包将你数据库安装路 ...
- ios中键值编码kvc和键值监听kvo的特性及详解
总结: kvc键值编码 1.就是在oc中可以对属性进行动态读写(以往都是自己赋值属性) 2. 如果方法属性的关键字和需要数据中的关键字相同的话 ...
- Deme_遥感控制物体移动(涉及遮罩,小摄像机跟随)
using UnityEngine; using System.Collections; using UnityEngine.EventSystems; public class JoyControl ...
- 完整的站内搜索Demo(Lucene.Net+盘古分词)
前言 首先自问自答几个问题,以让各位看官了解写此文的目的 什么是站内搜索?与一般搜索的区别? 很多网站都有搜索功能,很多都是用SQL语句的Like实现的,但是Like无法做到模糊匹配(例如我搜索“.n ...
- linux 屏幕亮度调整命令
我的Fujitsu S7211的笔记本屏幕显示在Ubuntu 10.04不如在Vista下明亮,一直以为是驱动的问题.后来从老外的博客中,发现了这个亮度其实可以调节. 2种方法: 1. 调节屏幕对比度 ...
- GDB调试技巧
1. 查看内存分布 (gdb) info proc mappings 2. 对于类的调试,先通过行号来设断点, 比如:(gdb) b TcpConnection.cc:63 3. 打印数组的内容 (g ...
- Java基础知识强化之集合框架笔记09:Collection集合迭代器使用的问题探讨
1.Collection集合迭代器使用的问题探讨: (1)问题1:能用while循环写这个程序,我能不能用for循环呢? 可以使用for循环替代. (2)问题2:不要 ...
- Java基础知识强化之IO流笔记20:FileOutputStream写出数据实现换行和追加写入
1. 如何实现数据的换行? (1) package com.himi.fileoutputstream; import java.io.FileNotFoundException; import j ...
- Android滚动截屏,ScrollView截屏
在做分享功能的时候,需要截取全屏内容,一屏展示不完的内容,一般我们会用到 ListView 或 ScrollView 一: 普通截屏的实现 获取当前Window 的 DrawingCache 的方式, ...