
Replacing JNI Crashes by Exceptions on Android
http://blog.httrack.com/blog/2013/08/23/catching-posix-signals-on-android/
To Report Or Not To Report
You have a nice application available on the Google Android Store and, as a developer, you have access to nice features giving you basic statistics (the number of downloads, Android version breakdown, etc.), reviews, and a Crashes & ANRs section allowing to audit user crash reports (and Application hangs – that’s the ANR thing).
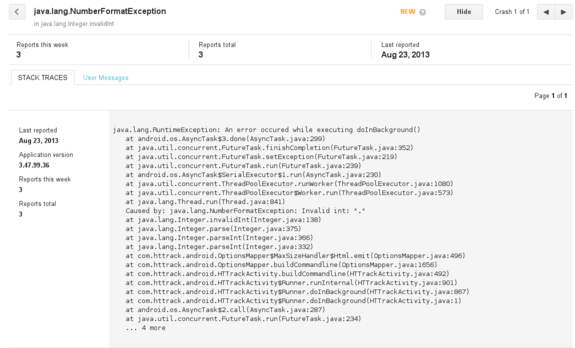
This is a rather basic feature (you do not have any details on the user’s phone, Android version, etc. – only a Java stack trace extract), but at least it allows you to quickly spot mistakes (such as NullPointerException, or in this case, a NumberFormatException), and the report is pretty straightforward for users (they only have click on the “Report” button in case of crash)
But what if your application is using native code (through JNI) ? In such case, the application will just crash silently, giving the user no opportunity to report the bug to the upstream developer (you), which is not cool (because the bug will remain unspotted, unless users are nice enough to email you, and have the know-how to provide you useful technical details, such as the address of the crash, which is kind of rare)
Catching the Problem
A first step is obviously to be able to detect common native crashes (SIGSEGV, SIGBUS, etc.) using signal handlers. On POSIX systems, this can be achieved by using sigaction():
1 |
|
- First problem: we are typically running on small systems (Android …), and one source of error is the stack overflow. When the stack is full (too much recursion, too large objects on stack), you hit the last guard page, and the system will raise the
SIGSEGVsignal handler, running by default on the… same full stack, raising one more time the signal. Fortunately, you may register in any thread an alternative stack through the use ofsigaltstack, which basically reserve some space in case of emergency (ie. the system will switch the stack pointer to this one in case of trouble, letting you handler run on a “fresh” stack).
1 |
|
- Second problem: we’re hosted on a Java Virtual Machine, and some of these signals might already be caught. Typically,
SIGSEGVmight be regularly raised to addressNullPointerExceptionor as normal JIT processing (ie. executable pages might be flagged with a “no access” protection, and filled by the JIT compiler through a signal handler) – you have to make sure the original signal handler is called first, before messing up with it. If the signal was not processed, the original signal handler will generally return, or will callabort()(which is nice, because we have a last chance to catch it through aSIGABRThandler)
1 |
|
- Third problem: we’re running on a multi-threaded process, and ideally we do not want to catch crashes from threads we do not own. We can address this issue by using
pthread_getspecific()to have a thread-specific context. Well, this is actually a dirty solution:pthread_getspecific()is not an async-signal-safe function, which means that if you are using it on a signal handler, you may have to prepare for unforeseen consequences. (I fail to see what could go wrong with this specific function, however – this is just a peek in a thread-specific address array. But yes, yes, we’re playing with fire, don’t kick me!)
1 |
|
- Fourth problem: we have to collect some basic information on the crash, especially the faulting address. Fortunately, the third argument of the
sigactioncallback is a pointer to aucontext_tcontext collecting register values (and various other processor-specific details). On x86-64 architectures, the program counter will typically be saved inuc_mcontext.gregs[REG_RIP]; on ARM,uc_mcontext.arm_pc. Unfortunately, on Android, theucontext_tstructure is not defined in any system headers, and you’ll have to import one by yourself (I shamelessly copied the one from Richard Quirk). You also have to find out what was the binary where the program counter was actually running, to find out this code base address in memory, because a randomized address is not very useful for audit and debugging. The Linux-specificdladdr()function is fortunately giving you this information, with useful other ones (namely the nearest symbol matching the address, and the module base address, to compute a relative offset address). (Note: you can also get this information on Linux by snooping in/proc/self/maps, and checking the address ranges – it will at least provide you the base address)
1 |
|
You have also the opportunity to catch a backtrace, with the same information, as long as you have a recent (ie. 4.1.1 or higher) Android version, using libcorkscrew library features. This library is not available on older Android releases, and besides, we do not want to get a backtrace of the current stack, but a backtrace of the stack provided in the crash context. Fortunately, we can dynamically load the libcorkscrew.so library to solve the first issue (using dlopen and dlsym()) and, for the second issue, import manually a nice function called unwind_backtrace_signal_arch, which does exactly what we want:
1 |
|
(We also need to import acquire_my_map_info_list())
We can also, when corkscrew is there, use the advanced get_backtrace_symbols function to resolve symbols and demangle them:
1 |
|
- Fifth problem: you need to pass all these useful information back to the Java Virtual Machine, and not only by calling directly some kind of callback, because you need to propagate a clean
RuntimeExceptionand unwind all Java frames, to have your final exception being reported through the Android framework. The only way to achieve that is by storing the exit point in your own code, usingsetjmp(actuallysigsetjmp, because we’ll need to restore some masked signals), and using it in your signal handler to directly jump at the correct location. Thesigsetjmp/siglongjmpfunctions are obviously not async-signal-safe (see the remark on Application Usage ofsigaction()), so this is a highly risky bet. Typically, if the crash happened in the middle of amalloc()call (because, say, the linked list of free blocks has been corrupted), you may find yourself triggering anotherSIGSEGV(which is the lesser of the evils) or worse, deadlocked, which is rather embarrassing because the user will have to find a way to kill the application by himself. For this reason, analarm()call will be the first operation executed in case of emergency (and yes,alarm()is async-signal-safe – we can safely kill ourselves).
1 |
|
Is It Working ?
Yes, and it’s much nicer to have SIGSEGV advertised through a clean stack:
1 |
|
Bonus: produce a relative address, and get the filename and line number for FREE!
In the above stack, we know that the crash occurred somewhere inside the hts_main2 function, which is not very precise. We have actually another very useful information: the crash was spotted inside libhttrack.so, at the relative address 0xa024. This is a relative address, computed earlier with dladdr(), which means that you can find out exactly the source location if you kept some debugging information. Most people do not want them, because it increases the binary size by a unreasonable factor (especially when running on small embedded devices with 3G+ connectivity priced above gold ingots levels), and thus either strip them silently, or keep another “debug” build.
You have an extremely simple alternative way: build once your libraries with all debugging symbols, including line numbers and macro information (-g3), and instead of stripping them, split the debugging sections on a separate file (say, a .dbg file). To let various tools such as gdb or addr2line behave gently, you have a way to “tell” them that the .so actually has a debug .dbg related file, through the .gnu_debuglink ELF section.
Here’s what you typically need to do to split your library into a stripped version plus a debug symbol file:
1 |
|
The nice .dbg file can then be kept for debugging purpose:
1 |
|
Okay, but Is It Really Safe ?
A typical crash may have a great variety of causes (Captain Obvious to the rescue!). My own experience, though, shows that NULL pointer dereferencing, dangling pointers, and other isolated crash spots due to bad code logic are a very common cause of crashes. Yes, you will still have troubles when dealing with corrupted allocators, or when breaking in the middle of a async-signal-safe call (leaving mutexes locked, and more generally a dirty state that will hit you back later), but the alternate solution is to die immediately (the default behavior), so trying to do gentle emergency steps can not do any harm.
I Want To Test It!
You can check out the “CoffeeCatch” library code on GitHub – you can either merge the .c file in your project(s), or build it as a standalone library ; this tiny library has no exotic external dependencies. Make sure all your libraries are built with the -funwind-tables compiler flag to produce frame unwind information for all functions (add if necessary LOCAL_CFLAGS := -funwind-tables to your Android.mk file). Note that -funwind-tables does not produce significant data size overhead in normal situations – so rest well my friend.
The use is pretty straightforward – for JNI code, a simple macro COFFEE_TRY_JNI, taking the JNIEnv environment pointer as a first argument, and a code block as a second argument, will do the trick. For code outside JNI, you have to enclose protected code with COFFEE_TRY()/COFFEE_CATCH()/COFFEE_END() as in the example below.
In all cases, make sure the block is enclosed in a dedicated function without any local variables lying around (because the saved context does not include registers, AFAIK, especially volatile registers, which might be wiped before calling sigsetjmp, and whose saved values are in unknown location in the stack).
The JNI flavor:
1 |
|
The standard flavor:
1 |
|
TL;DR: so far, no native crash has been reported on Android for HTTrack. But I’m ready to collect them in case of need :)
Replacing JNI Crashes by Exceptions on Android的更多相关文章
- cocos2d-x 通过JNI实现c/c++和Android的java层函数互调
文章摘要: 本文主要实现两个功能: (1)通过Android sdk的API得到应用程序的包名(PackageName),然后传递给c++层函数. (2)通过c++函数调用Android的java层函 ...
- JNI 开发基础篇:Android开发中os文件的探索
正题: android开发中,时长会遇到os文件的使用,那么os文件到底是什么?在这篇文章中会进行说明. .os文件在android中意味着C语言书写的方法,经android提供的ndk进行编译,从而 ...
- Android Jni开发,报com.android.ide.common.process.ProcessException: Error configuring 错误解决方案
今天在练习JNI项目时,Android studio版本为:3.1.3,Gradle版本为4.4.由于Android studio 3.X弃用了 android.useDeprecatedNdk=tr ...
- Android JNI入门第四篇——Android.mk文件分析
ndroid.mk文件是在使用NDK编译C代码时必须的文件,Android.mk文件中描述了哪些C文件将被编译且指明了如何编译.掌握Android.mk文件的编写主要是掌握其里头将要使用的一些关键字, ...
- 深入理解JNI(《深入理解android》(author : 邓凡平)读书札记)
JNI的技术特点: java能够调用native代码. native代码能够调用java代码. JNI的技术考虑: 实现java代码的平台无关型. java语言发展初期使用C和C++代码,避免重复 ...
- NDK(5) Android JNI官方综合教程[JavaVM and JNIEnv,Threads ,jclass, jmethodID, and jfieldID,UTF-8 and UTF-16 Strings,Exceptions,Native Libraries等等]
JNI Tips In this document JavaVM and JNIEnv Threads jclass, jmethodID, and jfieldID Local and Global ...
- android 官方文档 JNI TIPS
文章地址 http://developer.android.com/training/articles/perf-jni.html JNI Tips JNI is the Java Native I ...
- Android JNI的Android.mk文件语法详解
Android.mk简介: Android.mk文件用来告知NDK Build 系统关于Source的信息. Android.mk将是GNU Makefile的一部分,且将被Build System解 ...
- Android 性能优化(18)JNI优化:JNI Tips 提升性能技巧
JNI Tips 1.In this document JavaVM and JNIEnv Threads jclass, jmethodID, and jfieldID Local and Glob ...
随机推荐
- Eclipse启动Tomcat错误:Several ports (8080, 8009) required by Tomcat v6.0 Server at localhost are already(转载)
转载自:http://blog.csdn.net/aigochina/article/details/7891107 Eclipse启动Tomcat错误: Several ports (8080, 8 ...
- Runtime - 01
Runtime是想要做好iOS开发,或者说是真正的深刻的掌握OC这门语言所必需理解的东西.最近在学习Runtime,有自己的一些心得,整理如下, 什么是Runtime 我们写的代码在程序运行过程中都会 ...
- ISNULL
ISNULL 使用指定的替换值替换 NULL. 语法ISNULL ( check_expression , replacement_value ) 参数check_expression 将被检查是否为 ...
- stdout 编码 vim 删除左边,右边
sys.stdout = codecs.getwriter('utf8')(sys.stdout) vimdic['kkkk'] = qqqqqdic['bbbb'] = aaaaaadic['kkk ...
- 多个div并排显示的居中问题——来自腾讯的一道面试题
前两天曲面了一下腾讯,被鄙视了... 自己太水了,且面试官对我可能也有点不爽,说什么还没叫我我就去了,可是尼玛写的面试时间是3点40,我特码进去的时候都3点50了,我还以为晚了呢,他妈的. 实现几个d ...
- Ext.QuickTips.init();
在Extjs的组件需要提示框时往往需要此语句. 首先,Ext.QuickTips是什么? 在Ext JS 4.2.0 的API中可以查到,注意在其他的Extjs版本以下查不到,这是因为在其他版本Ext ...
- portal、portlet、portlet容器三个概念
什么是portal Portlet规范中是这样定义portal的: A portal is a web based application that –commonly- provides perso ...
- 南方数据企业0day
漏洞影响版本 v10.0 v11.0 关键字:inurl:”HomeMarket.asp” 默认后台:/admin 直接爆用户密码: http://www.xxx.com/NewsType.asp?S ...
- 10个基于 Ruby on Rails 构建的顶级站点
本文系国内 ITOM 行业领军企业 OneAPM 工程师翻译整理自 Raviraj Hegde 的文章 Top Sites Built with Ruby on Rails. 就其本身而言,Ruby ...
- CC_UNUSED_PARAM 宏含义的解释
#define CC_UNUSED_PARAM(unusedparam) (void)unusedparam 这个宏完全没有执行任何命令,这样写的原因主要是历史遗留原因,ojb-c不存在纯虚函数并且传 ...