
量化生产力Quantifying Productivity
I'm always on a lookout for interesting datasets to collect, analyze and interpret. And what better dataset to collect/analyze than the meta-dataset of my own activity collecting/analyzing other datasets? How much time do I *really spend working per day? How do I spend most of that time? What makes me productive? These are all relatively important questions that I'd like answers to, and since I prefer my answers based on data and not confirmation-bias-susceptible personal anecdotes, I wrote ulogme.
"I prefer my answers based on data, not confirmation-bias-susceptible personal anecdotes"
I've now collected my computer usage data over a period of almost 3 months. In this post I'll highlight some of the features of the project, some of the insights I was able to derive so far and some thoughts about where I hope I can take it next. And who knows, maybe by the end of the post you'll want to become a user yourself :)
What's out there already
The idea of tracking and visualizing your computer activity is not at all new. It has been around in various shapes and forms in Quantified Self circles and several programs already exist that try to fill this need. Among the few better known ones are RescueTime and Toggl, but there are literally tens to hundreds of other quite terrible copies. Among all of these, I couldn't find anything that satisfies a few very simple, basic requirements:
- The user interface must be web-based because it's 2014
- Everything must be open source and free
- The data must never leave the local machine (No cloud mambo jambo - too personal!)
- It must be easily customizable and look pretty
Nothing like this (by far, actually) exists, so I set out to implement my own solution.
Brief Tour of ulogme : Single Day View
ulogme is small and simple: There are two backend components: a tracking script that records activity and a small local web server wrapper that serves the activity logs to the frontend (visualization pages). The tracking script currently records active window titles (at frequency of once every 2 seconds) and keystroke typing frequency.
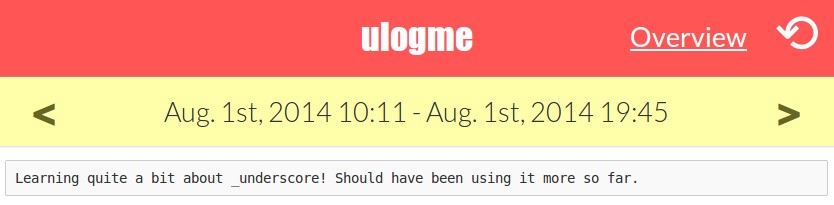
Lets go through a brief overview of some of the resulting visualizations and features. First there is the single day view. Lets look at my August 1st, for example. The header tells us the day of the recording and there is space for a short "blog" post that can be written up for each day:
Now we start to get to the meat. It looks like I was in the office from 10AM to 8PM on this day. Now, remember that we record keystrokes and window titles throughout. What follows is the keystroke breakdown for the day:
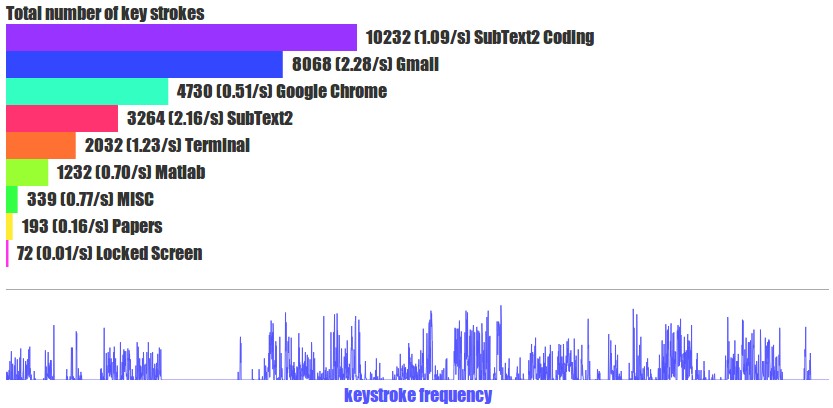
We see that I spent most of the day coding in Sublime Text 2 (which I use to write Python/JS/C++) and Gmail - Looks like I wrote quite a bit of email! Next, ulogme shows the barcode of the day, as I like to call it. This is a breakdown of all the windows on that day:
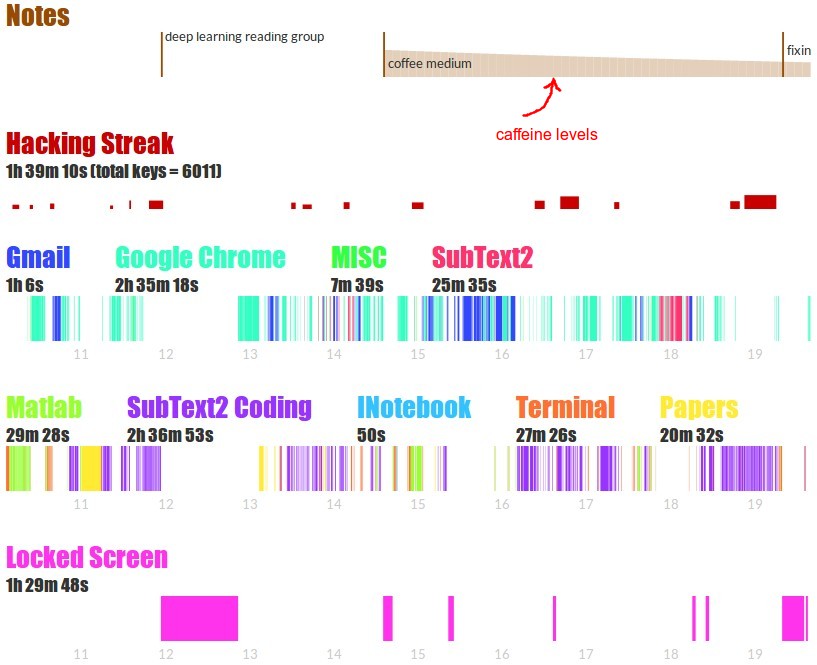
This view is a little dense so let me unpack it one by one:
- The Notes feature (on top) allows me to enter arbitrary notes for any time of day. Notice I also wrote an (optional) feature that looks for notes about coffee and calculates my levels of caffeine based on actualhalf-life of coffee. I am curious what caffeine does to my productivity!
- I group my windows into display groups barcodes, where the first group involves fun (Gmail/Chrome/Non-coding files opened in Sublime Text 2 - such as .markdown for blogging) and the second the group involves work (Matlab/Ipython Notebook with.js/.css/.cpp/.h/.py files, or PDF files opened (papers)). Looks like I spent roughly half of the day on work.
- Hacking Streak is a nifty feature that tries to identify contiguous hacking activity and correlates reasonably with my productivity. It looks for active windows that constitute work (I define this in settings) and then for continuous keystrokes above some typing frequency threshold. This indicates that I'm in a state of hacking, and the streak gets gradually interrupted if I switch windows to non-working titles, or if I stop writing code. The longest one visible here was 22 minutes and when I hover over the active title at that time, I see that it was me adding a feature to ulogme. The longest I've seen anyone get is a lab mate beta tester friend with an intense 50-minute hacking streak.
In the end, ulogme shows the final breakdown of titles that occupied me on this day:
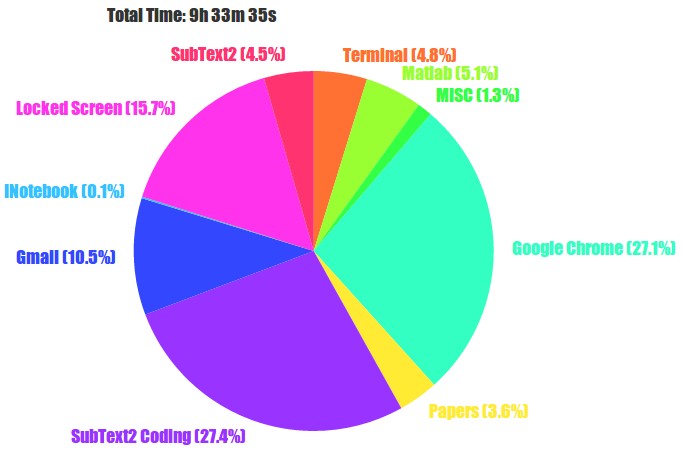
That's interesting, it looks like I actually only spent 10% of my day in Gmail. So even though I wrote a lot, it was just a few emails and chats I quickly sent out.
Brief Tour of ulogme : Global Overview
Insights for one day are interesting, but everything becomes signficiantly more meaningful when it is put in context of a large number of days. Perhaps you noticed the "Overview" link on the header; Clicking this takes you to the overview page of ulogme that takes the statistics for all days and puts them together. I recorded my activity for almost 3 months now. Here is the delicious data visualized for the entire period (with some overlayed annotations):
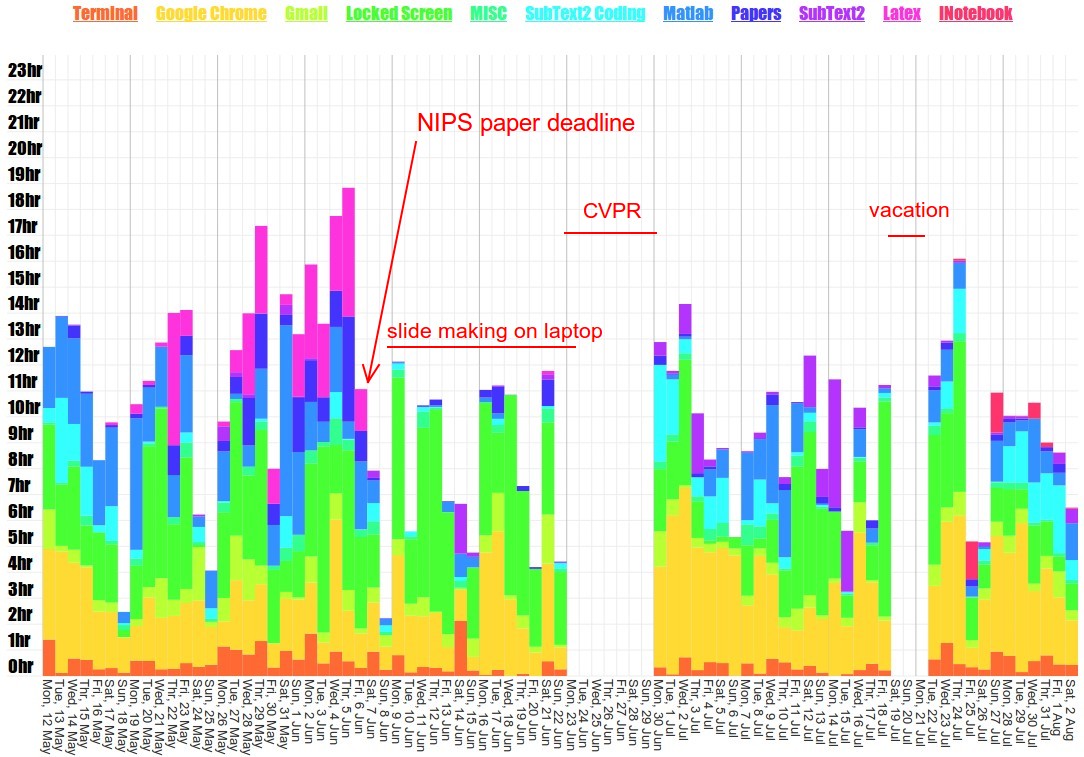
SO AWESOME. There are many fun things to note:
- Note the deadline mode right before NIPS paper deadline on June 6th. I was frantically writing Latex for the most part :)
- Right after the deadline, you see a dip in activity. This is because I was mostly on my laptop preparing things for the CVPR conference where I had to give a talk. This points to one issue with ulogme - there is no syncing across machines right now.
- Notice a few dips on Sundays -- apparently Sundays are my rest days :)
- Am I just hallucinating this, or is there a fairly significant jump in activity right after breaks (note very high bars right after CVPR and vacation.) This needs more data but it would be interesting if vacations actually made me more productive. We'd have to measure more than just time spent on computer, though.
- When I toggle off all non-working titles, the visualizaiton (not shown) reveals that I only spend somewhat depressingly little time actually working. Many days I come into lab in the morning and leave late at night to go straight to sleep, but even these days sometimes add up to only roughly 5-6 hours of actual coding. I was very surprised about this initially and went looking for bugs, but it is true upon closer inspection - there is a short commute, lunch, dinner, random reading groups, meetings, random slacking off on the internet, gmail, etc etc... it all builds up quite quickly! Depressing to see that quantified.
Next, ulogme gives me nice breakdown for both keystrokes and time spent in every window, across all time:
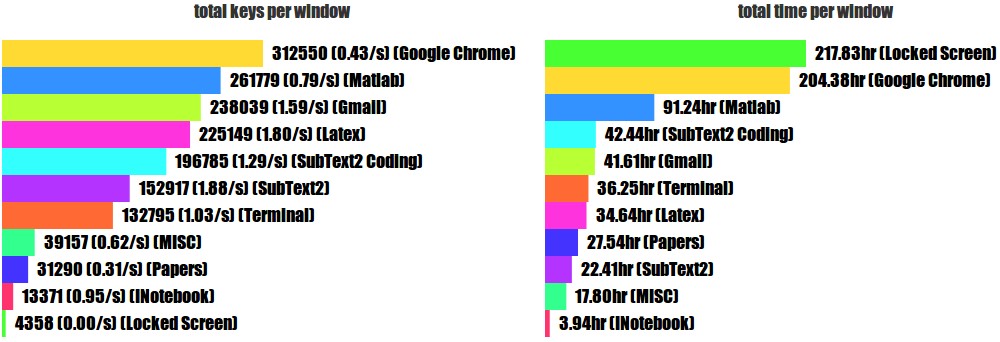
This is a little incomplete because I do some hacking on my laptop, but it paints an interesting picture nonetheless. It looks like I spent a good chunk of desktop time in Matlab, but seemingly I spend the most amount of time in Chrome screwing around and browsing the internet. Great.
What it takes to write a paper. Note that, interestingly, my total time for Latex is 35 hours - this is how long it takes to write a paper! Additionally, I pressed 225,149 keys in my Latex editor and the $ wc -l on my paper.tex file reveals that it has 40,192 characters. Some of it is template code but, at least approximately, this means that it takes about 5.6 characters for every one character in the final paper!
It takes 35 hours and 225,149 keys to write a 40,192-character NIPS paper (i.e. 5.6 characters must be typed for every one final character.)
The final visualization is too long to paste here entirely, but I will show a snippet:
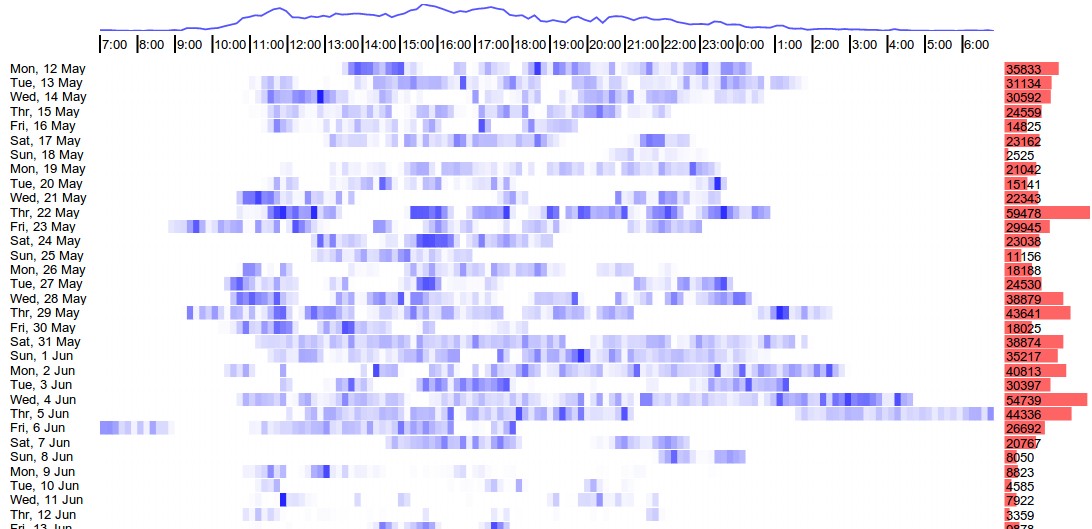
This visualization seems to suggest that I do most of my work between 10AM and 8PM, and a very productive day is about 50,000 keystrokes. You can also see a bit of my post-NIPS refactory period with much lower keystroke activity.
In the end, ulogme tells me that over the last 3 months I've pressed a total of 1,608,943 keys over 83 days, or approximately 19,384 per day.
Going forward
Going forward, I'm hoping to make ulogme into a nice, open-sourced pet project. The code is all available onGithub under MIT License and anyone is welcome try it out (if you're on Ubuntu or OSX - Windows is not supported, and if you're using a modern browser).
And if you're feeling extra adventurous, I warmly welcome pull requests for new features or bug fixes. The code base is a mix of Python, Javascript and I use d3.js for all visualizations. The project is in fairly early stages and the code is not among the nicest I've produced, but I've started fairly major refactoring efforts to make the onboarding process easier.
In longer term, I'm hoping that ulogme codebase will evolve to become beautifully modular set of data view plugins that could be customized, stacked up and composed in the user interface as desired.
Im summary, I feel I've gained quite a few insights into my own work habits by just visualizating the data, but there is much more work to be done on the analysis side as well. The holy grail here is still not implemented: What are the correlated of my productivity? Does sleeping more help? Does drinking coffee help? Do vacations or breaks help at all? All of these questions have answers and I can't wait to find them, in the data.
from: http://karpathy.github.io/2014/08/03/quantifying-productivity/
量化生产力Quantifying Productivity的更多相关文章
- 成吨提高开发效率:Intellij Shortcuts精简子集与思维模式
在线精简cheatsheet备查表:intellij.linesh.twGithub项目:intellij-mac-frequent-keymap Intellij的快捷键多而繁杂,从官方推荐的key ...
- RPM Database 实战详解
RPM 是 RPM Package Manager 的简写,是发源于 Red-hat 系统的软件管理工具,所以最初的名字叫做 Red-hat Packager Manager.目前,RPM 已发展成为 ...
- python 各种开源库
测试开发 来源:https://www.jianshu.com/p/ea6f7fb69501 Web UI测试自动化 splinter - web UI测试工具,基于selnium封装. 链接 sel ...
- python 三方面库整理
测试开发 Web UI测试自动化 splinter - web UI测试工具,基于selnium封装. selenium - web UI自动化测试. –推荐 mechanize- Python中有状 ...
- Python测试 ——开发工具库
Web UI测试自动化 splinter - web UI测试工具,基于selnium封装. selenium - web UI自动化测试. mechanize- Python中有状态的程序化Web浏 ...
- RPM Database
RPM Database RPM 不仅在安装.升级.卸载方面工作出色,而且在查询和验证方面也表现非凡.你很久前安装了一个数据库软件,但现在忘记了它的版本号,也不知道它的说明文档的位置,可以通过 RPM ...
- 《Google软件测试之道》之学习笔记01
Google软件测试介绍 软件测试团队->工程生产力(Engineering Productivity) http://googletesting.blogspot.com/2011/01/ho ...
- python测试开发工具库汇总(转载)
Web UI测试自动化 splinter - web UI测试工具,基于selnium封装. selenium - web UI自动化测试. mechanize- Python中有状态的程序化Web浏 ...
- 量化Hacker News 中50天的数据 Quantifying Hacker News with 50 days of data
Quantifying Hacker News I thought it would be fun to analyze the activity on one of my favorite sour ...
随机推荐
- 用Redis bitmap统计活跃用户、留存
Spool的开发者博客,描述了Spool利用Redis的bitmaps相关的操作,进行网站活跃用户统计工作. 原文:http://blog.getspool.com/2011/11/29/fast-e ...
- Javascript Array.prototype.some()
当我们使用数组时,查找数组中包含某个特殊的项是非常常见的动作.下面例子是一个简单的实现: 01 planets = [ 02 "mercury", 03 " ...
- ios技术面试题
1.Difference between shallow copy and deep copy? 浅复制 只拷贝地址 不拷贝地址指向的对象 深复制 拷贝地址 并且指向拷贝的新对象 2.What is ...
- asp.net 多个域名重定向,在web.Config中配置
一个网站有多个域名,但是需要在访问其中某个域名之后跳转到另一域名. Web.config 中配置 </system.webServer> <!--重定向 域名 开始--> &l ...
- python学习小结8:I/O
文件I/O是Python中最重要的技术之一,在Python中对文件进行I/O操作是非常简单的. 打印到屏幕上 >>> print "python is really a g ...
- Careercup - Google面试题 - 5205167846719488
2014-05-03 23:35 题目链接 原题: For a given node in binary search tree find a next largest number in searc ...
- 3244: [Noi2013]树的计数 - BZOJ
Description 我们知道一棵有根树可以进行深度优先遍历(DFS)以及广度优先遍历(BFS)来生成这棵树的DFS序以及BFS序.两棵不同的树的DFS序有可能相同,并且它们的BFS序也有可能相同, ...
- MAC 13信道
房东的路由器一直连不上,手机却能连上,前天设置了13信道,后来又忘了,最后找到个连接WIFI的方法,在网络偏好设置里选择向导,诊断中可以连上wifi.
- Window 2008 R2 + IIS7.5 + VS2013 错误代码 0x80070002
HTTP 错误 404.0 - Not Found 您要找的资源已被删除.已更名或暂时不可用.详细错误信息模块 IIS Web Core通知 MapRequest Handler处理程序 Static ...
- crontab定时运行git命令 更新代码库
Q: http://stackoverflow.com/questions/7994663/git-push-via-cron I'm trying to run a git push fro ...