
Qt使用QCustomPlot开发
一、入门
1、下载源文件http://www.qcustomplot.com/;
2、把.cpp和.h放在工程目录下,并将cpp和h加入工程;
3、在.pro中:QT += printsupport;
4、在ui中添加一个Widget,右键提升为,输入:QCustomPlot,改变对象名称为customPlot;
5、加入代码:
void MainWindow::initUi()
{
QVector<double> x(101), y(101); // initialize with entries 0..100
for (int i=0; i<101; ++i)
{
x[i] = i/50.0 - 1; // x goes from -1 to 1
y[i] = x[i]*x[i]; // let's plot a quadratic function
}
ui->customPlot->addGraph();// 添加数据曲线(一个图像可以有多个数据曲线),graph(0);可以获取某个数据曲线(按添加先后排序);默认x1,y1轴
ui->customPlot->addGraph(ui->customPlot->xAxis,ui->customPlot->yAxis2);//添加的曲线以x1,y2为基准轴
ui->customPlot->graph(0)->setData(x, y);// setData();为数据曲线关联数据
ui->customPlot->xAxis->setLabel("x");// 为坐标轴添加标签
ui->customPlot->yAxis->setLabel("y");
ui->customPlot->xAxis->setRange(-1, 1);// 设置坐标轴的范围,以看到所有数据
ui->customPlot->yAxis->setRange(-1, 1);
ui->customPlot->replot();// 重画图像
//ui->customPlot->rescaleAxes();//自动设置最合适的显示范围
//ui->customPlot->setInteractions(QCP::iRangeDrag | QCP::iRangeZoom);//可移动可拖放
//ui->customPlot->graph(0)->addData(double,double);//追加点
}
效果:

6:、添加QCustomPlot的帮助文档
在下载的源码包里有个qch文件,放在:D:\QT5.8\Docs\Qt-5.8里面,就可以使用帮助文档了
ps:
1、设置x坐标轴为时间
int showTime=;//60秒

QDateTime dateTime = QDateTime::currentDateTime();

double  now = dateTime.toTime_t();

QSharedPointer<QCPAxisTickerDateTime> xTicker(new QCPAxisTickerDateTime);

xTicker->setTickCount();

xTicker->setDateTimeFormat("yyyy.MM.dd-hh:mm");//

ui->customPlot_4_1->xAxis->setTicker(xTicker);

xTicker->setTickStepStrategy(QCPAxisTicker::tssMeetTickCount);

ui->customPlot_4_1->xAxis->setRange(now-showTime,now+showTime);//显示多久的数据,前后60秒
最小单位是秒

2、设置位置
setPositionAlignment(Qt::AlignTop)
3、坐标轴刻度样式
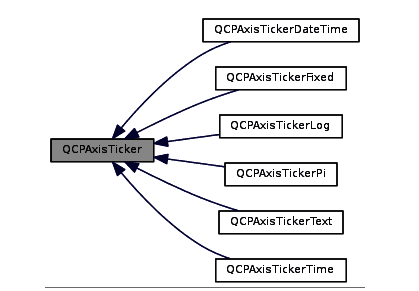
使用QCPAxis::setTicker (QSharedPointer< QCPAxisTicker > )来定制刻度
4、设置刻度高度
setTickLength
5、设置坐标轴样式
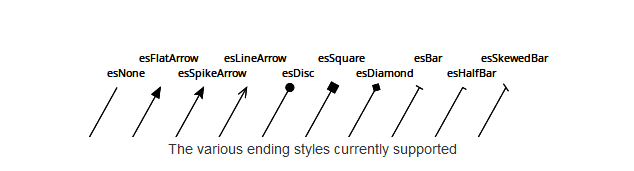
setUpperEnding
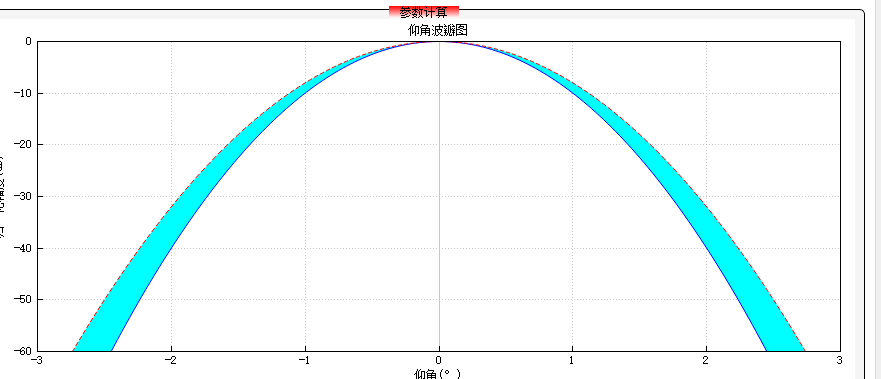
6、设置两个线条之间填充
ui->customplot->graph(0)->setBrush(Qt::cyan);
ui->customplot->graph(0)->setChannelFillGraph(ui->customplot_2_1->graph(1));
7、设置曲线形状
QCPGraph::setScatterStyle(QCPScatterStyle &style);
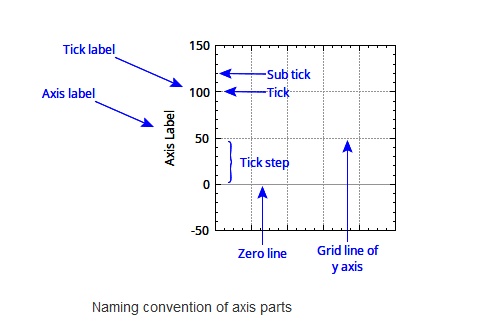
8、坐标轴相关参数命名
9、坐标区相关距离命名
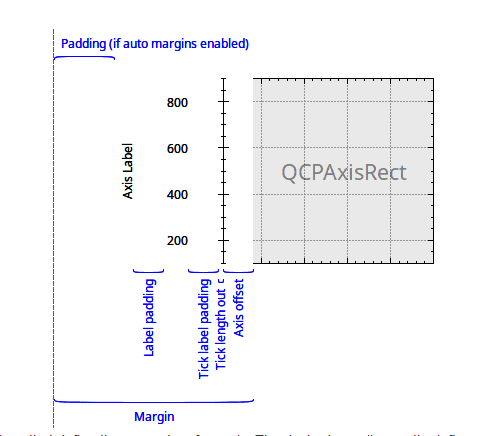
9.1、设置整个cp坐标轴距离左侧的距离
ui.customPlot->yAxis->setPadding(40);//距离左边的距离
10、设置刻度label旋转
ui.customPlot->xAxis->setTickLabelRotation(60);

11、设置坐标轴方向
ui.customPlot->xAxis->setRangeReversed(false);//x轴反向
12、获取当前x、y轴range的左右值
realLeft = ui.customPlot->xAxis->range().lower;

realRight = ui.customPlot->xAxis->range().upper;
13、设置当前显示范围有多少个刻度
ticker->setTickCount(n);
ui->customplot_2_3->xAxis->ticker()->setTickCount(5);
14、设置长刻度步长
QCPAxisTickerFixed ticker->setTickStep(0.1);
15、时间轴定制
QDateTime dateTime = QDateTime::currentDateTime();

double  now = dateTime.toTime_t();

QSharedPointer<QCPAxisTickerDateTime> yTicker(new QCPAxisTickerDateTime);

yTicker->setTickCount();

yTicker->setDateTimeFormat("yyyy.MM.dd-hh:mm");//

ui->customPlot->xAxis->setTicker(yTicker);

yTicker->setTickStepStrategy(QCPAxisTicker::tssMeetTickCount);

ui->customPlot->xAxis->setRange(now-,now+);//显示3个小时的数据
默认tickStep为1s,所以没有setTickStep函数进行设置
一般坐标轴定制需要两个参数:坐标轴显示范围【range】;此坐标轴有多少个刻度【setTickCount】
16、QCPAbstractItem

17、绘制一个点后跳过2个点
customPlot->graph(0)->setScatterSkip(2);
18、设置位置
①、
itemText_2_2->position->setType(QCPItemPosition::ptPlotCoords);//以坐标点为参考
itemText_2_2->position->setCoords(100,200);//x=100,y=200
②、
itemText_2_2->position->setType(QCPItemPosition::ptAxisRectRatio);//用0~1比例代表整个plot
itemText_2_2->position->setCoords(1,1);//右下角
18、legend设置透明
ui->customplot_5_1->legend->setBrush(QColor(255,255,255,0));
二、高级
1、单级柱状图【只有一种颜色】
①、Bar声明
QCPBars *cpBar;
②、定义
cpBar = new QCPBars(ui.customPlot->xAxis, ui.customPlot->yAxis);
③、设置值
QVector<double> ticks;//定制值
ticks << 1 << 2 << 3 << 4;
QVector<double> yCount;
yCount<<2<<3<<3<<1;
cpBar->setData(ticks, yCount);
ui.customPlot->replot();
④、效果
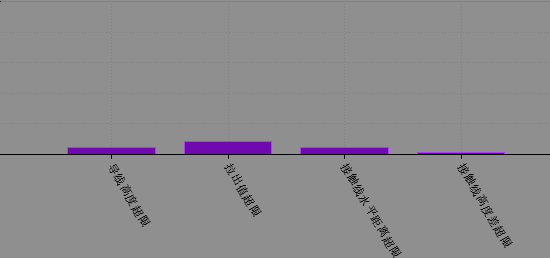
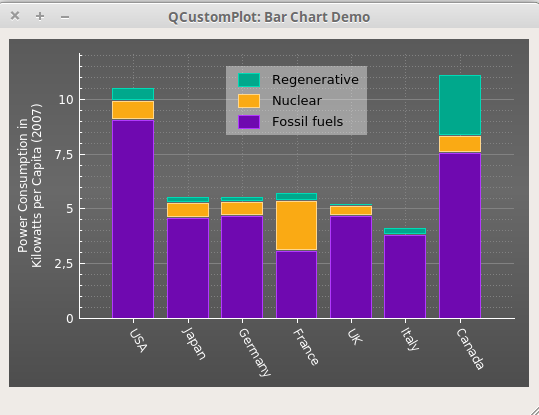
2、多级柱状图
先看效果【官网】
①、声明
QCPBars *max;
QCPBars *min;
QCPBars *sdDev;
QCPBars *varice;
②、定义
max = new QCPBars(ui.customPlot->xAxis, ui.customPlot->yAxis);
min = new QCPBars(ui.customPlot->xAxis, ui.customPlot->yAxis);
sdDev = new QCPBars(ui.customPlot->xAxis, ui.customPlot->yAxis);
varice = new QCPBars(ui.customPlot->xAxis, ui.customPlot->yAxis);
③、相关设置
max->setStackingGap(0);//设置上下bar之间的距离
min->setStackingGap(0);
sdDev->setStackingGap(0);
varice->setStackingGap(0);
max->setAntialiased(false); //提供更清晰、像素对齐的条形边框
min->setAntialiased(false);
sdDev->setAntialiased(false);
varice->setAntialiased(false);
sdDev->moveAbove(varice);//必须要写和这个,不然不会重叠
min->moveAbove(sdDev);//设置位置
max->moveAbove(min);
④、设置值
QVector<double> ticks;//定制值
ticks << 1 << 2 << 3 << 4;
QVector<double> yCount;
yCount<<2<<3<<3<<1;
max->setData(ticks, yCount);
min->setData(ticks, yCount);
varice->setData(ticks, yCount);
sdDev->setData(ticks, yCount);
ui.customPlot->replot();
3、更好看的网格线
①、默认

②、定制
ui.customPlot->xAxis->grid()->setVisible(true);
ui.customPlot->xAxis->grid()->setPen(QPen(QColor(130, 130, 130), 0, Qt::DotLine));
ui.customPlot->yAxis->grid()->setSubGridVisible(true);
ui.customPlot->yAxis->grid()->setPen(QPen(QColor(130, 130, 130), 0, Qt::SolidLine));
ui.customPlot->yAxis->grid()->setSubGridPen(QPen(QColor(130, 130, 130), 0, Qt::DotLine));

4、鼠标事件
头文件中:
void myMousePressEvent(QMouseEvent *event);
void myMouseReleaseEvent(QMouseEvent *event);
绑定:
connect(ui.customPlot, SIGNAL(mousePress(QMouseEvent*)), this, SLOT(myMousePressEvent(QMouseEvent*)));
connect(ui.customPlot, SIGNAL(mouseRelease(QMouseEvent*)), this, SLOT(myMouseReleaseEvent(QMouseEvent*)));
实现:
void RoadAllData::myMousePressEvent(QMouseEvent *event)
{
if (event->button() != Qt::LeftButton)return;//如果不是鼠标左键按下则返回
int x_pos = event->pos().x();
int y_pos = event->pos().y();
// 把鼠标坐标点 转换为 QCustomPlot 内部坐标值 (pixelToCoord 函数)
// coordToPixel 函数与之相反 是把内部坐标值 转换为外部坐标点
double x_val = ui.customPlot->xAxis->pixelToCoord(x_pos);
double y_val = ui.customPlot->yAxis->pixelToCoord(y_pos);
}
void RoadAllData::myMouseReleaseEvent(QMouseEvent *event)
{
if (event->button() != Qt::LeftButton)return;
}
5、textitem的使用
①、声明
QCPItemText* itemText = NULL;
②、定义
   QCPItemText* itemText = new QCPItemText(ui->customplot_1_1);

    itemText->setPositionAlignment(Qt::AlignHCenter | Qt::AlignBottom);//以哪个位置为标准

    itemText->position->setType(QCPItemPosition::ptAxisRectRatio);//以屏幕可见范围为参考

    itemText->position->setCoords(0.5, 0.95); //位置,从坐标矩形左上开始为(0,0),右下角为(1,1),x是向右,y是向下

    itemText->setFont(QFont(font().family(), )); //字体库,大小

    itemText->setTextAlignment(Qt::AlignLeft);

#if CLOSE_IF

    itemText->setPen(QPen(Qt::black)); //边框

#endif

    itemText->setText("增益下降0.225dB\n指向偏离0°\n波束展宽4.9954%\n副瓣抬高7.353dB");//

    itemText->setBrush(QBrush(QColor("#C4DDC3")));//背景色

    itemText->setPadding(QMargins(, , , ));
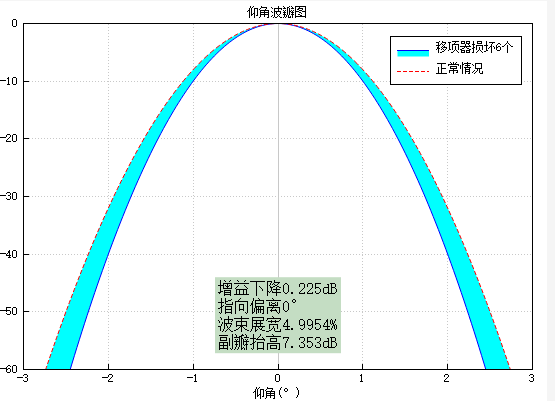
相关设置可参考:https://blog.csdn.net/umke888/article/details/54572647
③、设置值
itemText->setText("......");
6、QSlider与显示range对应
**领导说,界面固定,用滑条来滑动。这都21世纪了,为什么要用20世纪的东西,不过行,**满足你,/微笑
①、使用QSlider,按下、释放、获取值
    QObject::connect(ui.horizontalSlider, SIGNAL(valueChanged(int)), this, SLOT(sliderMovedSlot(int)));

    QObject::connect(ui.horizontalSlider, SIGNAL(sliderPressed()), this, SLOT(sliderPressSlot()));

    QObject::connect(ui.horizontalSlider, SIGNAL(sliderReleased()), this, SLOT(sliderReleaseSlot()));
②、通过设置range来显示Customplot当前位置
ui.customPlot->xAxis->setRange(realMax, realMax );
Qt使用QCustomPlot开发的更多相关文章
- QCustomPlot开发笔记(一):QCustomPlot简介、下载以及基础绘图
前言 QCustomPlot开发笔记系列整理集合,这是目前使用最为广泛的Qt图表类(Qt的QWidget代码方向只有QtCharts,Qwt,QCustomPlot),使用多年,系统性的整理,过目 ...
- Qt for Android开发环境搭建及测试过程记录
最近学习了Qt的QML编程技术,感觉相较于以前的QtGUI来说更方便一些,使用QML可以将界面与业务逻辑解耦,便于开发. QML支持跨平台,包括支持Android平台,因此可以使用Qt的QML进行An ...
- Qt的IDE开发环境(KDevelop,MonKey Studio,QDevlop,Dev-cpp,Cobras,Edyuk)
讲到Qt的IDE开发环境,本人一直在Windows下使用VC6.0 + Qt4.3.1开发程序.但转到Linux下,使用Fedora中自带的KDevelop + Qt4.3.1开发程序. 最近一直做Q ...
- Qt For Android 开发环境配置
想了想,还是再写一篇关于Qt for Android开发环境配置的教程. 准备:Java jdk,Android sdk,Android adb,Android ndk,Android ant,Qt ...
- 【Qt编程】基于Qt的词典开发系列--后序
从去年八月份到现在,总算完成了词典的编写以及相关技术文档的编辑工作.从整个过程来说,文档的编写比程序的实现耗费的时间更多.基于Qt的词典开发系列文章,大致包含了在编写词典软件过程中遇到的技术重点与难点 ...
- 【Qt编程】基于Qt的词典开发系列<六>--界面美化设计
本文讲一讲界面设计,作品要面向用户,界面设计的好坏直接影响到用户的体验.现在的窗口设计基本都是扁平化的,你可以从window XP与window 8的窗口可以明显感觉出来.当然除了窗口本身的效果,窗口 ...
- 【Qt编程】基于Qt的词典开发系列<三>--开始菜单的设计
这篇文章讲讲如何实现开始菜单(或者称为主菜单)的设计.什么是开始菜单呢?我们拿常用的软件来用图例说明,大多数软件的开始菜单在左下角,如下图: 1.window 7的开始菜单 2.有道词典的主菜单 3. ...
- 【Qt编程】基于Qt的词典开发系列<二>--本地词典的设计
我设计的词典不仅可以实现在线查单词,而且一个重大特色就是具有丰富的本地词典库:我默认加入了八个类型的词典,如下所示: 由于是本人是通信专业,因此加入了华为通信词典.电子工程词典,又由于我喜爱编程,也加 ...
- 【Qt编程】基于Qt的词典开发系列<一>--词典框架设计及成品展示
去年暑假的时候,作为学习Qt的实战,我写了一个名为<我爱查词典>的词典软件.后来由于导师项目及上课等原因,时间不足,所以该软件的部分功能欠缺,性能有待改善.这学期重新拿出来看时,又有很多东 ...
随机推荐
- hdu 3622(二分+2-sat判断可行性)
题目链接:http://acm.hdu.edu.cn/showproblem.php?pid=3622 思路:二分是容易想到的,由于题目中有明显的矛盾关系,因此可以用2-sat来验证其可行性.关键是如 ...
- day1笔记 初识python,paython基础
一.计算机,操作系统 软件发送指令给操作系统,操作系统再把指令发送给 内存,cpu,硬盘等 二.Python的历史. Python2: 1.臃肿,源码的重复量很多.2.语法不清晰,掺杂着c,++,P ...
- awk 特征相同的行合并
[root@linux-node1 ~]# cat test.txt hisk01 hisk02 hisk03 hisk04 hisk05 hisk06 hisk07 hisk08 [root@lin ...
- Android Studio使用心得 - 常见问题集锦
FBI Warning:欢迎转载,但请标明出处:http://blog.csdn.net/codezjx/article/details/38669939,未经本人允许请勿用于商业用途,感谢支持! 整 ...
- selenium-webdriver 中执行js代码
#获取标签的text文本值 js1="return document.getElementById('key1').innerText" dr.execute_script(js1 ...
- 学习编译并运行C代码
以<UNIX网络编程>中的代码为例,学习如何编译并运行C代码. 根据 UNIX网络编程(第3版)环境搭建——使用MAC OSX10.10,能够成功运行 1.下载本书的头文件及示例源码原书地 ...
- springboot集成h2
h2数据库是常用的开源数据库,与HSQLDB类似,十分适合作为嵌入式数据库使用,其他的数据库大部分都需要安装独立的客户端和服务器端 h2的优势: (1)h2采用纯java编写,因此不受平台的限制 (2 ...
- Python 学习之旅
流程图 第一章 Python简介 第二章 Python基础 第三章 流程控制 第四章 字符编码 第五章 文件处理 第六章 函数 第七章 模块与包 第八章 面向对象 第九章 异常处理 第十章 ...
- corethink功能模块探索开发(四)让这个模块跑起来
让这个模块跑起来,太费劲了,多半原因是自己太粗心,opencmf.php中“uid”写成了“pid”,de了好几天的bug也没有搞出来,又加上最近发生了些事(brokenhearted)... 上报错 ...
- 算法题 19 二叉平衡树检查 牛客网 CC150
算法题 19 二叉平衡树检查 牛客网 CC150 实现一个函数,检查二叉树是否平衡,平衡的定义如下,对于树中的任意一个结点,其两颗子树的高度差不超过1. 给定指向树根结点的指针TreeNode* ro ...