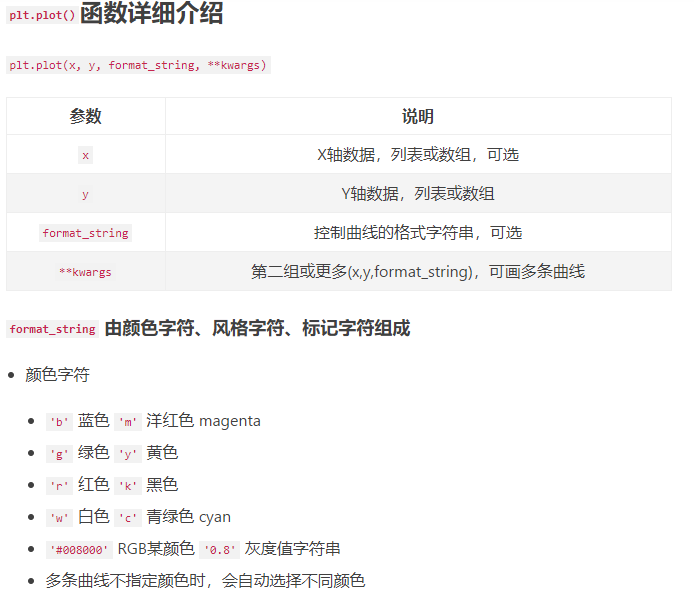
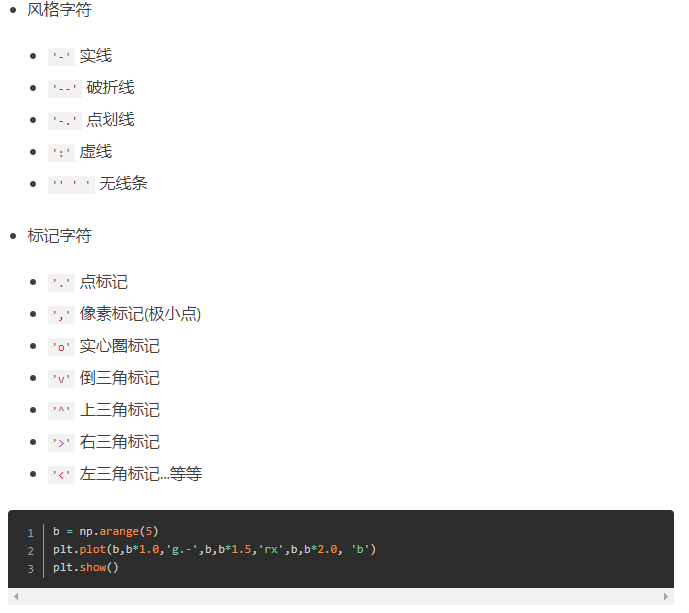
plt.figure()的使用,plt.plot(),plt.subplot(),plt.subplots()和图中图
参考:https://blog.csdn.net/m0_37362454/article/details/81511427
matplotlib官方文档:https://matplotlib.org/stable/api/_as_gen/matplotlib.pyplot.figure.html
1.figure语法及操作
plt.figure()是新建一个画布。如果有多个图依次可视化的时候,需要使用,否则所有的图都显示在同一个画布中了。
使用plt.figure()的目的是创建一个figure对象。
整个图形被视为图形对象。当我们想调整图形的大小以及在一个图形中添加多个轴对象时,有必要显式地使用plt.figure()。
# in order to modify the size

fig = plt.figure(figsize=(12,8))

# adding multiple Axes objects

fig, ax_lst = plt.subplots(2, 2)  # a figure with a 2x2 grid of Axes
plt.figure()的必要性:
这并不总是必要的,因为在创建scatter绘图时,figure是隐式创建的;但是,在您所示的情况下,图形是使用plt.figure显式创建的,因此图形将是特定大小,而不是默认大小。
# Create scatter plot here

plt.gcf().set_size_inches(10, 8)
另一种选择是在创建scatter图之后使用gcf获取当前图形,并回顾性地设置图形大小:
(1)figure语法说明
figure(num=None, figsize=None, dpi=None, facecolor=None, edgecolor=None, frameon=True)
num:图像编号或名称,数字为编号 ,字符串为名称
figsize:指定figure的宽和高,单位为英寸;
dpi参数指定绘图对象的分辨率,即每英寸多少个像素,缺省值为80 1英寸等于2.5cm,A4纸是 21*30cm的纸张
facecolor:背景颜色
edgecolor:边框颜色
frameon:是否显示边框
(2)例子:
import matplotlib.pyplot as plt
创建自定义图像
fig=plt.figure(figsize=(4,3),facecolor='blue')
plt.show()
legend(loc  # Location code string, or tuple (see below).

            #  图例所有figure位置。  labels  # 标签名称。

    prop    # the font property.

            #  字体参数

    fontsize  # the font size (used only if prop is not specified).

              #  字号大小。

    markerscale  # the relative size of legend markers vs.

                 # original  图例标记与原始标记的相对大小

    markerfirst  # If True (default), marker is to left of the label.

                 #  如果为True,则图例标记位于图例标签的左侧

    numpoints  # the number of points in the legend for line.

               #  为线条图图例条目创建的标记点数

    scatterpoints  # the number of points in the legend for scatter plot.

                  #  为散点图图例条目创建的标记点数

    scatteryoffsets    # a list of yoffsets for scatter symbols in legend.

                    #  为散点图图例条目创建的标记的垂直偏移量

    frameon    # If True, draw the legend on a patch (frame).

               #  控制是否应在图例周围绘制框架

    fancybox    # If True, draw the frame with a round fancybox.

                #  控制是否应在构成图例背景的FancyBboxPatch周围启用圆边

    shadow    # If True, draw a shadow behind legend.

                #  控制是否在图例后面画一个阴影

    framealpha  # Transparency of the frame.

                #  控制图例框架的 Alpha 透明度

    edgecolor    # Frame edgecolor.

    facecolor    # Frame facecolor.

    ncol    # number of columns.

            #  设置图例分为n列展示

    borderpad    # the fractional whitespace inside the legend border.

                # 图例边框的内边距

    labelspacing    # the vertical space between the legend entries.

                  #  图例条目之间的垂直间距

    handlelength    # the length of the legend handles.

                  #   图例句柄的长度

    handleheight    # the height of the legend handles.

                  #   图例句柄的高度

    handletextpad    # the pad between the legend handle and text.

                    #   图例句柄和文本之间的间距

    borderaxespad    # the pad between the axes and legend border.

                    #  轴与图例边框之间的距离

    columnspacing    # the spacing between columns.

                    #  列间距

    title    # the legend title.

             #  图例标题

    bbox_to_anchor    # the bbox that the legend will be anchored.

                    #  指定图例在轴的位置

    bbox_transform)    # the transform for the bbox.

                    # transAxes if None.
legend()
legend(loc, ncol, **)
可参考:matplotlib 的 legend 官网:https://matplotlib.org/users/legend_guide.html

2.subplot创建单个子图
(1) subplot语法
subplot(nrows,ncols,sharex,sharey,subplot_kw,**fig_kw)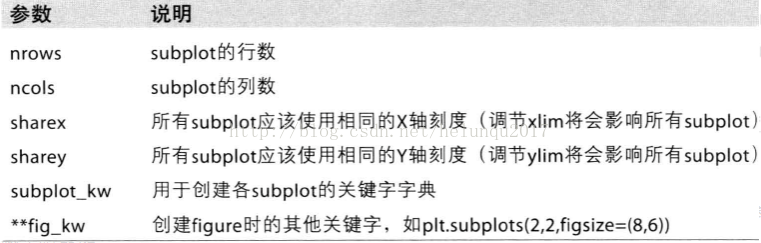
subplot可以规划figure划分为n个子图,但每条subplot命令只会创建一个子图 ,参考下面例子。
(2)例子
import numpy as np
import matplotlib.pyplot as plt
x = np.arange(0, 100)
#作图1
plt.subplot(221)
plt.plot(x, x)
#作图2
plt.subplot(222)
plt.plot(x, -x)
#作图3
plt.subplot(223)
plt.plot(x, x ** 2)
plt.grid(color='r', linestyle='--', linewidth=1,alpha=0.3)
#作图4
plt.subplot(224)
plt.plot(x, np.log(x))
plt.show() 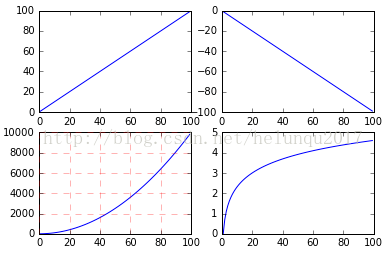
3.subplots创建多个子图
(1)subplots语法
subplots参数与subplots相似
(2)例子
import numpy as np
import matplotlib.pyplot as plt
x = np.arange(0, 100)
#划分子图
fig,axes=plt.subplots(2,2)
ax1=axes[0,0]
ax2=axes[0,1]
ax3=axes[1,0]
ax4=axes[1,1]
#作图1
ax1.plot(x, x)
#作图2
ax2.plot(x, -x)
#作图3
ax3.plot(x, x ** 2)
ax3.grid(color='r', linestyle='--', linewidth=1,alpha=0.3)
#作图4
ax4.plot(x, np.log(x))
plt.show() 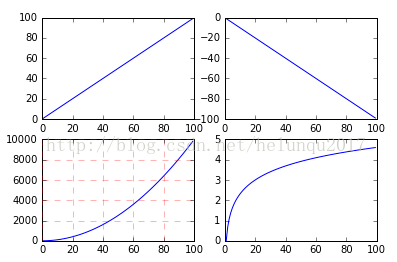
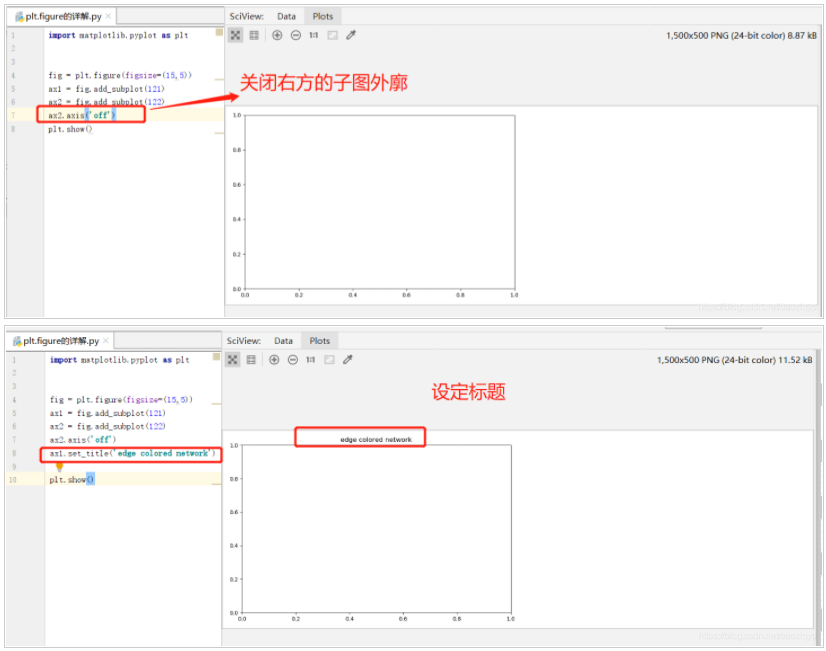
4.面向对象API:add_subplots与add_axes新增子图或区域
add_subplot与add_axes都是面对象figure编程的,pyplot api中没有此命令
(1)add_subplot新增子图
add_subplot的参数与subplots的相似
import numpy as np
import matplotlib.pyplot as plt
x = np.arange(0, 100)
#新建figure对象
fig=plt.figure()
#新建子图1
ax1=fig.add_subplot(2,2,1)
ax1.plot(x, x)
#新建子图3
ax3=fig.add_subplot(2,2,3)
ax3.plot(x, x ** 2)
ax3.grid(color='r', linestyle='--', linewidth=1,alpha=0.3)
#新建子图4
ax4=fig.add_subplot(2,2,4)
ax4.plot(x, np.log(x))
plt.show()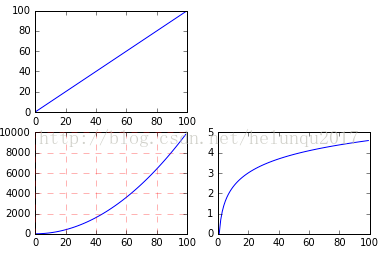
可以用来做一些子图。。。图中图。。。
(2)add_axes新增子区域
add_axes为新增子区域,该区域可以座落在figure内任意位置,且该区域可任意设置大小
add_axes参数可参考官方文档:http://matplotlib.org/api/_as_gen/matplotlib.figure.Figure.html#matplotlib.figure.Figure
import numpy as np
import matplotlib.pyplot as plt
#新建figure
fig = plt.figure()
# 定义数据
x = [1, 2, 3, 4, 5, 6, 7]
y = [1, 3, 4, 2, 5, 8, 6]
#新建区域ax1
#figure的百分比,从figure 10%的位置开始绘制, 宽高是figure的80%
left, bottom, width, height = 0.1, 0.1, 0.8, 0.8
# 获得绘制的句柄
ax1 = fig.add_axes([left, bottom, width, height])
ax1.plot(x, y, 'r')
ax1.set_title('area1')

np.random.rand()返回一个或一组服从“0~1”均匀分布的随机样本值。随机样本取值范围是[0,1),不包括1。
np.random.randn()返回一个或一组服从标准正态分布的随机样本值。
plt.legend()函数主要的作用就是给图加上图例,plt.legend([x,y,z])里面的参数使用的是list的的形式将图表的的名称喂给这个函数。
plt.legend()原文链接:https://blog.csdn.net/weixin_41950276/article/details/84259546
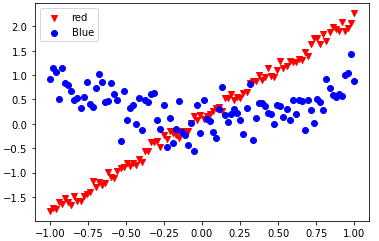
from matplotlib import pyplot as plt

import numpy as np

train_x = np.linspace(-1, 1, 100)

train_y_1 = 2*train_x + np.random.rand(*train_x.shape)*0.3

train_y_2 = train_x**2+np.random.randn(*train_x.shape)*0.3

plt.scatter(train_x, train_y_1, c='red', marker='v' )

plt.scatter(train_x, train_y_2, c='blue', marker='o' )

plt.legend(["red","Blue"])

plt.show()

import tensorflow as tf

from matplotlib import pyplot as plt

import numpy as np

train_x = np.linspace(-1, 1, 100)

train_y_1 = 2*train_x + np.random.rand(*train_x.shape)*0.3

train_y_2 = train_x**2+np.random.randn(*train_x.shape)*0.3

plt.scatter(train_x, train_y_1, c='red', marker='v' )

plt.scatter(train_x, train_y_2, c='blue', marker='o' )

plt.legend(["red","Blue"])

plt.show()


plt.figure()的使用,plt.plot(),plt.subplot(),plt.subplots()和图中图的更多相关文章
- plt.figure()的使用
版权声明:本文为博主原创文章,遵循 CC 4.0 by-sa 版权协议,转载请附上原文出处链接和本声明.本文链接:https://blog.csdn.net/m0_37362454/article/d ...
- tensorflow_目标识别object_detection_api,RuntimeError: main thread is not in main loop,fig = plt.figure(frameon=False)_tkinter.TclError: no display name and no $DISPLAY environment variable
最近在使用目标识别api,但是报错了: File "/usr/local/lib/python2.7/dist-packages/tensorflow/python/ops/script_o ...
- subplot()一个窗口画多个图
import matplotlib.pyplot as plt plt.subplot(m,n,p) m,n表示一个窗口上显示m行n列 p表示正在处理第p个区域的部分(区域编号从左到右,从上到下) f ...
- python时间序列分析
题记:毕业一年多天天coding,好久没写paper了.在这动荡的日子里,也希望写点东西让自己静一静.恰好前段时间用python做了一点时间序列方面的东西,有一丁点心得体会想和大家 ...
- Subplot 多合一显示
1.均匀图中图 matplotlib 是可以组合许多的小图, 放在一张大图里面显示的. 使用到的方法叫作 subplot. 使用import导入matplotlib.pyplot模块, 并简写成plt ...
- plot sin 动态配置rc settings
plot sin 动态配置rc settings 坐标轴颜色 线的颜色 绘图前景色 Code #!/usr/bin/env python # -*- coding: utf-8 -*- import ...
- matplotlib 的 subplot, axes and axis
fig = plt.figure('多图', (10, 10), dpi=80) #第一个指定窗口名称,第二个指定图片大小,创建一个figure对象 plt.subplot(222) #2*2的第二个 ...
- matplotlib subplot 多图合一
1:第一种方法 # method1: subplot2grid ################# ''' 第一个参数(3, 3) 是把图分成3行3列 第二个参数是位置 (0, 0)表示从0行0列开始 ...
- 4.8Python数据处理篇之Matplotlib系列(八)---Figure的学习
目录 目录 前言 (一)figure()方法的定义 (二)figure()方法的参数 (三)figure()方法的例子 1.多窗体绘图: 2.窗口得分别率 目录 前言 今天我们来学习一下plt.fig ...
随机推荐
- Spring集成web环境(使用封装好的工具)
接上文spring集成web环境(手动实现) ##########代码接上文############# spring提供了一个监听器ContextLoaderListener对上述功能的封装,该监听器 ...
- 鲜为人知帝国CMS内容页调用上一篇和下一篇的精华方法汇总
<span style="float:left">上一篇:[!--info.pre--]</span><span style="float: ...
- 无法连接linux虚拟机,ping不通
尝试过多种方式,动态ip静态ip来回改,完了还是不好使,ping不通,请求不到主机. 如果使用桥接模式,当前虚拟机ip设置的和本地ip一样,会导致本地网络断开. 最后的解决方式是在vmware中,点击 ...
- 四、初识Java
一.Java三大版本 JavaSE:标准版(桌面程序,控制台开发......) JavaME:嵌入式开发(手机,小家电......)[了解就行] JavaEE:E企业级开发(Web端,服务器开发... ...
- canvas 整个透明
ctx.globalAlpha=.9
- React 日常记录
以下是学习重点 原文地址 浏览器环境 JS解析和执行.绘制.事件处理.静态资源加载和处理 GUI渲染线程和Javascript线程 调度策略 先到先得(FCFS) 对短进程不利 对I/O密集不利 单处 ...
- 2021.08.03 BZOJ 疯狂的馒头(并查集)
2021.08.03 BZOJ 疯狂的馒头(并查集) 疯狂的馒头 - 题目 - 黑暗爆炸OJ (darkbzoj.tk) 重点: 1.并查集的神奇运用 2.离线化 题意: 给一个长为n的序列,进行m次 ...
- postgreSQL使用sql归一化数据表的某列,以及出现“字段 ‘xxx’ 必须出现在 GROUP BY 子句中或者在聚合函数中”错误的可能原因之一
前言: 归一化(区别于标准化)一般是指,把数据变换到(0,1)之间的小数.主要是为了方便数据处理,或者把有量纲表达式变成无量纲表达式,便于不同单位或量级的指标能够进行比较和加权. 不过还是有很多人使用 ...
- 1001-MySQL学习-第一节自习课
MySQL学习(第一节自习课) 一. 软件下载.安装 下载地址:https://dev.mysql.com/downloads/installer/ 位置:mysql->installer-&g ...
- ghostnet论文解析:ghost
创建日期: 2020-03-02 17:02:54 简介: GhostNet是2020CVPR录用的一篇对卷积操作进行改进的论文.文章的核心内容是Ghost模块(Ghost Module),可以用来替 ...