
K-Means clusternig example with Python and Scikit-learn(推荐)
python机器学习-乳腺癌细胞挖掘(博主亲自录制视频)https://study.163.com/course/introduction.htm?courseId=1005269003&utm_campaign=commission&utm_source=cp-400000000398149&utm_medium=share
https://www.pythonprogramming.net/flat-clustering-machine-learning-python-scikit-learn/
Unsupervised Machine Learning: Flat Clustering
K-Means clusternig example with Python and Scikit-learn
This series is concerning "unsupervised machine learning." The
difference between supervised and unsupervised machine learning is
whether or not we, the scientist, are providing the machine with labeled
data.
Unsupervised machine learning is where the scientist does not
provide the machine with labeled data, and the machine is expected to
derive structure from the data all on its own.
There are many forms of this, though the main form of unsupervised
machine learning is clustering. Within clustering, you have "flat"
clustering or "hierarchical" clustering.
Flat Clustering
Flat clustering is where the scientist tells the machine how many categories to cluster the data into.
Hierarchical
Hierarchical clustering is where the machine is allowed to decide how many clusters to create based on its own algorithms.
This page will cover a Flat Clustering example, and the next tutorial will cover a Hierarchical Clustering example.
Now, what can we use unsupervised machine learning for? In
general, unsupervised machine learning can actually solve the exact same
problems as supervised machine learning, though it may not be as
efficient or accurate.
Unsupervised machine learning is most often applied to questions
of underlying structure. Genomics, for example, is an area where we do
not truly understand the underlying structure. Thus, we use unsupervised
machine learning to help us figure out the structure.
Unsupervised learning can also aid in "feature reduction." A term
we will cover eventually here is "Principal Component Analysis," or PCA,
which is another form of feature reduction, used frequently with
unsupervised machine learning. PCA attempts to locate linearly
uncorrelated variables, calling these the Principal Components, since
these are the more "unique" elements that differentiate or describe
whatever the object of analysis is.
There is also a meshing of supervised and unsupervised machine
learning, often called semi-supervised machine learning. You will often
find things get more complicated with real world examples. You may find,
for example, that first you want to use unsupervised machine learning
for feature reduction, then you will shift to supervised machine
learning once you have used, for example, Flat Clustering to group your
data into two clusters, which are now going to be your two labels for
supervised learning.
What might be an actual example of this? How about we're trying to
differentiate between male and female faces. We aren't already sure
what the defining differences between a male and female face are, so we
take to unsupervised machine learning first. Our hopeful goal will be to
create an algorithm that will naturally just group the faces into two
groups. We're likely to go ahead and use Flat Clustering for this, and
then we'll likely test the algorithm to see if it was indeed accurate,
using labeled data only for testing, not for training. If we find the
machine is successful, we now actually have our labels, and features
that make up a male face and a female face. We can then use PCA, or
maybe we already did. Either way, we can try to get feature count down.
Once we've done this, we use these labels with their Principle
Components as features, which we can then feed into a supervised machine
learning algorithm for actual future identification.
Now that you know some of the uses and some key terms, let's see an actual example with Python and the Scikit-learn (sklearn) module.
Don't have Python or Sklearn?
Python
is a programming language, and the language this entire website covers
tutorials on. If you need Python, click on the link to python.org and
download the latest version of Python.
Scikit-learn (sklearn) is a popular machine learning module for the Python programming language.
The Scikit-learn module depends on Matplotlib, SciPy, and NumPy as
well. You can use pip to install all of these, once you have Python.
Don't know what pip is or how to install modules?
Pip is probably the easiest way to install
packages Once you install Python, you should be able to open your
command prompt, like cmd.exe on windows, or bash on linux, and type:
pip install scikit-learn
Having trouble still? No problem, there's a tutorial for that: pip install Python modules tutorial.
If you're still having trouble, feel free to contact us, using the contact in the footer of this website.
import numpy as np

import matplotlib.pyplot as plt

from matplotlib import style

style.use("ggplot")

from sklearn.cluster import KMeans
Here, we're just doing our basic imports. We're importing NumPy which is a useful numbers crunching module, then matplotlib for graphing, and then KMeans from sklearn.
Confused about imports and modules? (other than "KMeans")
If you're confused about imports, you may need to first run through the Python 3 Basics series, or specifically the module import syntax tutorial.
The KMeans import from sklearn.cluster is in reference to the
K-Means clustering algorithm. The general idea of clustering is to
cluster data points together using various methods. You can probably
guess that K-Means uses something to do with means. What ends up
happening is a centroid, or prototype point, is identified, and data
points are "clustered" into their groups by the centroid they are the
closest to.
Clusters being Called Cells, or Voronoi Cells, and references to Lloyd's Algorithm
One of the things that makes any new topic confusing is a lot of
complex sounding terms. I do my best to keep things simple, but not
everyone is as kind as me.
Some people will refer to the style of clusters that you wind up
seeing as "Voronoi" cells. Usually the "clusters" have defining "edges"
to them that, when shaded or colored in, look like geometrical
polygons, or cells, like this:
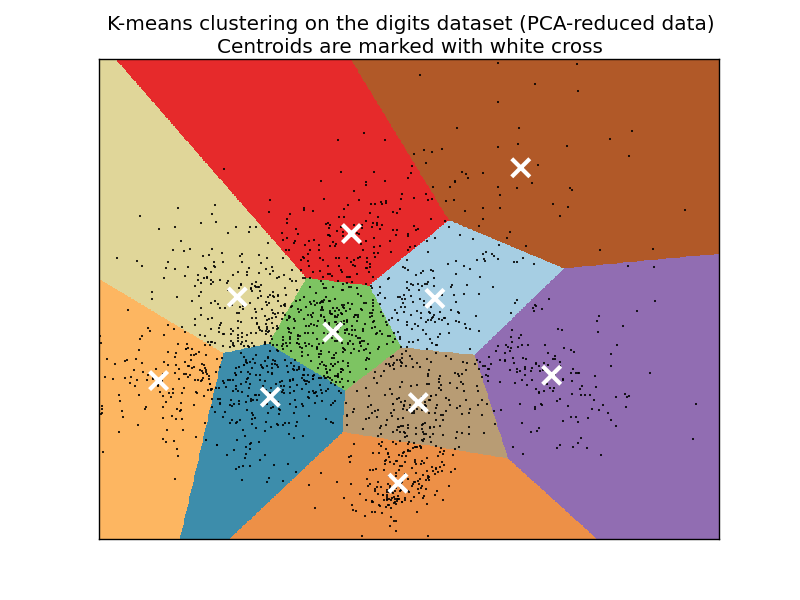
The K-Means algorithm gets its origins from "Lloyd's Algorithm," which basically does the exact same thing.
x = [1, 5, 1.5, 8, 1, 9]

y = [2, 8, 1.8, 8, 0.6, 11]

plt.scatter(x,y)

plt.show()
This block of code is not required for machine learning. What we're doing here is plotting and visualizing our data before feeding it into the machine learning algorithm.
Running the code up to this point will provide you with the following graph:
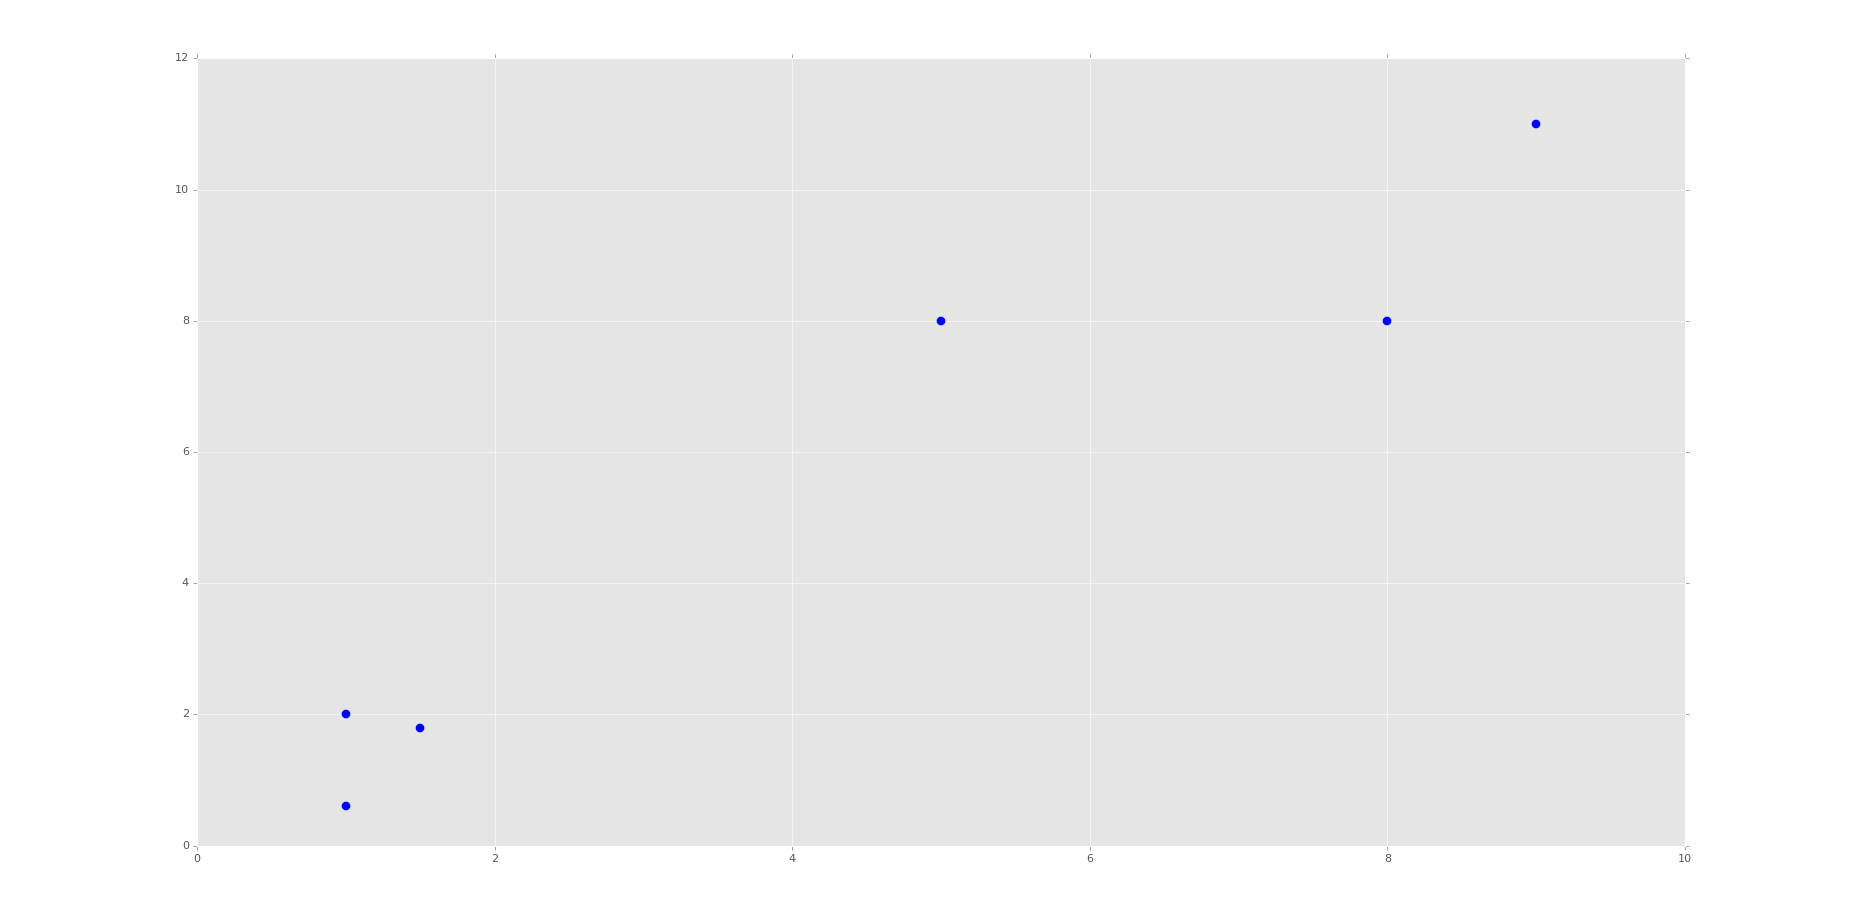
This is the same set of data and graph that we used for our Support Vector Machine / Linear SVC example with supervised machine learning.
You can probably look at this graph, and group this data all on your own. Imagine if this graph was 3D. It would be a little harder. Now imagine this graph is 50-dimensional. Suddenly you're immobilized!
In the supervised machine learning example with this data, we were allowed to feed this data to the machine along with labels. Thus, the lower left group had labeling, and the upper right grouping did too. Our task there was to then accept future points and properly group them according the groups. Easy enough.
Our task here, however, is a bit different. We do not have labeled data, and we want the machine to figure out all on its own that it needs to group the data.
For now, since we're doing flat-clustering, our task is a bit easier since we can tell the machine that we want it categorized into two groups. Still, however, how might you do this?
K-Means approaches the problem by finding similar means, repeatedly trying to find centroids that match with the least variance in groups
This repeatedly trying ends up leaving this algorithm with fairly poor performance, though performance is an issue with all machine learning algorithms. This is why it is usually suggested that you use a highly stream-lined and efficient algorithm that is already tested heavily rather than creating your own.
You also have to decide, as the scientist, how highly you value precision as compared to speed. There is always a balance between precision and speed/performance. More on this later, however. Moving on with the code
X = np.array([[1, 2],

              [5, 8],

              [1.5, 1.8],

              [8, 8],

              [1, 0.6],

              [9, 11]])
Here, we're simply converting our data to a NumPy array. See the video if you're confused. You should see each of the brackets here are the same x,y coordinates as before. We're doing this because a NumPy array of features is what Scikit-learn / sklearn expects.
kmeans = KMeans(n_clusters=2)

kmeans.fit(X)

centroids = kmeans.cluster_centers_

labels = kmeans.labels_

print(centroids)

print(labels)
Here, we initialize kmeans to be the KMeans algorithm (flat clustering), with the required parameter of how many clusters (n_clusters).
Next, we use .fit() to fit the data (learning)
Next, we're grabbing the values found for the Centroids, based on the fitment, as well as the labels for each centroid.
Note here that the "labels" here are labels that the machine has assigned on its own, same with the centroids.
Now we're going to actually plot and visualize the machine's findings based on our data, and the fitment according to the number of clusters we said to find.
colors = ["g.","r.","c.","y."]

for i in range(len(X)):

    print("coordinate:",X[i], "label:", labels[i])

    plt.plot(X[i][0], X[i][1], colors[labels[i]], markersize = 10)

plt.scatter(centroids[:, 0],centroids[:, 1], marker = "x", s=150, linewidths = 5, zorder = 10)

plt.show()
The above code is all "visualization" code, having nothing more to do with Machine Learning than just showing us some results.
First, we have a "colors" list. This list will be used to be iterated through to get some custom colors for the resulting graph. Just a nice box of colors to use.
We only need two colors at first, but soon we're going to ask the machine to classify into other numbers of groups just for learning purposes, so I decided to put four choices here. The period after the letters is just the type of "plot marker" to use.
Now, we're using a for loop to iterate through our plots.
If you're confused about the for loop, you may need to first run through the Python 3 Basics series, or specifically the For Loop basics tutorial.
If you're confused about the actual code being used, especially with iterating through this loop, or the scatter plotting code slices that look like this: [:, 0], then check out the video. I explain them there.
The resulting graph, after the one that just shows the points, should look like:
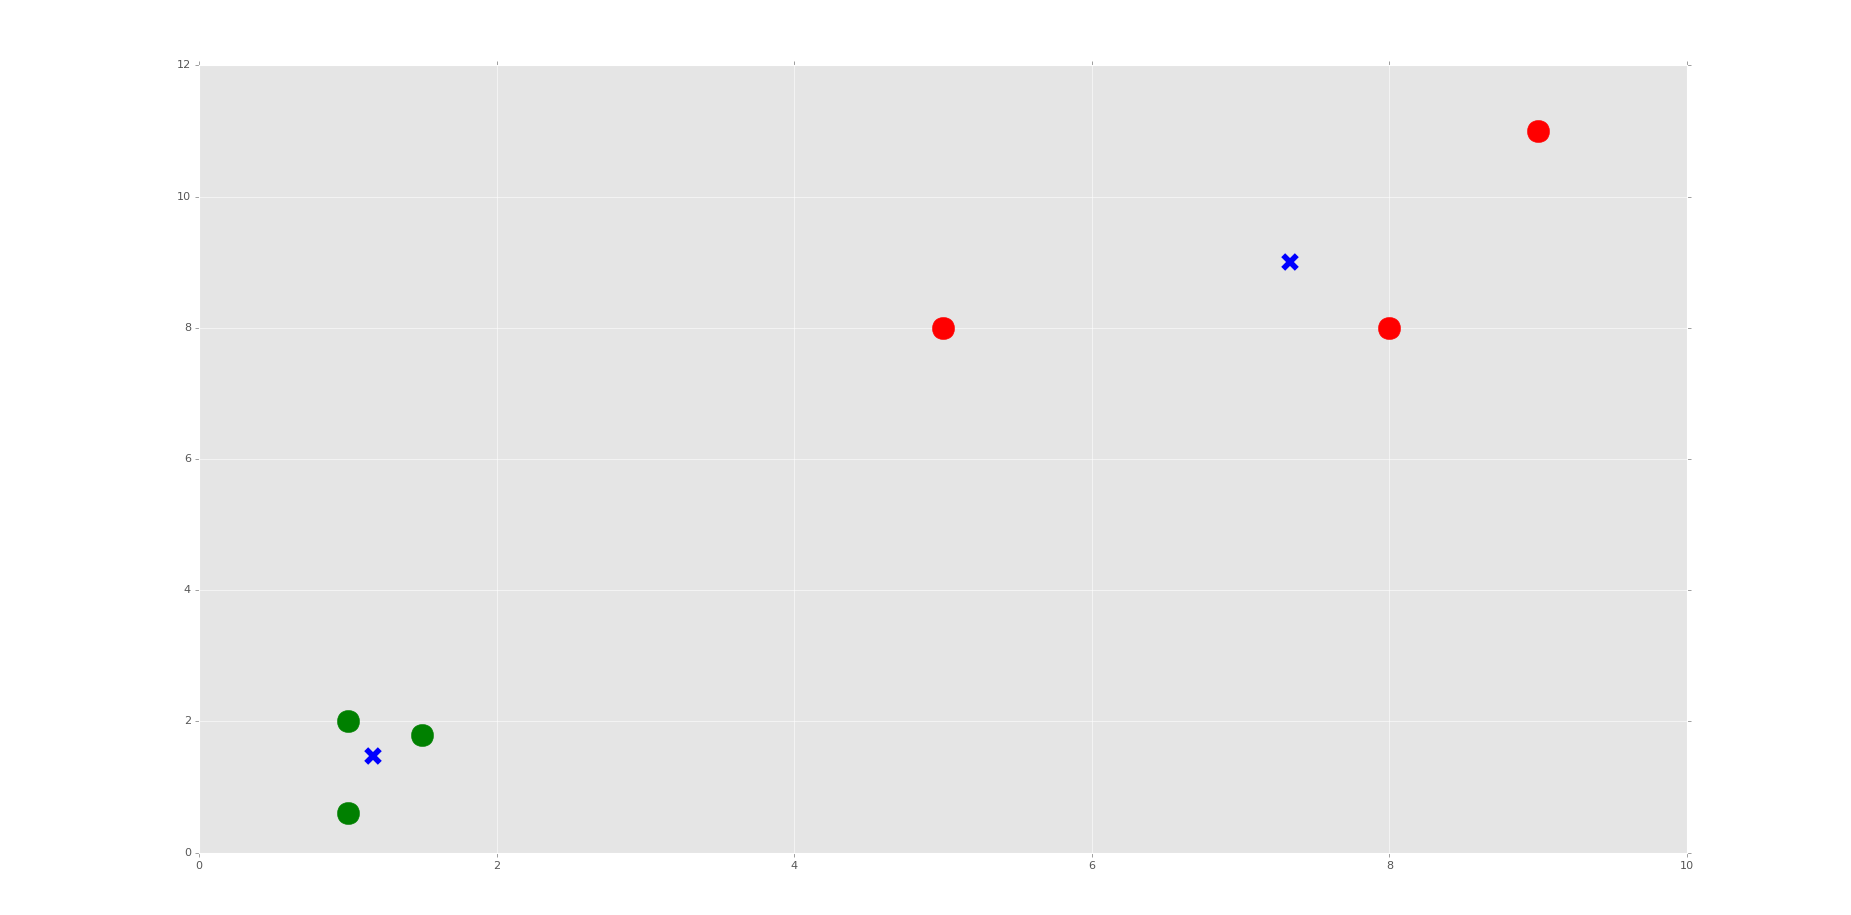
Do you see the Voronoi cells? I hope not, we didn't draw them. Remember, those are the polygons that mark the divisions between clusters. Here, we have each plot marked, by color, what group it belongs to. We have also marked the centroids as big blue "x" shapes.
As we can see, the machine was very successful! Now, I encourage you to play with the n_clusters variable. First, decide how many clusters you will do, then try to predict where the centroids will be.
We do this in the video, choosing 3 and 4 clusters. It's relatively easy to predict with these points if you understand how the algorithm works, and makes for a good learning exercise.
That's it for our Flat Clustering example for unsupervised learning, how about Hierarchical Clustering next?
python信用评分卡建模(附代码,博主录制)
K-Means clusternig example with Python and Scikit-learn(推荐)的更多相关文章
- Scikit Learn: 在python中机器学习
转自:http://my.oschina.net/u/175377/blog/84420#OSC_h2_23 Scikit Learn: 在python中机器学习 Warning 警告:有些没能理解的 ...
- 【LeetCode】402. Remove K Digits 解题报告(Python)
[LeetCode]402. Remove K Digits 解题报告(Python) 标签(空格分隔): LeetCode 作者: 负雪明烛 id: fuxuemingzhu 个人博客: http: ...
- 【剑指Offer】最小的K个数 解题报告(Python)
[剑指Offer]最小的K个数 解题报告(Python) 标签(空格分隔): 剑指Offer 题目地址:https://www.nowcoder.com/ta/coding-interviews 题目 ...
- scikit learn 模块 调参 pipeline+girdsearch 数据举例:文档分类 (python代码)
scikit learn 模块 调参 pipeline+girdsearch 数据举例:文档分类数据集 fetch_20newsgroups #-*- coding: UTF-8 -*- import ...
- (原创)(四)机器学习笔记之Scikit Learn的Logistic回归初探
目录 5.3 使用LogisticRegressionCV进行正则化的 Logistic Regression 参数调优 一.Scikit Learn中有关logistics回归函数的介绍 1. 交叉 ...
- (原创)(三)机器学习笔记之Scikit Learn的线性回归模型初探
一.Scikit Learn中使用estimator三部曲 1. 构造estimator 2. 训练模型:fit 3. 利用模型进行预测:predict 二.模型评价 模型训练好后,度量模型拟合效果的 ...
- Scikit Learn
Scikit Learn Scikit-Learn简称sklearn,基于 Python 语言的,简单高效的数据挖掘和数据分析工具,建立在 NumPy,SciPy 和 matplotlib 上.
- SAE Python使用经验 好文推荐
SAE Python使用经验 好文推荐 SAE Python使用经验 好文推荐
- python编辑器对比和推荐
python编辑器对比和推荐 我先给一个初步的表格吧,大家如果有什么意见,或有补充,欢迎提出.有些我没有用过,先不写了.以下是我使用过的python IDE: 除了PythonWin, Visua ...
随机推荐
- 使用 python 管理 mysql 开发工具箱 - 1
Mysql 是一个比较优秀的开源的数据库,很多公司都在使用.作为运维人员,经常做着一些重复性的工作,比如创建数据库实例,数据库备份等,完全都可以使用 python 编写一个工具来实现. 一.模块 Co ...
- git免密操作
windows下找到用户目录,新建 _netrc 文件 machine git.notech.cc login user password xxxxxx Linux下同样可行,需要在~目录下新建 .n ...
- 子DIV设置margin-top影响父DIV位置的解决办法
父div如果没有任何东西,子div设置margin-top,父div会下落 <!DOCTYPE html> <html lang="en"> <hea ...
- 安全测试 - CSRF攻击及防御
CSRF(Cross-site request forgery跨站请求伪造) 尽管听起来像跨站脚本(XSS),但它与XSS非常不同,并且攻击方式几乎相左.XSS利用站点内的信任用户,而CSRF则通过伪 ...
- [LeetCode] Find All Numbers Disappeared in an Array 找出数组中所有消失的数字
Given an array of integers where 1 ≤ a[i] ≤ n (n = size of array), some elements appear twice and ot ...
- [LeetCode] Sequence Reconstruction 序列重建
Check whether the original sequence org can be uniquely reconstructed from the sequences in seqs. Th ...
- [LeetCode] Reverse String 翻转字符串
Write a function that takes a string as input and returns the string reversed. Example: Given s = &q ...
- [LeetCode] Unique Binary Search Trees II 独一无二的二叉搜索树之二
Given n, generate all structurally unique BST's (binary search trees) that store values 1...n. For e ...
- 51Nod 1428 活动安排问题
51Nod 1428 活动安排问题 Link: http://www.51nod.com/onlineJudge/questionCode.html#!problemId=1428 1428 活 ...
- linux的常用文件系统格式
文件系统指文件存在的物理空间.在Linux系统中,每个分区都是一个文件系统,都有自己的目录层次结构.Linux的最重要特征之一就是支持多种文件系统,这样它更加灵活,并可以和许多其它种操作系统共存.Vi ...