highcharts中的仪表盘样式
仪表盘的样式如下:
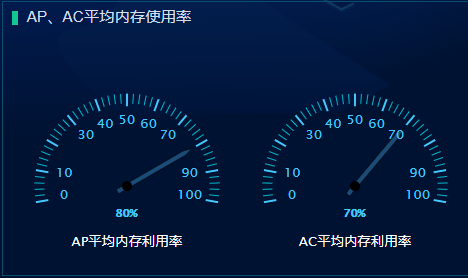
是双表盘展示
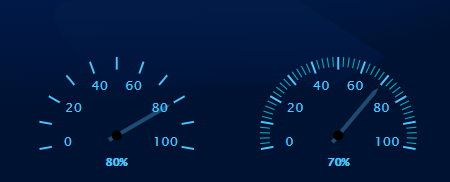
左边的图中minorTickInterval的值为null,右边的minorTickInterval的值为“auto”
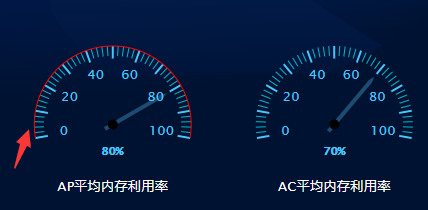
左边的图中lineColor的值为‘#f00’,右边的lineColor的值为“transparent”
yAxis: [{

    min: 0,

    // 最小刻度值

    max: 100,

    // 最大刻度值

    minorTickInterval: 'auto',

    // 表盘中比较短的刻度值

    minorTickWidth: that.torem(2),

    // 表盘中比较短的刻度值的宽度

    minorTickLength: that.torem(20),

    // 表盘中比较短的刻度值的长度

    minorTickPosition: 'inside',

    // 表盘中比较短的刻度值在内部还是在外部显示

    minorTickColor: '#00bfd3',

    // 表盘中比较短的刻度值的颜色

    tickPixelInterval: 'auto',

    // 表盘中比较长的刻度值

    tickWidth: that.torem(4),

    // 表盘中比较长的刻度值的宽度

    tickPosition: 'inside',

    // 表盘中比较长的刻度值在内部还是在外部显示

    tickLength: that.torem(26),

    // 表盘中比较长的刻度值的长度

    tickColor: '#48c7ff',

    // 表盘中比较长的刻度值的颜色

    tickInterval: 10,

    // 间隔

    lineColor: 'transparent',

    // 表盘最外层的连接线

}]
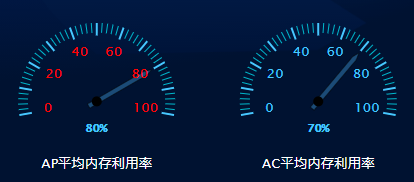
labels: {

    style: { // 刻度值数字的样式

        color: '#f00',

        fontSize: that.torem(28)

        // step: 20

    },

    distance: that.offetY

},
y轴的一些设置
yAxis: [{

    min: 0,

    // 最小刻度值

    max: 100,

    // 最大刻度值

    minorTickInterval: 'auto',

    // 表盘中比较短的刻度值

    minorTickWidth: that.torem(2),

    // 表盘中比较短的刻度值的宽度

    minorTickLength: that.torem(20),

    // 表盘中比较短的刻度值的长度

    minorTickPosition: 'inside',

    // 表盘中比较短的刻度值在内部还是在外部显示

    minorTickColor: '#00bfd3',

    // 表盘中比较短的刻度值的颜色

    tickPixelInterval: 'auto',

    // 表盘中比较长的刻度值

    tickWidth: that.torem(4),

    // 表盘中比较长的刻度值的宽度

    tickPosition: 'inside',

    // 表盘中比较长的刻度值在内部还是在外部显示

    tickLength: that.torem(26),

    // 表盘中比较长的刻度值的长度

    tickColor: '#48c7ff',

    // 表盘中比较长的刻度值的颜色

    tickInterval: 10,

    // 间隔

    lineColor: 'transparent',

    // 表盘最外层的连接线

    labels: {

        style: { // 刻度值数字的颜色

            color: '#48c7ff',

            fontSize: that.torem(28)

            // step: 20

        },

        distance: that.offetY

    },

    pane: 0,

    // 第一个面板,第二个面板是1

    title: { // 描述文字

        text: this.text1,

        verticalAlign: 'bottom',

        style: {

            color: '#fff',

            fontSize: that.torem(28)

        },

        y: that.torem(220) // 离y轴的距离

    }

}, {

    min: 0,

    max: 100,

    minorTickInterval: 'auto',

    minorTickWidth: that.torem(2),

    minorTickLength: that.torem(20),

    minorTickPosition: 'inside',

    minorTickColor: '#00bfd3',

    tickPixelInterval: 30,

    tickWidth: that.torem(4),

    tickPosition: 'inside',

    tickLength: that.torem(26),

    tickColor: '#48c7ff',

    tickInterval: 10,

    // 间隔

    tickmarkPlacement: 'on',

    lineColor: 'transparent',

    labels: {

        style: {

            color: '#48c7ff',

            fontSize: that.torem(28)

        },

        distance: that.offetY

    },

    pane: 1,

    title: {

        text: this.text2,

        verticalAlign: 'bottom',

        style: {

            color: '#fff',

            fontSize: that.torem(28)

        },

        y: that.torem(220)

    }

}],
指针以及表盘内百分比的显示的设置
plotOptions: {

    gauge: {

        dataLabels: {

            borderWidth: 0,

            enabled: true,

            color: '#48c7ff',

            fontSize: that.torem(80),

            format: ` <span> {y} % </span>`

        },

        dial: {

            radius: '80%', // 半径:指针长度

            backgroundColor: '#1b4b77',

            //指针背景色

            borderColor: 'black',

            borderWidth: that.torem(1),

            baseWidth: that.torem(10),

            topWidth: that.torem(1),

            baseLength: '90%',

            // of radius

            rearLength: '15%' //尾巴长度

        },

        borderWidth: 0

    }

},
指针中的百分比值,也就是y轴的初始刻度值
series: [{// 第一个表盘对应的数据

    data: [80],

    yAxis: 0

}, {// 第二个表盘对应的数据

    data: [70],

    yAxis: 1

}]
完整的代码
<template>

  <div class="highcharts-container" ref="chart_gauge"></div>

</template>

<script>

import Highcharts from 'highcharts/highstock';

import HighchartsMore from 'highcharts/highcharts-more';

import HighchartsDrilldown from 'highcharts/modules/drilldown';

import Highcharts3D from 'highcharts/highcharts-3d';

HighchartsMore(Highcharts);

HighchartsDrilldown(Highcharts);

Highcharts3D(Highcharts);

import { font } from '@/mixins';

export default {

    props: ['name', 'title'],

    name: 'highcharts',

    mixins: [font],

    data() {

        return {

            chart1: null,

            data_terminal: [

                {

                    name: '华为',

                    y: 21.9

                },

                {

                    name: '苹果',

                    y: 14.9

                },

                {

                    name: '三星',

                    y: 15.2

                },

                {

                    name: '小米',

                    y: 25.7

                },

                {

                    name: '其他',

                    y: 35.7

                }

            ],

            data_flow: [

                {

                    name: '热点1',

                    y: 21.9

                },

                {

                    name: '热点2',

                    y: 14.9

                },

                {

                    name: '热点3',

                    y: 15.2

                },

                {

                    name: '热点4',

                    y: 25.7

                },

                {

                    name: '其他',

                    y: 35.7

                }

            ],

            options: null,

            chartTitle: '',

            text1: null,

            text2: null,

            standSize: document.body.clientWidth,

            offetY: 0

        };

    },

    watch: {

        standSize: {

            handler(newVal, oldVal) {

                if (newVal == 4000) {

                    this.offetY = this.torem(-70);

                } else {

                    this.offetY = this.torem(-60);

                }

            },

            deep: true,

            immediate: true

        }

    },

    mounted() {

        var that = this;

        that.$el.style.height = that.$refs.chart_gauge.offsetHeight - that.torem(100) + 'px';

        console.log(this.$refs.chart_gauge.offsetHeight, 'qq');

        switch (that.title) {

            case 'cpu':

                that.text1 = 'AP平均cpu利用率';

                that.text2 = 'AC平均cpu利用率';

                break;

            case '内存':

                that.text1 = 'AP平均内存利用率';

                that.text2 = 'AC平均内存利用率';

                break;

        }

        this.options = {

            chart: {

                type: 'gauge',

                backgroundColor: 'transparent'

                // height: that.torem(500)

            },

            title: {

                text: null

            },

            labels: {

                items: [

                    {

                        style: { left: that.torem(180), top: that.torem(280), fontSize: that.torem(42), fontWeight: 'bold', fontFamily: '微软雅黑' }

                        // html: '<span style="color:#C02316">{y}</span>'

                    }

                ]

            },

            pane: [

                // 表盘1设置

                {

                    startAngle: -100, // 表盘开始的角度

                    endAngle: 100, // 表盘结束的角度

                    background: null, // 表盘的背景颜色,为null的话就是不要背景颜色

                    center: ['25%', '65%'], // 表盘的位置

                    size: '80%' // 表盘的大小

                },

                // 表盘2设置

                {

                    startAngle: -100,

                    endAngle: 100,

                    background: null,

                    center: ['75%', '65%'],

                    size: '80%'

                }

            ],

            yAxis: [

                {

                    min: 0, // 最小刻度值

                    max: 100, // 最大刻度值

                    minorTickInterval: 'auto', // 表盘中比较短的刻度值

                    minorTickWidth: that.torem(2), // 表盘中比较短的刻度值的宽度

                    minorTickLength: that.torem(20),// 表盘中比较短的刻度值的长度

                    minorTickPosition: 'inside',// 表盘中比较短的刻度值在内部还是在外部显示

                    minorTickColor: '#00bfd3',// 表盘中比较短的刻度值的颜色

                    tickPixelInterval: 'auto', // 表盘中比较长的刻度值

                    tickWidth: that.torem(4),// 表盘中比较长的刻度值的宽度

                    tickPosition: 'inside',// 表盘中比较长的刻度值在内部还是在外部显示

                    tickLength: that.torem(26),// 表盘中比较长的刻度值的长度

                    tickColor: '#48c7ff',// 表盘中比较长的刻度值的颜色

                    tickInterval: 10, // 间隔

                    lineColor: 'transparent',// 表盘最外层的连接线

                    labels: {

                        style: {// 刻度值数字的颜色

                            color: '#48c7ff',

                            fontSize: that.torem(28)

                            // step: 20

                        },

                        distance: that.offetY

                    },

                    pane: 0, // 第一个面板,第二个面板是1

                    title: { // 描述文字

                        text: this.text1,

                        verticalAlign: 'bottom',

                        style: {

                            color: '#fff',

                            fontSize: that.torem(28)

                        },

                        y: that.torem(220) // 离y轴的距离

                    }

                },

                {

                    min: 0,

                    max: 100,

                    minorTickInterval: 'auto',

                    minorTickWidth: that.torem(2),

                    minorTickLength: that.torem(20),

                    minorTickPosition: 'inside',

                    minorTickColor: '#00bfd3',

                    tickPixelInterval: 30,

                    tickWidth: that.torem(4),

                    tickPosition: 'inside',

                    tickLength: that.torem(26),

                    tickColor: '#48c7ff',

                    tickInterval: 10, // 间隔

                    tickmarkPlacement: 'on',

                    lineColor: 'transparent',

                    labels: {

                        style: {

                            color: '#48c7ff',

                            fontSize: that.torem(28)

                        },

                        distance: that.offetY

                    },

                    pane: 1,

                    title: {

                        text: this.text2,

                        verticalAlign: 'bottom',

                        style: {

                            color: '#fff',

                            fontSize: that.torem(28)

                        },

                        y: that.torem(220)

                    }

                }

            ],

            plotOptions: {

                gauge: {

                    dataLabels: {

                        borderWidth: 0,

                        enabled: true,

                        color: '#48c7ff',

                        fontSize: that.torem(80),

                        format: `<span>{y}%</span>`

                    },

                    dial: {

                        radius: '80%', // 半径:指针长度

                        backgroundColor: '#1b4b77', //指针背景色

                        borderColor: 'black',

                        borderWidth: that.torem(1),

                        baseWidth: that.torem(10),

                        topWidth: that.torem(1),

                        baseLength: '90%', // of radius

                        rearLength: '15%' //尾巴长度

                    },

                    borderWidth: 0

                }

            },

            series: [

                {

                    data: [80],

                    yAxis: 0

                },

                {

                    data: [70],

                    yAxis: 1

                }

            ]

        };

        this.initChart();

    },

    methods: {

        initChart(options) {

            this.chart1 = new Highcharts.Chart(this.$refs.chart_gauge, this.options);

            var title_AP_cpu = {

                text: 'AP平均cpu利用率'

            };

            var title_AC_cpu = {

                text: 'AC平均cpu利用率'

            };

            var title_AP_RAM = {

                text: 'AP平均内存利用率'

            };

            var title_AC_RAM = {

                text: 'AC平均内存利用率'

            };

        }

    }

};

</script>

<style lang="scss">

// .highcharts-container {

// width: 100%;

// height: calc(100% - 30px);

// display: flex;

// & > div {

//     flex: 1;

// }

.highcharts-credits {

    display: none !important;

}

.highcharts-text-outline {

    // 去掉dataLabels的outline

    display: none;

}

.redColor {

    color: #ff6748;

}

.blueColor {

    color: #48c7ff;

}

.greenColor {

    color: #13c792;

}

// }

</style>
highcharts中的仪表盘样式的更多相关文章
- trigger() --工作中问题nav样式
自动执行某元素的某个事件 $("#div").trigger("click"); //让系统自动执行单击事件 适用于nav样式中,下面横线绝对定位于nav.o ...
- JQuery中操作Css样式的方法
JQuery中操作Css样式的方法//1.获取和设置样式 $("#tow").attr("class")获取ID为tow的class属性 $("#tw ...
- Android中自定义checkbox样式
1.首先在drawable文件夹中添加drawable文件checkbox_style.xml.
- ArcGIS中的style样式的使用
MapGIS安装包大小(以M计算)与ArcGIS (以G计算)在数量级存在差异,就可以隐约知道ArcGIS功能的强大.ArcGIS更注重重用(比如符号库.模块等).数据与制图分离(尤其是制图表达最能体 ...
- 在网页中插入CSS样式表的几种方法
1. 链入外部样式表 链入外部样式表是把样式表保存为一个样式表文件,然后在页面中用<link>标记链接到这个样式表文件,这个<link>标记必须放到页面的<head> ...
- html5 中的 css样式单 的 两种调用方式的区别
在 html5 中 使用 css 样式单的方式 有4种: 1.链接外部样式文件:将样式文件 彻底与 html 文档分离,样式文件需要额外引入,这种情况下 一批样式 可以控制多份文档.对于好多文件都共有 ...
- css中的列表样式
在网页设计中,我们经常将某些具有相似功能的标签放在同一组中,这时我们经常会用到列表标签(无序列表ul,有序列表ol),在列表标签中对列表样式的设计可以使我们的页面得到一定程度的美化. 在css中对列表 ...
- css中的字体样式及元素样式
css中的字体样式一般包含有就9中,常见的有7种.这7种依次为: 1.字体样式:font-family: 2.字体大小:font-size: 3.字体加粗:font-weight: 4.字体斜体:fo ...
- Windows Phone 8初学者开发—第13部分:设置LongListSelector中磁贴的样式
原文 Windows Phone 8初学者开发—第13部分:设置LongListSelector中磁贴的样式 第13部分:设置LongListSelector中磁贴的样式 原文地址: http://c ...
- HTML文档中应用css样式的方法总结
在HTML文档中应用css样式大致有三种方法:1.link标签链接外部样式表:2.使用style元素包含样式表:3.使用style属性,即内联样式 一.link标签链接外部样式表 先看一条较为标准的l ...
随机推荐
- Seata 核心源码详解
参考文章: 分布式事务实战方案汇总 https://www.cnblogs.com/yizhiamumu/p/16625677.html 分布式事务原理及解决方案案例https://www.cnblo ...
- GRLSTM: 基于图的残差LSTM轨迹相似性计算《GRLSTM: Trajectory Similarity Computation with Graph-Based Residual LSTM》(轨迹路网融合、知识图谱嵌入、图神经网络、残差网络、点融合图、多头图注意力网络GAT、残差LSTM、点感知损失函数(图的点损失函数、轨迹的点损失函数))
2023年10月18日,14:14. 来不及了,这一篇还是看的翻译. 论文:GRLSTM: Trajectory Similarity Computation with Graph-Based Res ...
- SQL Server 语句日期格式查找方法
1. SQL Server中,处理日期格式和查找特定日期格式方法示例 在SQL Server中,处理日期格式和查找特定日期格式的记录是一个常见的需求.SQL Server提供了多种函数和格式选项来处理 ...
- EF Core – Temporal Table 时态表
前言 EF core 6.0 开始有 build-in 的 Temporal Table 支持了. 关于 SQL Server Temporal Table 可以看这篇. 主要参考 What's Ne ...
- 系统编程-进程-vfork使用、浅析
1. 先贴代码 #include <stdio.h> #include <stdlib.h> #include <unistd.h> int globvar = 6 ...
- 系统编程-进程-close-on-exec机制
我的相关博文: 系统编程-进程-exec系列函数超级详解(带各种实操代码) 一般我们会调用exec执行另一个程序,此时会用全新的程序替换子进程的正文,数据,堆和栈等. 此时保存文件描述符的变量当然也不 ...
- 采集数据产品描述有超链接///设置免运费后,达到免送标准,其他运费不显示///给产品详情页面的图片点击放大是个模态窗///在shop页面有重复的产品展示,去重
//产品描述有超链接,去掉 function remove_product_hyperlinks($content) { if (is_product()) { // 确保只在产品页面上应用 $con ...
- VMware Vsphere 8.0 ESXI 主机部署
一. VMware vSphere 8.0新特性 VMware vSphere 8.0是一个全新的版本,引入了许多新功能,其中最主要的新功能包括 1.集中式云控制台 使 IT 管理员能够借助 vSph ...
- Word、Excel办公书的资源下载
我是清华社编辑,下载资源没有版权问题,可供读者个人学习用,但不允许商用. 微信扫描,清华社网盘,可转自己邮箱下载.安全,无风险. <Word/Excel/PPT 2019商务办公从入门到精通&g ...
- USB和CAN都是用差分信号来传输数据,为什么CAN的传输距离能比USB远那么多?
USB和CAN的区别 今天在看USB项目设计实例的时候,突然想到一个问题,从而引发了一些思考.经过思考加上查阅资料,写出了这一篇文章作为记录. 问题 USB和CAN都是用两条线作为差分线以差分信号 ...