highcharts中的仪表盘样式
仪表盘的样式如下:
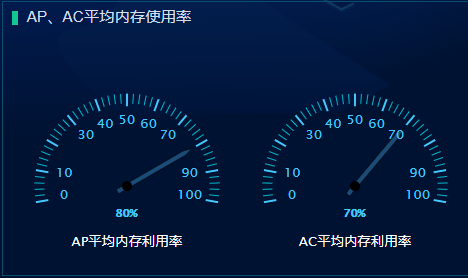
是双表盘展示
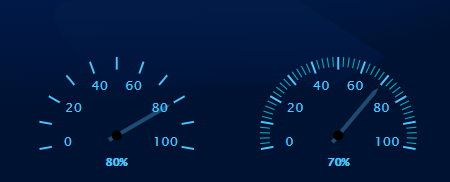
左边的图中minorTickInterval的值为null,右边的minorTickInterval的值为“auto”
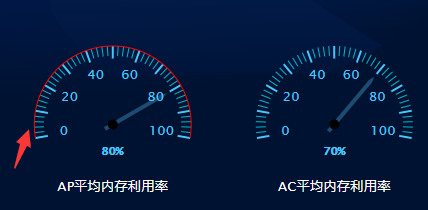
左边的图中lineColor的值为‘#f00’,右边的lineColor的值为“transparent”
yAxis: [{

    min: 0,

    // 最小刻度值

    max: 100,

    // 最大刻度值

    minorTickInterval: 'auto',

    // 表盘中比较短的刻度值

    minorTickWidth: that.torem(2),

    // 表盘中比较短的刻度值的宽度

    minorTickLength: that.torem(20),

    // 表盘中比较短的刻度值的长度

    minorTickPosition: 'inside',

    // 表盘中比较短的刻度值在内部还是在外部显示

    minorTickColor: '#00bfd3',

    // 表盘中比较短的刻度值的颜色

    tickPixelInterval: 'auto',

    // 表盘中比较长的刻度值

    tickWidth: that.torem(4),

    // 表盘中比较长的刻度值的宽度

    tickPosition: 'inside',

    // 表盘中比较长的刻度值在内部还是在外部显示

    tickLength: that.torem(26),

    // 表盘中比较长的刻度值的长度

    tickColor: '#48c7ff',

    // 表盘中比较长的刻度值的颜色

    tickInterval: 10,

    // 间隔

    lineColor: 'transparent',

    // 表盘最外层的连接线

}]
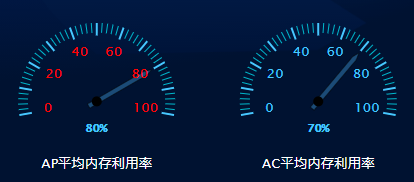
labels: {

    style: { // 刻度值数字的样式

        color: '#f00',

        fontSize: that.torem(28)

        // step: 20

    },

    distance: that.offetY

},
y轴的一些设置
yAxis: [{

    min: 0,

    // 最小刻度值

    max: 100,

    // 最大刻度值

    minorTickInterval: 'auto',

    // 表盘中比较短的刻度值

    minorTickWidth: that.torem(2),

    // 表盘中比较短的刻度值的宽度

    minorTickLength: that.torem(20),

    // 表盘中比较短的刻度值的长度

    minorTickPosition: 'inside',

    // 表盘中比较短的刻度值在内部还是在外部显示

    minorTickColor: '#00bfd3',

    // 表盘中比较短的刻度值的颜色

    tickPixelInterval: 'auto',

    // 表盘中比较长的刻度值

    tickWidth: that.torem(4),

    // 表盘中比较长的刻度值的宽度

    tickPosition: 'inside',

    // 表盘中比较长的刻度值在内部还是在外部显示

    tickLength: that.torem(26),

    // 表盘中比较长的刻度值的长度

    tickColor: '#48c7ff',

    // 表盘中比较长的刻度值的颜色

    tickInterval: 10,

    // 间隔

    lineColor: 'transparent',

    // 表盘最外层的连接线

    labels: {

        style: { // 刻度值数字的颜色

            color: '#48c7ff',

            fontSize: that.torem(28)

            // step: 20

        },

        distance: that.offetY

    },

    pane: 0,

    // 第一个面板,第二个面板是1

    title: { // 描述文字

        text: this.text1,

        verticalAlign: 'bottom',

        style: {

            color: '#fff',

            fontSize: that.torem(28)

        },

        y: that.torem(220) // 离y轴的距离

    }

}, {

    min: 0,

    max: 100,

    minorTickInterval: 'auto',

    minorTickWidth: that.torem(2),

    minorTickLength: that.torem(20),

    minorTickPosition: 'inside',

    minorTickColor: '#00bfd3',

    tickPixelInterval: 30,

    tickWidth: that.torem(4),

    tickPosition: 'inside',

    tickLength: that.torem(26),

    tickColor: '#48c7ff',

    tickInterval: 10,

    // 间隔

    tickmarkPlacement: 'on',

    lineColor: 'transparent',

    labels: {

        style: {

            color: '#48c7ff',

            fontSize: that.torem(28)

        },

        distance: that.offetY

    },

    pane: 1,

    title: {

        text: this.text2,

        verticalAlign: 'bottom',

        style: {

            color: '#fff',

            fontSize: that.torem(28)

        },

        y: that.torem(220)

    }

}],
指针以及表盘内百分比的显示的设置
plotOptions: {

    gauge: {

        dataLabels: {

            borderWidth: 0,

            enabled: true,

            color: '#48c7ff',

            fontSize: that.torem(80),

            format: ` <span> {y} % </span>`

        },

        dial: {

            radius: '80%', // 半径:指针长度

            backgroundColor: '#1b4b77',

            //指针背景色

            borderColor: 'black',

            borderWidth: that.torem(1),

            baseWidth: that.torem(10),

            topWidth: that.torem(1),

            baseLength: '90%',

            // of radius

            rearLength: '15%' //尾巴长度

        },

        borderWidth: 0

    }

},
指针中的百分比值,也就是y轴的初始刻度值
series: [{// 第一个表盘对应的数据

    data: [80],

    yAxis: 0

}, {// 第二个表盘对应的数据

    data: [70],

    yAxis: 1

}]
完整的代码
<template>

  <div class="highcharts-container" ref="chart_gauge"></div>

</template>

<script>

import Highcharts from 'highcharts/highstock';

import HighchartsMore from 'highcharts/highcharts-more';

import HighchartsDrilldown from 'highcharts/modules/drilldown';

import Highcharts3D from 'highcharts/highcharts-3d';

HighchartsMore(Highcharts);

HighchartsDrilldown(Highcharts);

Highcharts3D(Highcharts);

import { font } from '@/mixins';

export default {

    props: ['name', 'title'],

    name: 'highcharts',

    mixins: [font],

    data() {

        return {

            chart1: null,

            data_terminal: [

                {

                    name: '华为',

                    y: 21.9

                },

                {

                    name: '苹果',

                    y: 14.9

                },

                {

                    name: '三星',

                    y: 15.2

                },

                {

                    name: '小米',

                    y: 25.7

                },

                {

                    name: '其他',

                    y: 35.7

                }

            ],

            data_flow: [

                {

                    name: '热点1',

                    y: 21.9

                },

                {

                    name: '热点2',

                    y: 14.9

                },

                {

                    name: '热点3',

                    y: 15.2

                },

                {

                    name: '热点4',

                    y: 25.7

                },

                {

                    name: '其他',

                    y: 35.7

                }

            ],

            options: null,

            chartTitle: '',

            text1: null,

            text2: null,

            standSize: document.body.clientWidth,

            offetY: 0

        };

    },

    watch: {

        standSize: {

            handler(newVal, oldVal) {

                if (newVal == 4000) {

                    this.offetY = this.torem(-70);

                } else {

                    this.offetY = this.torem(-60);

                }

            },

            deep: true,

            immediate: true

        }

    },

    mounted() {

        var that = this;

        that.$el.style.height = that.$refs.chart_gauge.offsetHeight - that.torem(100) + 'px';

        console.log(this.$refs.chart_gauge.offsetHeight, 'qq');

        switch (that.title) {

            case 'cpu':

                that.text1 = 'AP平均cpu利用率';

                that.text2 = 'AC平均cpu利用率';

                break;

            case '内存':

                that.text1 = 'AP平均内存利用率';

                that.text2 = 'AC平均内存利用率';

                break;

        }

        this.options = {

            chart: {

                type: 'gauge',

                backgroundColor: 'transparent'

                // height: that.torem(500)

            },

            title: {

                text: null

            },

            labels: {

                items: [

                    {

                        style: { left: that.torem(180), top: that.torem(280), fontSize: that.torem(42), fontWeight: 'bold', fontFamily: '微软雅黑' }

                        // html: '<span style="color:#C02316">{y}</span>'

                    }

                ]

            },

            pane: [

                // 表盘1设置

                {

                    startAngle: -100, // 表盘开始的角度

                    endAngle: 100, // 表盘结束的角度

                    background: null, // 表盘的背景颜色,为null的话就是不要背景颜色

                    center: ['25%', '65%'], // 表盘的位置

                    size: '80%' // 表盘的大小

                },

                // 表盘2设置

                {

                    startAngle: -100,

                    endAngle: 100,

                    background: null,

                    center: ['75%', '65%'],

                    size: '80%'

                }

            ],

            yAxis: [

                {

                    min: 0, // 最小刻度值

                    max: 100, // 最大刻度值

                    minorTickInterval: 'auto', // 表盘中比较短的刻度值

                    minorTickWidth: that.torem(2), // 表盘中比较短的刻度值的宽度

                    minorTickLength: that.torem(20),// 表盘中比较短的刻度值的长度

                    minorTickPosition: 'inside',// 表盘中比较短的刻度值在内部还是在外部显示

                    minorTickColor: '#00bfd3',// 表盘中比较短的刻度值的颜色

                    tickPixelInterval: 'auto', // 表盘中比较长的刻度值

                    tickWidth: that.torem(4),// 表盘中比较长的刻度值的宽度

                    tickPosition: 'inside',// 表盘中比较长的刻度值在内部还是在外部显示

                    tickLength: that.torem(26),// 表盘中比较长的刻度值的长度

                    tickColor: '#48c7ff',// 表盘中比较长的刻度值的颜色

                    tickInterval: 10, // 间隔

                    lineColor: 'transparent',// 表盘最外层的连接线

                    labels: {

                        style: {// 刻度值数字的颜色

                            color: '#48c7ff',

                            fontSize: that.torem(28)

                            // step: 20

                        },

                        distance: that.offetY

                    },

                    pane: 0, // 第一个面板,第二个面板是1

                    title: { // 描述文字

                        text: this.text1,

                        verticalAlign: 'bottom',

                        style: {

                            color: '#fff',

                            fontSize: that.torem(28)

                        },

                        y: that.torem(220) // 离y轴的距离

                    }

                },

                {

                    min: 0,

                    max: 100,

                    minorTickInterval: 'auto',

                    minorTickWidth: that.torem(2),

                    minorTickLength: that.torem(20),

                    minorTickPosition: 'inside',

                    minorTickColor: '#00bfd3',

                    tickPixelInterval: 30,

                    tickWidth: that.torem(4),

                    tickPosition: 'inside',

                    tickLength: that.torem(26),

                    tickColor: '#48c7ff',

                    tickInterval: 10, // 间隔

                    tickmarkPlacement: 'on',

                    lineColor: 'transparent',

                    labels: {

                        style: {

                            color: '#48c7ff',

                            fontSize: that.torem(28)

                        },

                        distance: that.offetY

                    },

                    pane: 1,

                    title: {

                        text: this.text2,

                        verticalAlign: 'bottom',

                        style: {

                            color: '#fff',

                            fontSize: that.torem(28)

                        },

                        y: that.torem(220)

                    }

                }

            ],

            plotOptions: {

                gauge: {

                    dataLabels: {

                        borderWidth: 0,

                        enabled: true,

                        color: '#48c7ff',

                        fontSize: that.torem(80),

                        format: `<span>{y}%</span>`

                    },

                    dial: {

                        radius: '80%', // 半径:指针长度

                        backgroundColor: '#1b4b77', //指针背景色

                        borderColor: 'black',

                        borderWidth: that.torem(1),

                        baseWidth: that.torem(10),

                        topWidth: that.torem(1),

                        baseLength: '90%', // of radius

                        rearLength: '15%' //尾巴长度

                    },

                    borderWidth: 0

                }

            },

            series: [

                {

                    data: [80],

                    yAxis: 0

                },

                {

                    data: [70],

                    yAxis: 1

                }

            ]

        };

        this.initChart();

    },

    methods: {

        initChart(options) {

            this.chart1 = new Highcharts.Chart(this.$refs.chart_gauge, this.options);

            var title_AP_cpu = {

                text: 'AP平均cpu利用率'

            };

            var title_AC_cpu = {

                text: 'AC平均cpu利用率'

            };

            var title_AP_RAM = {

                text: 'AP平均内存利用率'

            };

            var title_AC_RAM = {

                text: 'AC平均内存利用率'

            };

        }

    }

};

</script>

<style lang="scss">

// .highcharts-container {

// width: 100%;

// height: calc(100% - 30px);

// display: flex;

// & > div {

//     flex: 1;

// }

.highcharts-credits {

    display: none !important;

}

.highcharts-text-outline {

    // 去掉dataLabels的outline

    display: none;

}

.redColor {

    color: #ff6748;

}

.blueColor {

    color: #48c7ff;

}

.greenColor {

    color: #13c792;

}

// }

</style>
highcharts中的仪表盘样式的更多相关文章
- trigger() --工作中问题nav样式
自动执行某元素的某个事件 $("#div").trigger("click"); //让系统自动执行单击事件 适用于nav样式中,下面横线绝对定位于nav.o ...
- JQuery中操作Css样式的方法
JQuery中操作Css样式的方法//1.获取和设置样式 $("#tow").attr("class")获取ID为tow的class属性 $("#tw ...
- Android中自定义checkbox样式
1.首先在drawable文件夹中添加drawable文件checkbox_style.xml.
- ArcGIS中的style样式的使用
MapGIS安装包大小(以M计算)与ArcGIS (以G计算)在数量级存在差异,就可以隐约知道ArcGIS功能的强大.ArcGIS更注重重用(比如符号库.模块等).数据与制图分离(尤其是制图表达最能体 ...
- 在网页中插入CSS样式表的几种方法
1. 链入外部样式表 链入外部样式表是把样式表保存为一个样式表文件,然后在页面中用<link>标记链接到这个样式表文件,这个<link>标记必须放到页面的<head> ...
- html5 中的 css样式单 的 两种调用方式的区别
在 html5 中 使用 css 样式单的方式 有4种: 1.链接外部样式文件:将样式文件 彻底与 html 文档分离,样式文件需要额外引入,这种情况下 一批样式 可以控制多份文档.对于好多文件都共有 ...
- css中的列表样式
在网页设计中,我们经常将某些具有相似功能的标签放在同一组中,这时我们经常会用到列表标签(无序列表ul,有序列表ol),在列表标签中对列表样式的设计可以使我们的页面得到一定程度的美化. 在css中对列表 ...
- css中的字体样式及元素样式
css中的字体样式一般包含有就9中,常见的有7种.这7种依次为: 1.字体样式:font-family: 2.字体大小:font-size: 3.字体加粗:font-weight: 4.字体斜体:fo ...
- Windows Phone 8初学者开发—第13部分:设置LongListSelector中磁贴的样式
原文 Windows Phone 8初学者开发—第13部分:设置LongListSelector中磁贴的样式 第13部分:设置LongListSelector中磁贴的样式 原文地址: http://c ...
- HTML文档中应用css样式的方法总结
在HTML文档中应用css样式大致有三种方法:1.link标签链接外部样式表:2.使用style元素包含样式表:3.使用style属性,即内联样式 一.link标签链接外部样式表 先看一条较为标准的l ...
随机推荐
- 使用 nuxi generate 进行预渲染和部署
title: 使用 nuxi generate 进行预渲染和部署 date: 2024/9/4 updated: 2024/9/4 author: cmdragon excerpt: 通过 nuxi ...
- 如果nacos注册中心挂了怎么办
当服务异常宕机,Nacos还未反应过来时,可能会发生的状况以及现有的解决方案. Nacos的健康检查 故事还要从Nacos对服务实例的健康检查说起. Nacos目前支持临时实例使用心跳上报方式维持活性 ...
- numpy argsort排序如何让其稳定排序
numpy.argsort(a, axis=-1, kind=None, order=None) Parameters: aarray_like Array to sort. axis int or ...
- Amaze UI框架的图标
1 <!DOCTYPE html> 2 <html lang="en"> 3 <head> 4 <meta charset="U ...
- Spring事务传播机制(最全示例)
我们在使用Spring框架进行开发时,经常在service层写很多方法,而且这些方法都是带事务的,那么Spring的事务怎么在多个方法之间传播呢?今天我们就仔细聊一聊. Spring的事务传播机制主要 ...
- Java Web 拾遗
许是年纪大了,老是回忆起以前的点点滴滴.翻看当初的代码,如同偶遇多年未见的前女友,曾经一起深入交流的情谊在颔首之间消散,令人烦躁. 今天就来聊聊老生常谈的 Java Web 开发.缘于一个简单的Spr ...
- Codeforces Round 973 (Div. 2) C
#include <bits/stdc++.h> using namespace std; int T; int n; struct edge { int pre; int nxt; in ...
- Readme3.0 Final
Download Using 解压后放于不明显的地方 打开Devc++,点击 工具 > 编译选项 > 目录,在 C包含文件 与 C++包含文件 中复制完整路径并添加 选中刚添加的路径后,点 ...
- C语言数据类型、变量的输入和输出、进制转换
scanf标准函数可以从键盘得到数字并记录到存储区里,为了使用这个标准函数需要包含stdio.h这个头文件 在scanf函数调用语句里应该使用存储区的地址表示存储区:双引号里使用占位符表示存储区的类型 ...
- MySQL笔记--数据库定时备份与恢复
利用crontab定时.利用mysqldump备份 编写sh启动脚本时记得赋予执行权限(x) 如果没有mysqldump命令执行,基于centos7 yum -y install mysql-clie ...