
ps查看和调整优先级
主题ps查看和调整优先级
一查看优先级
nice值越大优先级越低
[root@centos72 ~]# ps axo  pid,cmd,ni |  head

   PID CMD                          NI

     1 /usr/lib/systemd/systemd --   0

     2 [kthreadd]                    0

     3 [ksoftirqd/0]                 0

     5 [kworker/0:0H]              -20

     7 [migration/0]                 -

     8 [rcu_bh]                      0

     9 [rcu_sched]                   0

    10 [lru-add-drain]             -20

    11 [watchdog/0]                  -

[root@centos72 ~]# ps axo  pid,cmd,ni |   tail

  8406 [kworker/1:1]                 0

  8457 sshd: root@pts/3              0

  8465 -bash                         0

  8485 dd if=/dev/zero of=/dev/nul   0

  8573 [kworker/1:1H]              -20

 10541 [kworker/0:2]                 0

 11025 [kworker/0:1]                 0

 11295 [kworker/0:0]                 0

 11297 ps axo pid,cmd,ni             0

 11298 tail
开启一个进程
[root@centos72 ~]#  ping  -f  127.0.0.1

PING 127.0.0.1 (127.0.0.1) 56(84) bytes of data.

^C

--- 127.0.0.1 ping statistics ---

4860967 packets transmitted, 4860967 received, 0% packet loss, time 44792ms

rtt min/avg/max/mdev = 0.001/0.003/14.741/0.028 ms, pipe 2, ipg/ewma 0.009/0.009 ms
按照CPU进行排序,CPU占用过高
[root@centos72 ~]# ps axo  pid,cmd,ni,%cpu   k  %cpu  | tail

  1142 -bash                         0  0.0

  1230 [kworker/0:1]                 0  0.0

  1253 [kworker/0:2]                 0  0.0

  1255 sshd: root@pts/1              0  0.0

  1259 -bash                         0  0.0

  1338 ps axo pid,cmd,ni,%cpu k %c   0  0.0

  1339 tail                          0  0.0

  1294 [kworker/0:0]                 0  0.1

   906 sshd: root@pts/0              0  0.2

  1283 ping -f 127.0.0.1             0 95.9
二调整优先级
注意此时进程正在运行
[root@centos72 ~]# ps axo  pid,cmd,ni,%cpu   k  %cpu  |  grep  ping

  1355 grep --color=auto ping        0  0.0

  1283 ping -f 127.0.0.1             0 96.0
[root@centos72 ~]#  renice  -n  -20  1283

1283 (process ID) old priority 0, new priority -20

[root@centos72 ~]# ps axo  pid,cmd,ni,%cpu   k  %cpu  |  grep  ping

  1358 grep --color=auto ping        0  0.0

  1283 ping -f 127.0.0.1           -20 95.8
注意此时进程正在运行
[root@centos72 ~]#  ping  -f  127.0.0.1

PING 127.0.0.1 (127.0.0.1) 56(84) bytes of data.

.^

--- 127.0.0.1 ping statistics ---

7827881 packets transmitted, 7827881 received, 0% packet loss, time 58781ms

rtt min/avg/max/mdev = 0.001/0.002/13.661/0.011 ms, pipe 2, ipg/ewma 0.007/0.006 ms
在执行命令的时候直接调整优先级
使用nice命令指定
[root@centos72 ~]# nice  -n  -5  ping  -f  127.0.0.1

PING 127.0.0.1 (127.0.0.1) 56(84) bytes of data.

^C

--- 127.0.0.1 ping statistics ---

3272228 packets transmitted, 3272228 received, 0% packet loss, time 26347ms

rtt min/avg/max/mdev = 0.001/0.003/8.853/0.015 ms, pipe 2, ipg/ewma 0.008/0.005 ms

[root@centos72 ~]#
[root@centos72 ~]#  ps axo  pid,cmd,ni,%cpu  | grep  ping

  1158 ping -f 127.0.0.1            -5 94.6

  1161 grep --color=auto ping        0  0.0
[root@centos72 ~]# nice  -n  5  ping  -f  127.0.0.1

PING 127.0.0.1 (127.0.0.1) 56(84) bytes of data.
[root@centos72 ~]#  ps axo  pid,cmd,ni,%cpu  | grep  ping

  1162 ping -f 127.0.0.1             5  110

  1164 grep --color=auto ping        0  0.0
优先级高并不一定更快
[root@centos72 ~]#  nice  -n  -11  ping  127.0.0.1

PING 127.0.0.1 (127.0.0.1) 56(84) bytes of data.

64 bytes from 127.0.0.1: icmp_seq=1 ttl=64 time=0.019 ms

64 bytes from 127.0.0.1: icmp_seq=2 ttl=64 time=0.030 ms

64 bytes from 127.0.0.1: icmp_seq=3 ttl=64 time=0.026 ms

^C

--- 127.0.0.1 ping statistics ---

3 packets transmitted, 3 received, 0% packet loss, time 1999ms

rtt min/avg/max/mdev = 0.019/0.025/0.030/0.004 ms

[root@centos72 ~]# ping  127.0.0.1

PING 127.0.0.1 (127.0.0.1) 56(84) bytes of data.

64 bytes from 127.0.0.1: icmp_seq=1 ttl=64 time=0.028 ms

64 bytes from 127.0.0.1: icmp_seq=2 ttl=64 time=0.027 ms

64 bytes from 127.0.0.1: icmp_seq=3 ttl=64 time=0.022 ms

64 bytes from 127.0.0.1: icmp_seq=4 ttl=64 time=0.023 ms

64 bytes from 127.0.0.1: icmp_seq=5 ttl=64 time=0.023 ms

^C

--- 127.0.0.1 ping statistics ---

5 packets transmitted, 5 received, 0% packet loss, time 3999ms

rtt min/avg/max/mdev = 0.022/0.024/0.028/0.006 ms
三注意事项——优先级之间的关系
(一)ni: nice值的优先级和pri优先级是相反的
nice值的优先级越高,那么对应的pri优先级越低
[root@centos72 ~]#  ps axo  pid,cmd,ni,%cpu,pri   | grep ping

  1283 ping -f 127.0.0.1           -20 96.2  39

  1360 grep --color=auto ping        0  0.0
[root@centos72 ~]#  ps axo  pid,cmd,ni,%cpu,pri  |  tail

  1099 [kworker/0:1]                 0  0.0  19

  1101 sshd: root@pts/2              0  0.7  19

  1105 -bash                         0  0.0  19

  1143 [kworker/1:1]                 0  0.0  19

  1159 [kworker/1:2]                 0  0.0  19

  1165 [kworker/0:0]                 0  0.0  19

  1183 [kworker/0:2]                 0  0.0  19

  1184 [kworker/1:0]                 0  0.0  19

  1190 ps axo pid,cmd,ni,%cpu,pri    0  0.0  19

  1191 -bash                         0  0.0
[root@centos72 ~]#  nice  -n  10  ping  127.0.0.1

PING 127.0.0.1 (127.0.0.1) 56(84) bytes of data.

64 bytes from 127.0.0.1: icmp_seq=1 ttl=64 time=0.025 ms

64 bytes from 127.0.0.1: icmp_seq=2 ttl=64 time=0.023 ms

64 bytes from 127.0.0.1: icmp_seq=3 ttl=64 time=0.027 ms

64 bytes from 127.0.0.1: icmp_seq=4 ttl=64 time=0.026 ms

64 bytes from 127.0.0.1: icmp_seq=5 ttl=64 time=0.026 ms

64 bytes from 127.0.0.1: icmp_seq=6 ttl=64 time=0.027 ms

64 bytes from 127.0.0.1: icmp_seq=7 ttl=64 time=0.026 ms

64 bytes from 127.0.0.1: icmp_seq=8 ttl=64 time=0.057 ms

64 bytes from 127.0.0.1: icmp_seq=9 ttl=64 time=0.023 ms

64 bytes from 127.0.0.1: icmp_seq=10 ttl=64 time=0.025 ms

64 bytes from 127.0.0.1: icmp_seq=11 ttl=64 time=0.024 ms

64 bytes from 127.0.0.1: icmp_seq=12 ttl=64 time=0.026 ms

64 bytes from 127.0.0.1: icmp_seq=13 ttl=64 time=0.024 ms

64 bytes from 127.0.0.1: icmp_seq=14 ttl=64 time=0.037 ms

64 bytes from 127.0.0.1: icmp_seq=15 ttl=64 time=0.023 ms

^C

--- 127.0.0.1 ping statistics ---

15 packets transmitted, 15 received, 0% packet loss, time 14000ms

rtt min/avg/max/mdev = 0.023/0.027/0.057/0.011 ms

[root@centos72 ~]#  ps axo  pid,cmd,ni,%cpu,pri  |  tail

  1101 sshd: root@pts/2              0  0.7  19

  1105 -bash                         0  0.0  19

  1143 [kworker/1:1]                 0  0.0  19

  1159 [kworker/1:2]                 0  0.0  19

  1165 [kworker/0:0]                 0  0.0  19

  1183 [kworker/0:2]                 0  0.0  19

  1184 [kworker/1:0]                 0  0.0  19

  1192 ping 127.0.0.1               10  0.0   9

  1193 ps axo pid,cmd,ni,%cpu,pri    0  0.0  19

  1194 tail                          0  0.0
[root@centos72 ~]#  nice  -n  -10  ping  127.0.0.1

PING 127.0.0.1 (127.0.0.1) 56(84) bytes of data.

64 bytes from 127.0.0.1: icmp_seq=1 ttl=64 time=0.021 ms

64 bytes from 127.0.0.1: icmp_seq=2 ttl=64 time=0.028 ms

64 bytes from 127.0.0.1: icmp_seq=3 ttl=64 time=0.027 ms

64 bytes from 127.0.0.1: icmp_seq=4 ttl=64 time=0.023 ms

64 bytes from 127.0.0.1: icmp_seq=5 ttl=64 time=0.023 ms

64 bytes from 127.0.0.1: icmp_seq=6 ttl=64 time=0.023 ms

^C

--- 127.0.0.1 ping statistics ---

6 packets transmitted, 6 received, 0% packet loss, time 4999ms

rtt min/avg/max/mdev = 0.021/0.024/0.028/0.003 ms
[root@centos72 ~]#  ps axo  pid,cmd,ni,%cpu,pri  |  tail

  1101 sshd: root@pts/2              0  0.6  19

  1105 -bash                         0  0.0  19

  1143 [kworker/1:1]                 0  0.0  19

  1159 [kworker/1:2]                 0  0.0  19

  1165 [kworker/0:0]                 0  0.0  19

  1183 [kworker/0:2]                 0  0.0  19

  1184 [kworker/1:0]                 0  0.0  19

  1195 ping 127.0.0.1              -10  0.0  29

  1196 ps axo pid,cmd,ni,%cpu,pri    0  0.0  19

  1197 tail                          0  0.0
注意帮助文档的此说明并不准确
[root@centos72 ~]# man  ps  | grep  PRI

       pri         PRI       priority of the process.  Higher number means lower priority.

       rtprio      RTPRIO    realtime priority.
数字越大优先级越高
所以帮助文档是有一定的bug的,不要迷信权威
[root@centos72 ~]# ps -C  ping  o   pid,cmd,ni,%cpu,pri

   PID CMD                          NI %CPU PRI

  1246 ping 127.0.0.1               10  0.0   9

  1248 ping 127.0.0.1              -10  0.0
在6上没有PRI的相关说明
[root@centos65 ~]# man  ps  | grep  PRI

rtprio     RTPRIO   realtime priority.
(二)pri的优先级的值和早期系统优先级相反
也就是从139到0,早期的系统优先级是从0到139
所以pri的值越大优先级越高
[root@centos72 ~]#  nice  -n  30  ping  127.0.0.1

[root@centos72 ~]#  ps axo  pid,cmd,ni,%cpu,pri  |  tail

  1058 ping 8.8.8.8                  0  0.0  19

  1059 sshd: root@pts/1              0  0.1  19

  1063 -bash                         0  0.0  19

  1086 sshd: root@pts/2              0  0.6  19

  1090 -bash                         0  0.0  19

  1110 [kworker/1:1]                 0  0.0  19

  1113 [kworker/0:0]                 0  0.0  19

  1114 ping 127.0.0.1               19  0.0   0

  1118 ps axo pid,cmd,ni,%cpu,pri    0  0.0  19

  1119 tail                          0  0.0
(三)实时优先级rtprio和nice优先级关系
从下图可以看出实时优先级和nice优先级对应系统优先级的一部分,实时优先级和nice优先级是没有交集的
ncie优先级又被称为动态优先级,比如占用的内存太多了就会自动的把优先级调小。
实时优先级是静态的优先级,指定好了就固定不变了。
调整实时优先级使用chrt
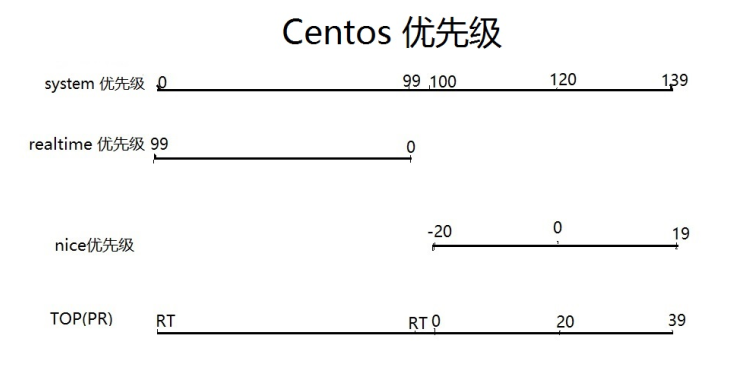
rtprio: 实时优先级
因为nice优先级不对应任何的实时优先级,所以无法显示实时优先级
[root@centos72 ~]#  nice  -n  -20 ping  127.0.0.1

PING 127.0.0.1 (127.0.0.1) 56(84) bytes of data.

64 bytes from 127.0.0.1: icmp_seq=1 ttl=64 time=0.034 ms

64 bytes from 127.0.0.1: icmp_seq=2 ttl=64 time=0.026 ms

64 bytes from 127.0.0.1: icmp_seq=3 ttl=64 time=0.022 ms

^C

--- 127.0.0.1 ping statistics ---

3 packets transmitted, 3 received, 0% packet loss, time 2000ms

rtt min/avg/max/mdev = 0.022/0.027/0.034/0.006 ms
[root@centos72 ~]#  ps  -C  ping  o   pid,cmd,ni,%cpu,pri,rtprio  |  tail

   PID CMD                          NI %CPU PRI RTPRIO

  1260 ping 127.0.0.1              -20  0.0  39      -
7 [migration/0] - 0.0 139 99中139是最高的优先级,值越大优先级越高,
因为是pri优先级,和系统优先级是相反的
[root@centos72 ~]#  ps  axo   pid,cmd,ni,%cpu,pri,rtprio  |  head

   PID CMD                          NI %CPU PRI RTPRIO

     1 /usr/lib/systemd/systemd --   0  0.0  19      -

     2 [kthreadd]                    0  0.0  19      -

     3 [ksoftirqd/0]                 0  0.0  19      -

     5 [kworker/0:0H]              -20  0.0  39      -

     6 [kworker/u256:0]              0  0.0  19      -

     7 [migration/0]                 -  0.0 139     99

     8 [rcu_bh]                      0  0.0  19      -

     9 [rcu_sched]                   0  0.0  19      -

    10 [lru-add-drain]             -20  0.0  39      -
看门狗监控内核状态的,最高优先级
就像国家的安全部分监控其他部门,比如明朝的锦衣卫
[root@centos72 ~]#  ps  axo   pid,cmd,ni,%cpu,pri,rtprio  |  grep  watch

    11 [watchdog/0]                  -  0.0 139     99

    12 [watchdog/1]                  -  0.0 139     99

  1272 grep --color=auto watch       0  0.0  19      -
ps查看和调整优先级的更多相关文章
- linux ps查看进程命令
linux ps查看进程命令ps命令作用:将某个时间点的程序运作情况撷取下来 实例: [root@linux ~]# ps aux [root@linux ~]# ps -lA [root@linux ...
- 【Linux】常用指令、ps查看进程、kill杀进程、启动停止tomcat命令、查看日志、查看端口、find查找文件
1.说出 10 个 linux 常用的指令 1) ls 查看目录中的文件 2)cd /home 进入 '/ home' 目录:cd .. 返回上一级目录:cd ../.. 返回上两级目录 3)mkdi ...
- Java如何查看线程的优先级?
Java编程中,如何查看线程的优先级? 以下示例演示如何使用Thread类的getPriority()方法检查线程的优先级. package com.yiibai; public class Thre ...
- Linux常用指令---ps(查看进程)
Linux中的ps命令是Process Status的缩写.ps命令用来列出系统中当前运行的那些进程.ps命令列出的是当前那些进程的快照,就是执行ps命令的那个时刻的那些进程,如果想要动态的显示进程信 ...
- linux ps查看进程命令详解
http://linux.net527.cn/Linuxwendang/xitongguanliyuan/39094.htmlLinux操作系统PS命令详细解析 要对系统中进程进行监测控制,用 ps ...
- ps查看进程
ps:要对进程进行监测和控制,首先必须要了解当前进程的情况,也就是需要查看当前进程,而ps命令就是最基本同时也是非常强大的进程查看命令.使用该命令可以确定有哪些进程正在运行和运行的状态.进程是否结束. ...
- Linux ps 查看进程
[root@wang /]# ps aux ps -elf ^C [root@wang /]# ps aux USER PID %CPU %MEM VSZ RSS TTY STAT START TIM ...
- Linux:PS查看进程信息,和查看tomcat内存等信息
版权声明:本文为博主原创文章,遵循CC 4.0 BY-SA版权协议,转载请附上原文出处链接和本声明. 本文链接:https://blog.csdn.net/fly910905/article/deta ...
- 用ps 查看线程状态
ps -eLo pid,tid,class,rtprio,ni,pri,psr,pcpu,pmem,stat,wchan:30,comm 线程相关选项: THREAD DISPLAY H Show t ...
随机推荐
- 一分钟小知识:scroll-behavior 让你的页面导航滚动更丝滑~
中午在[掘金]潜水摸鱼,看到这一个沸点,个人已经撸出特效: 下面放上 作者 的 掘金 地址 #掘金沸点# https://juejin.im/pin/5d649eaaf265da19752533d ...
- 企业打开云HBase的正确方式,来自阿里云云数据库团队的解读
一.HBase的历史由来 HBase是一个开源的非关系型分布式数据库(NoSQL),基于谷歌的BigTable建模,是一个高可靠性.高性能.高伸缩的分布式存储系统,使用HBase技术可在廉价PC Se ...
- HTTP返回码中200,302,304,404,500得意思
状态码的职责是当客户端向服务器端发送请求时,描述返回请求结果.借助状态码,用户可以知道服务器端是正常处理了请求,还是出现了什么错误. 2开头的,响应成功,客户端请求服务器正常响应处理了. 3开头的,响 ...
- linux配置防火墙 Centos7下 添加 端口白名单
最近在阿里云服务器centos7上部署项目 要开启8484端口 , CentOS 7默认使用的是firewall作为防火墙 在firewall下开启端口白名单 1.查看下防火墙的状态:systemct ...
- CentOS7 图形化方式安装Oracle 18c 安装配置
下载 Oracle 数据库,zip 包 https://www.oracle.com/technetwork/database/enterprise-edition/downloads/index.h ...
- Python 进阶_OOP 面向对象编程_组合与继承
#目录 前言 组合 派生 通过继承来覆盖重载方法 最常用的重载场景实例方法的重载 从标准类中派生类方法的重载 前言 我们定义一个类是希望能够把类当成模块来使用,并把类嵌入到我们的应用代码中,与其他的数 ...
- 用 Flask 来写个轻博客 (18) — 使用工厂模式来生成应用对象
Blog 项目源码:https://github.com/JmilkFan/JmilkFan-s-Blog 目录 目录 前文列表 工厂模式 使用工厂方法 Factory Method 创建 app 对 ...
- js 判断对象的长度
Object.size = function(obj) { var size = 0, key; for (key in obj) { if (obj.hasOwnProperty(key)) siz ...
- printf输出各种类型,cout控制输出各式
; char c = 'A'; int *p = &a; char *st = "ahj"; float x = 3.1415926; cout << & ...
- Python笔记(八)_内部函数与闭包
内部函数 在函数内部定义另一个函数,也就是函数的嵌套 在外部函数的作用域内,外部函数可以随意调用内部函数 由于内部函数的整个定义过程都在外部函数中,所以出了外部函数就无法再被调用了 def outsi ...