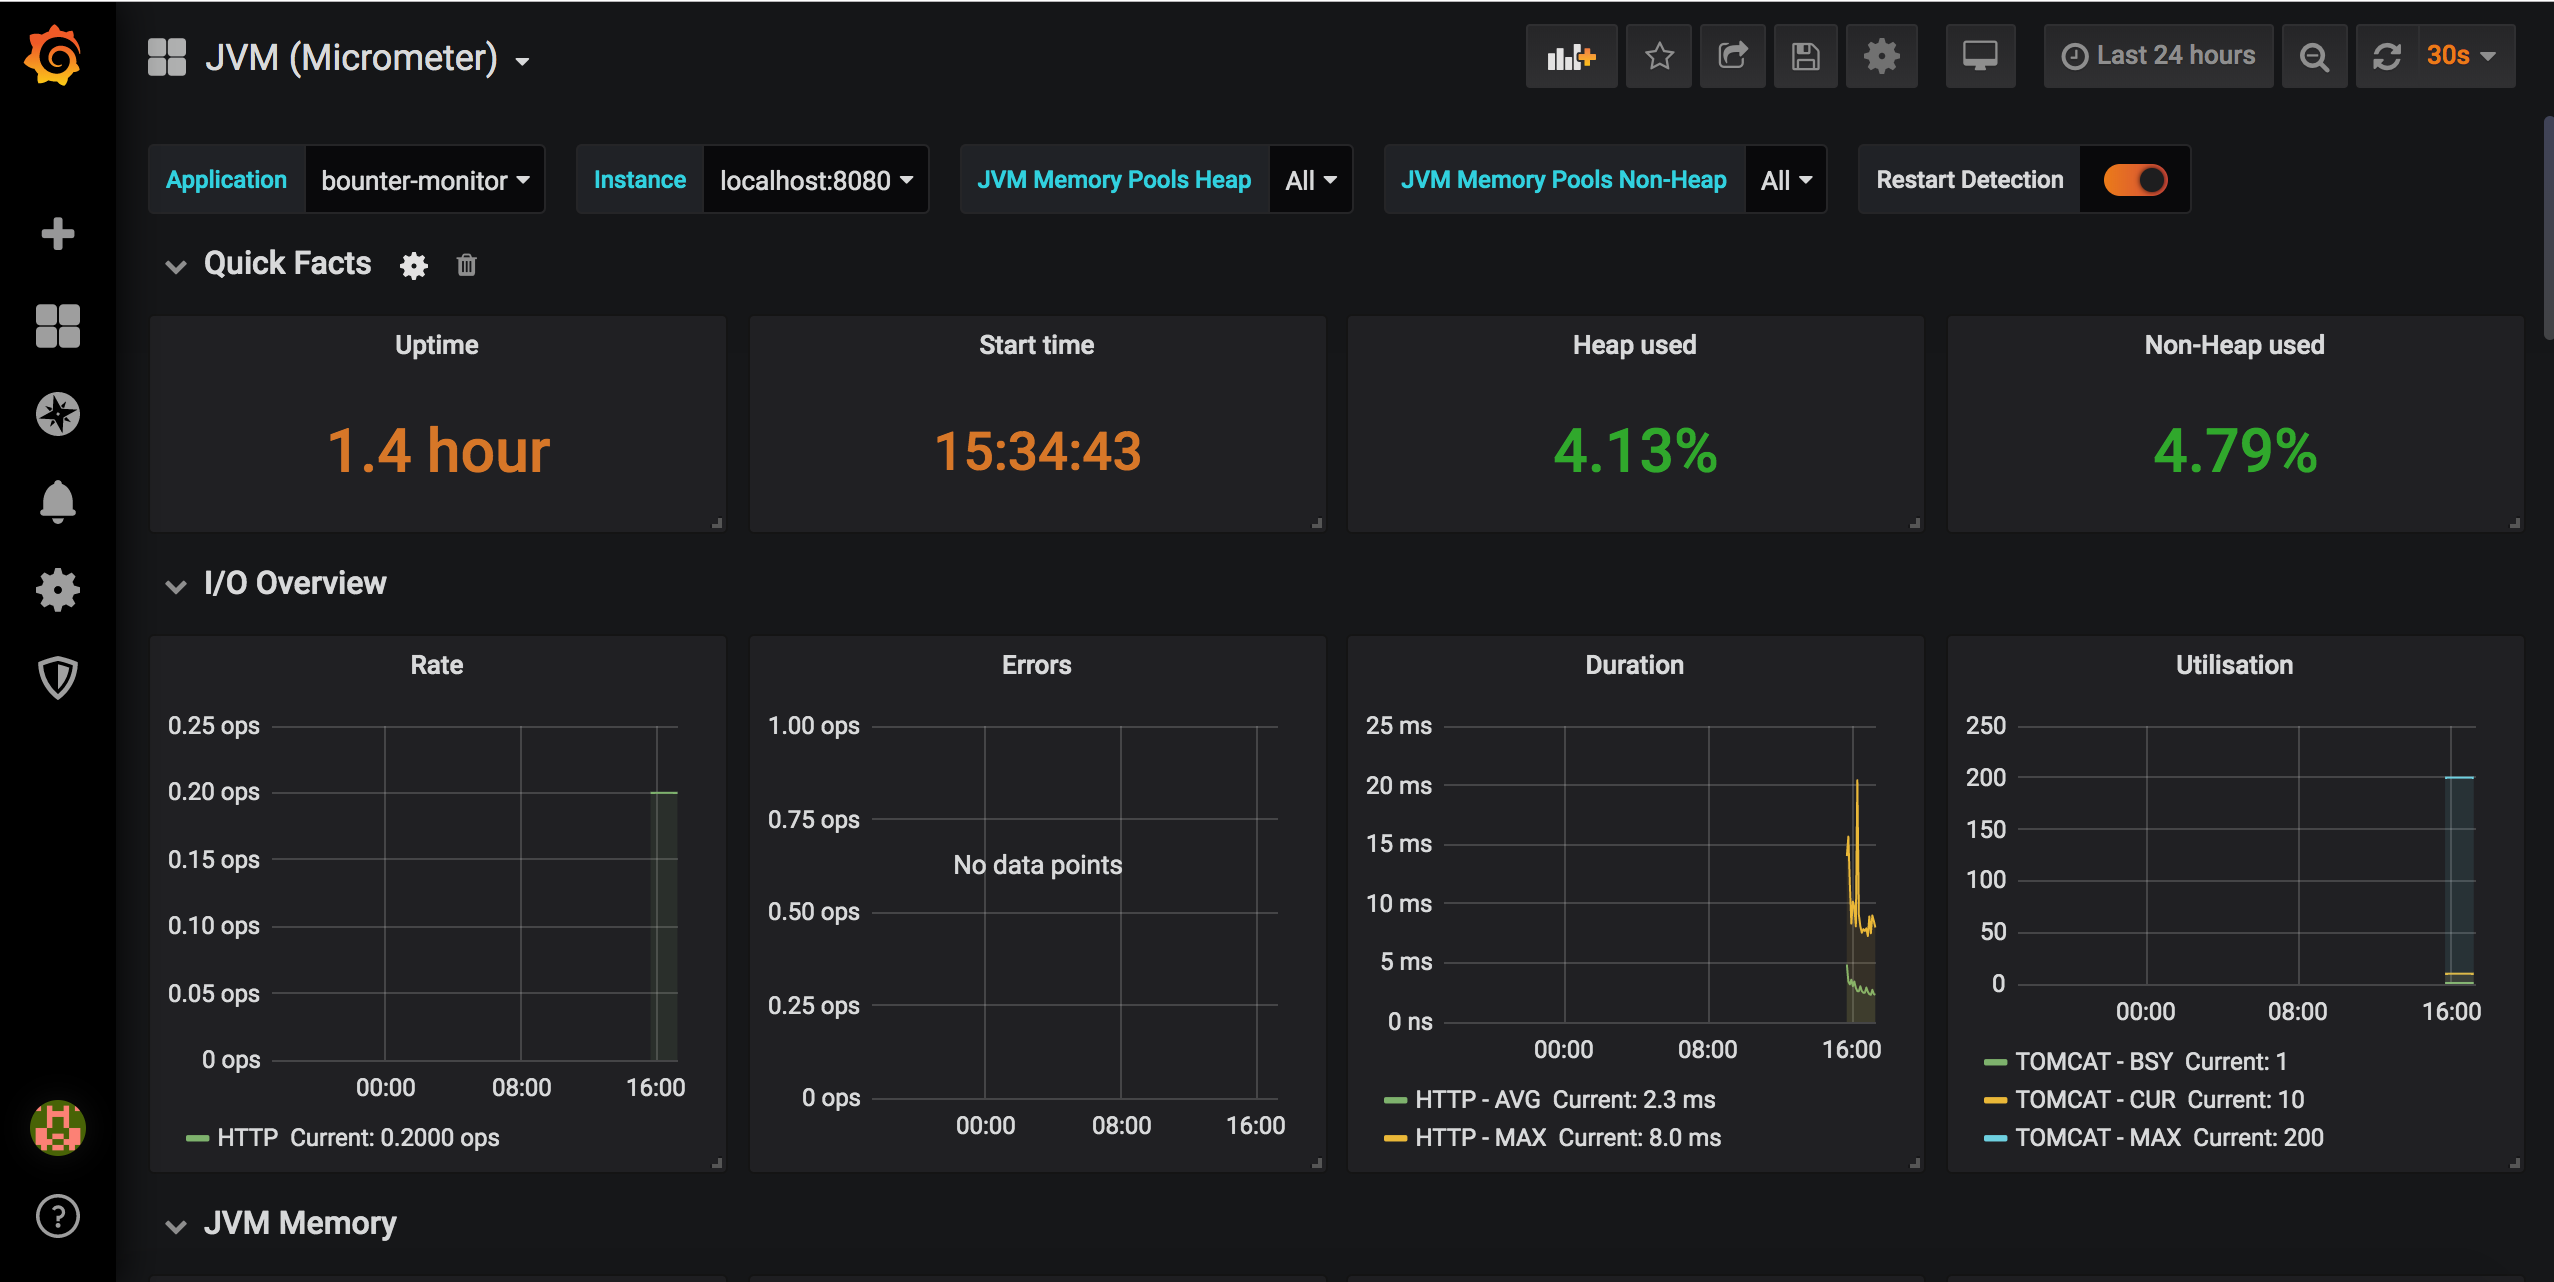
Prometheus + Grafana 监控SpringBoot应用
- 官网下载prometheus-2.9.1.linux-amd64.tar.gz并解压
<!--监控 begin-->

<dependency>

   <groupId>org.springframework.boot</groupId>

   <artifactId>spring-boot-starter-actuator</artifactId>

</dependency>

<!--Micrometer-->

<dependency>

   <groupId>io.micrometer</groupId>

   <artifactId>micrometer-registry-prometheus</artifactId>

</dependency>

<!--监控 end-->
2. 配置监控
spring.application.name=bounter-monitor

## 暴露所有的actuator endpoints

management.endpoints.web.exposure.include=*

## Grafana上的应用名字

management.metrics.tags.application=${spring.application.name}
  # SpringBoot Application

  - job_name: 'bounter-monitor'

    scrape_interval: 5s

    metrics_path: '/actuator/prometheus'

    static_configs:

      - targets: ['localhost:8080']
Prometheus + Grafana 监控SpringBoot应用的更多相关文章
- 【Springboot】用Prometheus+Grafana监控Springboot应用
1 简介 项目越做越发觉得,任何一个系统上线,运维监控都太重要了.关于Springboot微服务的监控,之前写过[Springboot]用Springboot Admin监控你的微服务应用,这个方案可 ...
- Prometheus+Grafana监控SpringBoot
Prometheus+Grafana监控SpringBoot 一.Prometheus监控SpringBoot 1.1 pom.xml添加依赖 1.2 修改application.yml配置文件 1. ...
- 基于Docker+Prometheus+Grafana监控SpringBoot健康信息
在微服务体系当中,监控是必不可少的.当系统环境超过指定的阀值以后,需要提醒指定的运维人员或开发人员进行有效的防范,从而降低系统宕机的风险.在CNCF云计算平台中,Prometheus+Grafana是 ...
- cAdvisor+Prometheus+Grafana监控docker
cAdvisor+Prometheus+Grafana监控docker 一.cAdvisor(需要监控的主机都要安装) 官方地址:https://github.com/google/cadvisor ...
- [转帖]Prometheus+Grafana监控Kubernetes
原博客的位置: https://blog.csdn.net/shenhonglei1234/article/details/80503353 感谢原作者 这里记录一下自己试验过程中遇到的问题: . 自 ...
- prometheus+grafana监控redis
prometheus+grafana监控redis redis安装配置 https://www.cnblogs.com/autohome7390/p/6433956.html redis_export ...
- prometheus+grafana监控mysql
prometheus+grafana监控mysql 1.安装配置MySQL官方的 Yum Repository(有mysql只需设置监控账号即可) [root@localhost ~]# wget - ...
- [转帖]安装prometheus+grafana监控mysql redis kubernetes等
安装prometheus+grafana监控mysql redis kubernetes等 https://www.cnblogs.com/sfnz/p/6566951.html plug 的模式进行 ...
- Prometheus + Grafana 监控系统搭
本文主要介绍基于Prometheus + Grafana 监控Linux服务器. 一.Prometheus 概述(略) 与其他监控系统对比 1 Prometheus vs. Zabbix Zabbix ...
随机推荐
- rime 同文输入法 安卓系统
下载安装APP 从google play下载同文输入法 默认安装完只有3个输入法, 没有五笔和拼音 [官网][https://rime.im/download/] 获取五笔拼音方案 然后找到 /sdc ...
- tikz: keep in mind these
don't add % in title, xlabel, ylabel etc., use \%
- SpringBoot 集成mongodb(1)单数据源配置
新项目要用到mongodb,于是在个人电脑上的虚拟环境linux上安装了下mongodb,练习熟悉下. 1.虚拟机上启动mongodb. 首先查看虚拟机ip地址,忘了哈~~ 命令行>ifconf ...
- sklearn版本
10.19.0以前的sklearn版本才有cross_validation包,这个时候不要用model_selection导入StratifiedKFold,要用cross_validation,0. ...
- WPF与DevExpress之——实现类似于安装程序下一步下一步的样式窗体
话不多说先上图 点击下一步 跳转到第二页 项目准备: 1.DevExpress 19/18/17(三个版本都可以) 2.Vs2019 3..Net framework>4.0 项目结构: ...
- 转:高效实用的.NET开源项目
本文转自:http://www.cnblogs.com/pengze0902/p/7669631.html 似乎...很久很久没有写博客了,一直都想写两篇,但是却没有时间写.感觉最近有很多事情需要处理 ...
- jmeter逻辑控制详解(1)
逻辑控制器 Jmeter提供了多种逻辑控制器,下面进行讲解说明: 1.Simple Controller 简单控制器是最基本的控制器,对jmeter测试运行没有任何影响,可以将某些请求归集在一个简单控 ...
- GARENA面试
约了2019年10月16日下午2点现场面 岗位:数据开发 下午2点准时到了公司,公司环境棒棒哒,hr小姐姐也是贴心,整个面试的过程真的棒棒哒. 在我所有的面试经历中,这个是体验感最棒的,其次是上中的面 ...
- 关于Vue的理解以及与React框架的对比
1.Vue的理解 概念: Vue是一套用于构建用户界面的渐进式框架: Vue的核心库只关注视图层: 是一个数据驱动的MVVM框架: 特性: 确实轻量:体积比较小: 数据绑定简单.方便: 有一些简单的内 ...
- <<Java RESTful Web Service实战>> 读书笔记
<<Java RESTful Web Service实战>> 读书笔记 第一章 JAX-RS2.0入门 REST (Representational State ransf ...