ELK集群部署实例(转)
转载自:http://blog.51cto.com/ckl893/1772287,感谢原博。
一、ELK说明
二、架构图
三、规划说明
四、安装部署nginx+logstash
五、安装部署redis
六、安装部署logstash server
七、安装部署elasticsearch集群
八、安装kibana
一、ELK说明
ELK Stack 是 Elasticsearch、Logstash、Kibana 三个开源软件的组合。在实时数据检索和分析场合,三者通常是配合共用,而且又都先后归于 Elastic.co 公司名下,故有此简称。
ELK Stack 在最近两年迅速崛起,成为机器数据分析,或者说实时日志处理领域,开源界的第一选择。和传统的日志处理方案相比,ELK Stack 具有如下几个优点:
处理方式灵活。Elasticsearch 是实时全文索引,不需要像 storm 那样预先编程才能使用;
配置简易上手。Elasticsearch 全部采用 JSON 接口,Logstash 是 Ruby DSL 设计,都是目前业界最通用的配置语法设计;
检索性能高效。虽然每次查询都是实时计算,但是优秀的设计和实现基本可以达到全天数据查询的秒级响应;
集群线性扩展。不管是 Elasticsearch 集群还是 Logstash 集群都是可以线性扩展的;
前端操作炫丽。Kibana 界面上,只需要点击鼠标,就可以完成搜索、聚合功能,生成炫丽的仪表板。
二、架构图
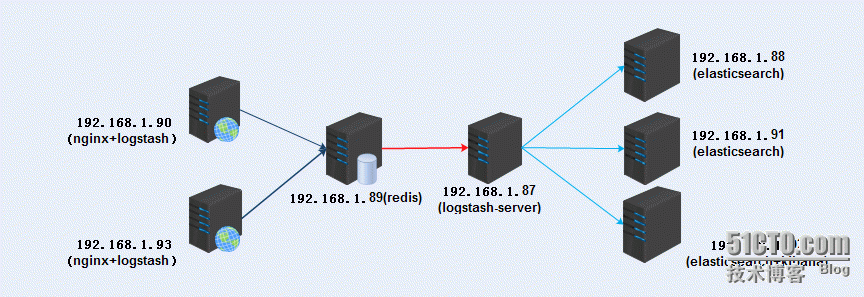
三、规划说明
logstash收集数据:
192.168.1.90(nginx+logstash)
192.168.1.93(nginx+logstash)
redis提供队列:
192.168.1.89(redis)
logstash-server:
192.168.1.87(logstash[server])
elasticsearch集群:
192.168.1.88(elasticsearch)
192.168.1.91(elasticsearch)
192.168.1.92(elasticsearch+kibana)
所有服务器时间同步:
|
1
|
# ntpdate 133.100.11.8 |
软件版本:
|
1
2
3
4
|
jdk-8u91-linux-x64.tar.gzelasticsearch-2.3.2.rpmlogstash-2.3.2-1.noarch.rpmkibana-4.5.0-linux-x64.tar.gz |
四、安装部署nginx+logstash
|
1
2
|
192.168.1.90192.168.1.93 |
以上两个安装配置一样:
4.1.安装zlib
|
1
2
3
4
5
|
tar -xf zlib-1.2.8.tar.gzcd zlib-1.2.8./configuremakemake insatll |
4.2.安装pcre
|
1
2
3
4
5
|
tar -xf pcre-8.37.tar.gz./configurecd pcre-8.37makemake install |
4.3.安装openssl
|
1
2
3
4
|
tar -xf openssl-1.0.2.tar.gz./config --prefix=/usr/local --openssldir=/usr/local/opensslmakemake insatll |
4.4.安装nginx
|
1
2
3
4
5
6
7
8
9
10
11
12
|
tar -xf nginx-1.8.1.tar.gz./configure --prefix=/app/local/nginx \--pid-path=/app/local/nginx \--user=nginx \--group=nginx \--with-threads \--with-file-aio \--with-http_ssl_module \--with-pcre=/tmp/soft/pcre-8.37 \--with-openssl=/tmp/soft/openssl-1.0.2makemake install |
4.5.查看配置文件
|
1
2
3
4
5
6
7
8
9
10
11
12
13
14
15
16
17
18
19
20
21
22
23
24
25
26
27
28
29
30
31
32
33
34
35
36
37
|
vim /app/local/nginx/conf/nginx.confuser nginx;worker_processes 1;error_log logs/error.log notice;pid logs/nginx.pid;events { worker_connections 1024;}http { include mime.types; default_type application/octet-stream; log_format main '$remote_addr - $remote_user [$time_local] "$request" ' '$status $body_bytes_sent "$http_referer" ' '"$http_user_agent" $http_x_forwarded_for $request_length $msec $connection_requests $request_time'; sendfile on; keepalive_timeout 65; server { listen 80; server_name localhost; access_log logs/access.log main; location / { root html; index index.html index.htm; } error_page 500 502 503 504 /50x.html; location = /50x.html { root html; } }} |
4.6.启动nginx
|
1
|
/app/local/nginx/sbin/nginx -c /app/local/nginx/conf/nginx.conf |
4.7.部署java环境
下载oracle jdk
http://www.oracle.com/technetwork/java/javase/downloads/index-jsp-138363.html
4.8.安装jdk
|
1
2
3
4
5
|
tar -xf jdk-8u91-linux-x64.tar.gz -C /usr/local/ vim /etc/profileexport JAVA_HOME=/usr/local/jdk1.8.0_91export PATH=$JAVA_HOME/bin:$PATHexport CLASSPATH=.:$JAVA_HOME/lib/dt.jar:$JAVA_HOME/lib/tools.jar |
4.9.安装logstsh
下载:https://www.elastic.co/
|
1
|
#yum install logstash-2.3.2-1.noarch.rpm |
4.10.配置logstash
|
1
2
3
4
5
6
7
8
9
10
11
12
13
|
vim /etc/logstash/conf.d/logstash_cli.conf input { file { path => ["/app/local/nginx/logs/access.log"] type => "nginx_log" start_position => "beginning" }}output { stdout {codec => rubydebug }} |
检查语法:
|
1
2
|
/opt/logstash/bin/logstash -f ./logstash_cli.conf --configtestConfiguration OK |
启动查看收集nginx状况
|
1
2
3
4
5
6
7
8
9
10
11
12
13
14
15
16
17
18
19
20
|
# /opt/logstash/bin/logstash -f ./logstash_cli.confSettings: Default pipeline workers: 4Pipeline main started{ "message" => "192.168.1.105 - - [11/May/2016:14:09:59 +0800] \"GET / HTTP/1.1\" 304 0 \"-\" \"Mozilla/5.0 (Windows NT 6.1; WOW64) AppleWebKit/537.36 (KHTML, like Gecko) Chrome/49.0.2623.75 Safari/537.36\" - 476 1462946999.744 9 0.000", "@version" => "1", "@timestamp" => "2016-05-11T06:10:00.546Z", "path" => "/app/local/nginx/logs/access.log", "host" => "qmcent7.com", "type" => "nginx_log"}{ "message" => "192.168.1.105 - - [11/May/2016:14:09:59 +0800] \"GET / HTTP/1.1\" 304 0 \"-\" \"Mozilla/5.0 (Windows NT 6.1; WOW64) AppleWebKit/537.36 (KHTML, like Gecko) Chrome/49.0.2623.75 Safari/537.36\" - 476 1462946999.952 10 0.000", "@version" => "1", "@timestamp" => "2016-05-11T06:10:00.547Z", "path" => "/app/local/nginx/logs/access.log", "host" => "qmcent7.com", "type" => "nginx_log"}........................ |
修改配置文件,将数据输出到redis:
|
1
2
3
4
5
6
7
8
9
10
11
12
13
14
15
|
vim /etc/logstash/conf.d/logstash_cli.conf input { file { path => ["/app/local/nginx/logs/access.log"] type => "nginx_log" start_position => "beginning" }}output { redis { host => "192.168.1.89" key => 'logstash-redis' data_type => 'list' }} |
检查语法:
|
1
2
|
/opt/logstash/bin/logstash -f ./logstash_cli.conf --configtestConfiguration OK |
启动服务:
|
1
|
/etc/init.d/logstash start |
查看进程:
|
1
2
3
|
# ps -ef | grep logstashlogstash 4818 1 0 May10 pts/2 00:03:42 /usr/local/jdk1.8.0_91/bin/java -XX:+UseParNewGC -XX:+UseConcMarkSweepGC -Djava.awt.headless=true -XX:CMSInitiatingOccupancyFraction=75 -XX:+UseCMSInitiatingOccupancyOnly -XX:+HeapDumpOnOutOfMemoryError -Djava.io.tmpdir=/var/lib/logstash -Xmx1g -Xss2048k -Djffi.boot.library.path=/opt/logstash/vendor/jruby/lib/jni -XX:+UseParNewGC -XX:+UseConcMarkSweepGC -Djava.awt.headless=true -XX:CMSInitiatingOccupancyFraction=75 -XX:+UseCMSInitiatingOccupancyOnly -XX:+HeapDumpOnOutOfMemoryError -Djava.io.tmpdir=/var/lib/logstash -XX:HeapDumpPath=/opt/logstash/heapdump.hprof -Xbootclasspath/a:/opt/logstash/vendor/jruby/lib/jruby.jar -classpath :.:/usr/local/jdk1.8.0_91/lib/dt.jar:/usr/local/jdk1.8.0_91/lib/tools.jar -Djruby.home=/opt/logstash/vendor/jruby -Djruby.lib=/opt/logstash/vendor/jruby/lib -Djruby.script=jruby -Djruby.shell=/bin/sh org.jruby.Main --1.9 /opt/logstash/lib/bootstrap/environment.rb logstash/runner.rb agent -f /etc/logstash/conf.d -l /var/log/logstash/logstash.logroot 6097 3733 0 15:07 pts/2 00:00:00 grep logstash |
五、安装部署redis
|
1
|
192.168.1.89(redis) |
5.1.下载redis官网下载
|
1
2
3
4
5
6
7
8
9
|
tar -xf redis-3.0.7.tar.gz cd redis-3.0.7makemkdir -p /usr/local/redis/{conf,bin}cp *.conf /usr/local/redis/conf/cp runtest* /usr/local/redis/cp mkreleasehdr.sh redis-benchmark redis-check-aof redis-check-dump redis-cli redis-sentinel redis-server redis-trib.rb /usr/local/redis/bin/mkdir -pv /data/redis/dbmkdir /data/log/redis -pv |
5.2.启动redis:
|
1
|
/usr/local/redis/bin/redis-server /usr/local/redis/conf/redis.conf |
六、安装部署logstash server
|
1
|
192.168.1.87(logstash[server]) |
6.1.安装jdk
|
1
2
3
4
5
|
tar -xf jdk-8u91-linux-x64.tar.gz -C /usr/local/ vim /etc/profileexport JAVA_HOME=/usr/local/jdk1.8.0_91export PATH=$JAVA_HOME/bin:$PATHexport CLASSPATH=.:$JAVA_HOME/lib/dt.jar:$JAVA_HOME/lib/tools.jar |
6.2.安装logstsh
下载:https://www.elastic.co/
#yum install logstash-2.3.2-1.noarch.rpm
6.3.配置logstash server
|
1
2
3
4
5
6
7
8
9
10
11
12
13
14
15
|
vim /etc/logstash/conf.d/logstash_server.confinput { redis { port => "6379" host => "192.168.1.89" data_type => "list" key => "logstash-redis" type => "redis-input" }}output { stdout {codec => rubydebug }} |
检查语法:
|
1
2
|
/opt/logstash/bin/logstash -f ./logstash_server.conf --configtestConfiguration OK |
检查收集数据:
|
1
2
3
4
5
6
7
8
9
10
11
12
13
14
15
16
17
18
19
|
# /opt/logstash/bin/logstash -f ./logstash_server.conf Settings: Default pipeline workers: 4Pipeline main started{ "message" => "192.168.1.105 - - [11/May/2016:22:00:53 +0800] \"GET / HTTP/1.1\" 200 612 \"-\" \"Mozilla/5.0 (Windows NT 6.1; WOW64) AppleWebKit/537.36 (KHTML, like Gecko) Chrome/49.0.2623.75 Safari/537.36\" - 369 1462975253.311 1 0.000", "@version" => "1", "@timestamp" => "2016-05-11T14:08:15.895Z", "path" => "/app/local/nginx/logs/access.log", "host" => "qmcent7.com", "type" => "nginx_log"}{ "message" => "192.168.1.105 - - [11/May/2016:22:00:53 +0800] \"GET /favicon.ico HTTP/1.1\" 404 570 \"http://192.168.1.93/\" \"Mozilla/5.0 (Windows NT 6.1; WOW64) AppleWebKit/537.36 (KHTML, like Gecko) Chrome/49.0.2623.75 Safari/537.36\" - 310 1462975253.373 2 0.000", "@version" => "1", "@timestamp" => "2016-05-11T14:08:16.024Z", "path" => "/app/local/nginx/logs/access.log", "host" => "qmcent7.com", "type" => "nginx_log"..... |
修改logstash配置文件:
将收集的数据输出到ES集群中
|
1
2
3
4
5
6
7
8
9
10
11
12
13
14
15
|
input { redis { port => "6379" host => "192.168.1.89" data_type => "list" key => "logstash-redis" type => "redis-input" }}output { elasticsearch { hosts => "192.168.1.91" index => "logstash-%{+YYYY.MM.dd}" }} |
启动服务:
|
1
|
/etc/init.d/logstash start |
七、安装部署elasticsearch集群
|
1
2
3
|
192.168.1.88(elasticsearch)192.168.1.91(elasticsearch)192.168.1.92(elasticsearch) |
部署java环境,全部一致:
tar -xf jdk-8u91-linux-x64.tar.gz -C /usr/local/
|
1
2
3
4
5
|
vim /etc/profileexport JAVA_HOME=/usr/local/jdk1.8.0_91export PATH=$JAVA_HOME/bin:$PATHexport CLASSPATH=.:$JAVA_HOME/lib/dt.jar:$JAVA_HOME/lib/tools.jar |
安装ES、全部一致:
|
1
|
yum install elasticsearch-2.3.2.rpm |
192.168.1.88(elasticsearch)
修改ES配置文件:
|
1
2
3
4
5
6
7
|
vim /etc/elasticsearch/elasticsearch.ymlcluster.name: qm.ela.com node.name: n1.qm.compath.logs: /data/log/network.host: 192.168.1.88http.port: 9200discovery.zen.ping.unicast.hosts: ["192.168.1.91","192.168.1.92"] |
[88]启动服务:
|
1
|
/etc/init.d/elasticsearch start |
192.168.1.91(elasticsearch)
修改ES配置文件:
|
1
2
3
4
5
6
7
|
vim /etc/elasticsearch/elasticsearch.ymlcluster.name: qm.ela.com node.name: n2.qm.compath.logs: /data/lognetwork.host: 192.168.1.91http.port: 9200discovery.zen.ping.unicast.hosts: ["192.168.1.88","192.168.1.92"] |
[91]启动服务:
|
1
|
/etc/init.d/elasticsearch start |
192.168.1.92(elasticsearch)
|
1
2
3
4
5
6
7
|
vim /etc/elasticsearch/elasticsearch.ymlcluster.name: qm.ela.com node.name: n3.qm.compath.logs: /data/lognetwork.host: 192.168.1.92 http.port: 9200discovery.zen.ping.unicast.hosts: ["192.168.1.88","192.168.1.91"] |
[92]启动服务:
|
1
|
/etc/init.d/elasticsearch start |
查看端口:
|
1
2
3
4
5
6
7
8
9
10
11
12
13
14
15
|
# netstat -ntplActive Internet connections (only servers)Proto Recv-Q Send-Q Local Address Foreign Address State PID/Program name tcp 0 0 0.0.0.0:45955 0.0.0.0:* LISTEN 1573/rpc.statd tcp 0 0 0.0.0.0:111 0.0.0.0:* LISTEN 1517/rpcbind tcp 0 0 0.0.0.0:22 0.0.0.0:* LISTEN 1847/sshd tcp 0 0 127.0.0.1:631 0.0.0.0:* LISTEN 1610/cupsd tcp 0 0 127.0.0.1:25 0.0.0.0:* LISTEN 1926/master tcp 0 0 :::44937 :::* LISTEN 1573/rpc.statd tcp 0 0 :::111 :::* LISTEN 1517/rpcbind tcp 0 0 ::ffff:192.168.1.88:9200 :::* LISTEN 1089/java tcp 0 0 ::ffff:192.168.1.88:9300 :::* LISTEN 1089/java tcp 0 0 :::22 :::* LISTEN 1847/sshd tcp 0 0 ::1:631 :::* LISTEN 1610/cupsd tcp 0 0 ::1:25 :::* LISTEN 1926/master |
启动两个端口
9200:集群之间事务通信
9300:集群选举等
信息查看
1.查看健康信息:
|
1
2
3
4
5
6
7
8
9
10
11
12
13
14
15
16
17
18
|
# curl -XGET 'http://192.168.1.88:9200/_cluster/health?pretty' { "cluster_name" : "qm.ela.com", "status" : "green", "timed_out" : false, "number_of_nodes" : 3, "number_of_data_nodes" : 3, "active_primary_shards" : 14, "active_shards" : 28, "relocating_shards" : 0, "initializing_shards" : 0, "unassigned_shards" : 0, "delayed_unassigned_shards" : 0, "number_of_pending_tasks" : 0, "number_of_in_flight_fetch" : 0, "task_max_waiting_in_queue_millis" : 0, "active_shards_percent_as_number" : 100.0} |
2.查看节点数:
|
1
2
3
4
5
|
# curl -XGET '192.168.1.88:9200/_cat/nodes?v'host ip heap.percent ram.percent load node.role master name 192.168.1.91 192.168.1.91 10 87 0.00 d m n2.qm.com 192.168.1.92 192.168.1.92 7 93 0.00 d m n3.qm.com 192.168.1.88 192.168.1.88 17 88 0.00 d * n1.qm.com |
由此可见,192.168.1.88已经成为主节点
3.查看节点分片信息:
|
1
2
3
4
5
6
7
8
|
# curl -XGET '192.168.1.88:9200/_cat/indices?v'health status index pri rep docs.count docs.deleted store.size pri.store.size green open .kibana 1 1 3 0 49.8kb 24.9kb green open .marvel-es-data-1 1 1 14 274 131.5kb 63.2kb green open logstash-2016.05.10 5 1 168 0 543.3kb 271.6kb green open logstash-2016.05.11 5 1 118 0 315.6kb 161kb green open .marvel-es-1-2016.05.11 1 1 38433 56 35.6mb 17.8mb green open .marvel-es-1-2016.05.10 1 1 42622 16 24.5mb 12.2mb |
安装插件:
1.安装插件marvel,三个节点安装一致:
|
1
2
|
/usr/share/elasticsearch/bin/plugin install license/usr/share/elasticsearch/bin/plugin install marvel-agent |
2.安装head插件,三个节点安装一致:
|
1
|
/usr/share/elasticsearch/bin/plugin install mobz/elasticsearch-head |
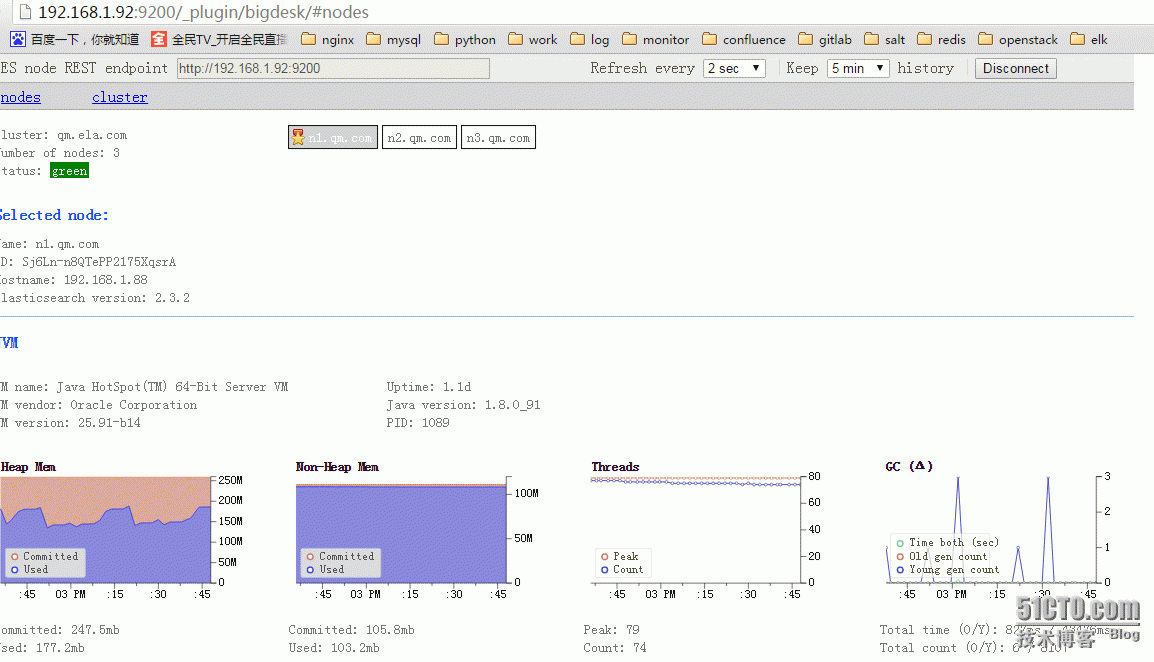
3.安装bigdesk 插件:
|
1
2
3
4
5
6
7
8
9
10
11
|
cd /usr/share/elasticsearch/pluginsmkdir bigdeskcd bigdesk/git clone https://github.com/lukas-vlcek/bigdesk _sitesed -i '142s/==/>=/' _site/js/store/BigdeskStore.jscat >plugin-descriptor.properties<<EOFdescription=bigdesk - Live charts and statistics for Elasticsearch cluster.version=2.5.1site=truename=bigdeskEOF |
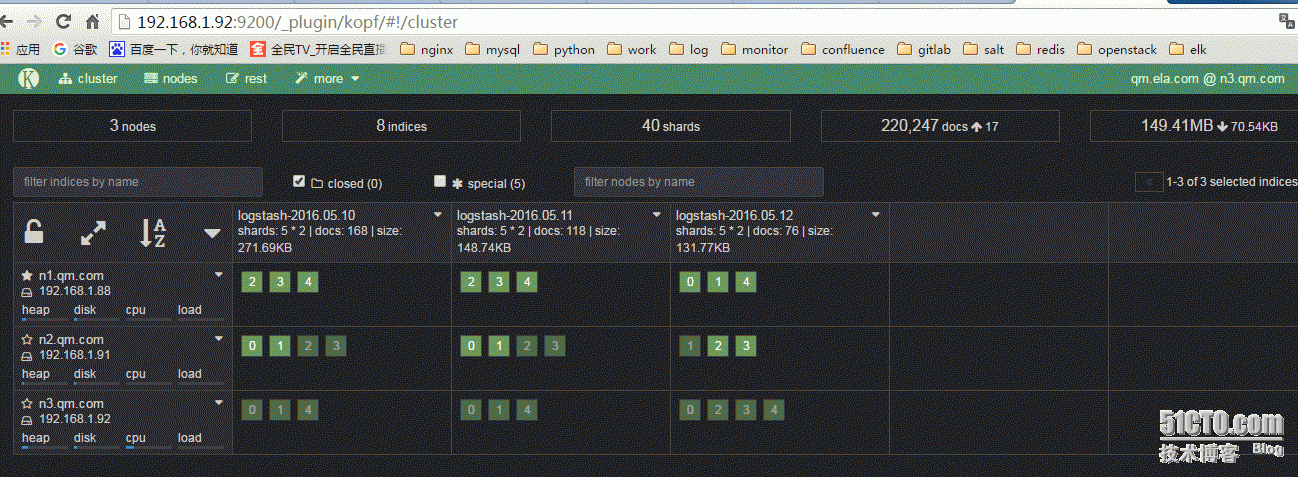
4.安装kopf插件:
|
1
|
/usr/share/elasticsearch/bin/plugin install lmenezes/elasticsearch-kopf |
查看安装的插件:
|
1
2
3
4
5
6
7
8
|
/usr/share/elasticsearch/bin/plugin listInstalled plugins in /usr/share/elasticsearch/plugins: - head - bigdesk - analysis-kuromoji - kopf - license - marvel-agent |
访问head,查看集群是否一致

访问bigdesk,查看信息:
访问kopf,查看信息:
八、安装kibana
|
1
|
192.168.1.92(kibana) |
8.1.下载包:
https://www.elastic.co/downloads/kibana
8.2.安装:
|
1
|
tar -xf kibana-4.5.0-linux-x64.tar.gz -C /usr/local |
安装插件:
|
1
2
|
cd /usr/local/kibanabin/kibana plugin --install elasticsearch/marvel/latest |
启动服务:
|
1
2
3
4
5
6
7
8
9
10
11
12
13
|
bin/kibana log [12:47:34.251] [info][status][plugin:kibana] Status changed from uninitialized to green - Ready log [12:47:34.272] [info][status][plugin:elasticsearch] Status changed from uninitialized to yellow - Waiting for Elasticsearch log [12:47:34.275] [info][status][plugin:marvel] Status changed from uninitialized to yellow - Waiting for Elasticsearch log [12:47:34.312] [info][status][plugin:kbn_vislib_vis_types] Status changed from uninitialized to green - Ready log [12:47:34.316] [info][status][plugin:markdown_vis] Status changed from uninitialized to green - Ready log [12:47:34.319] [info][status][plugin:metric_vis] Status changed from uninitialized to green - Ready log [12:47:34.328] [info][status][plugin:spyModes] Status changed from uninitialized to green - Ready log [12:47:34.331] [info][status][plugin:statusPage] Status changed from uninitialized to green - Ready log [12:47:34.337] [info][status][plugin:elasticsearch] Status changed from yellow to green - Kibana index ready log [12:47:34.338] [info][status][plugin:table_vis] Status changed from uninitialized to green - Ready log [12:47:35.599] [info][status][plugin:marvel] Status changed from yellow to green - Marvel index ready log [12:47:35.638] [info][listening] Server running at http://0.0.0.0:5601 |
查看数据:

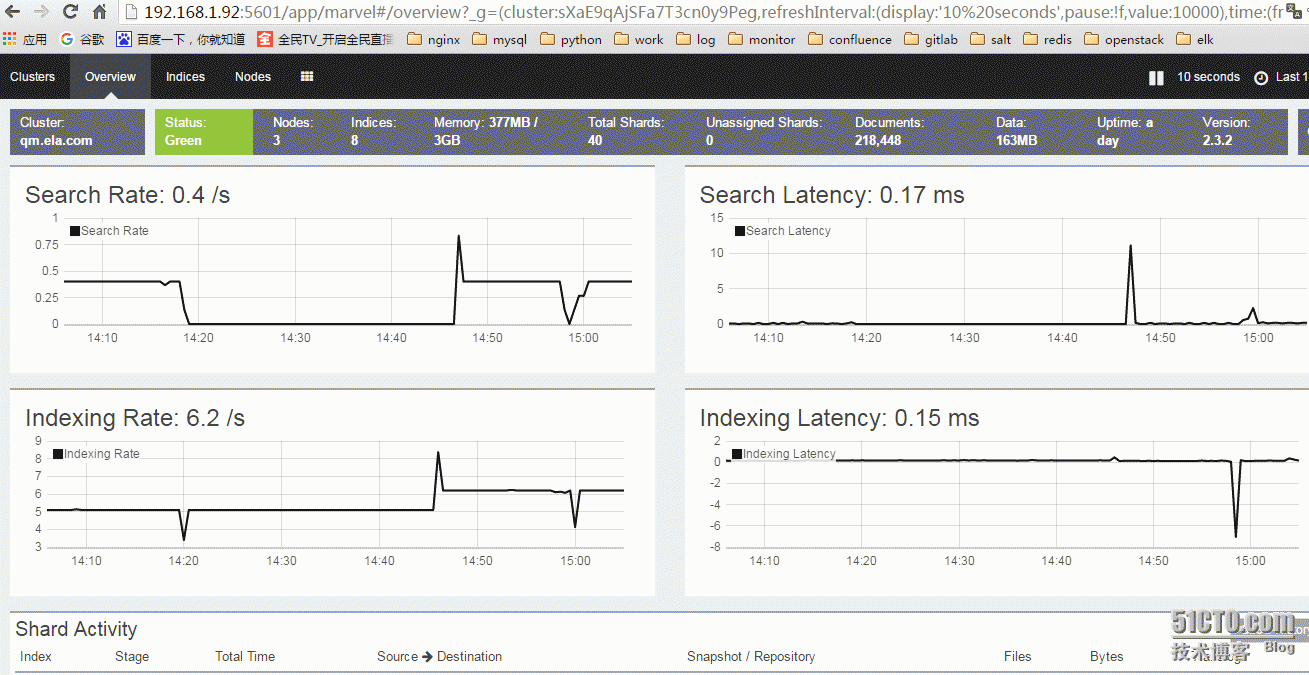
访问marvel:
错误说明:
|
1
2
3
4
5
6
7
8
9
10
11
12
13
|
Stopping elasticsearch: [ OK ]Starting elasticsearch: Exception in thread "main" java.lang.IllegalStateException: marvel plugin requires the license plugin to be installed at org.elasticsearch.marvel.license.LicenseModule.verifyLicensePlugin(LicenseModule.java:37) at org.elasticsearch.marvel.license.LicenseModule.<init>(LicenseModule.java:25) at org.elasticsearch.marvel.MarvelPlugin.nodeModules(MarvelPlugin.java:87) at org.elasticsearch.plugins.PluginsService.nodeModules(PluginsService.java:263) at org.elasticsearch.node.Node.<init>(Node.java:179) at org.elasticsearch.node.Node.<init>(Node.java:140) at org.elasticsearch.node.NodeBuilder.build(NodeBuilder.java:143) at org.elasticsearch.bootstrap.Bootstrap.setup(Bootstrap.java:178) at org.elasticsearch.bootstrap.Bootstrap.init(Bootstrap.java:270) at org.elasticsearch.bootstrap.Elasticsearch.main(Elasticsearch.java:35)Refer to the log for complete error details. [FAILED] |
需要安装license
|
1
|
/usr/share/elasticsearch/bin/plugin install license |
ELK集群部署实例(转)的更多相关文章
- Shell脚本实现---Swarm集群部署实例(Swarm Cluster)
Shell脚本实现---Swarm集群部署实例(Swarm Cluster) 一.机器环境(均是centos7.8) IP hostname 角色 192.168.10.200 manager-swa ...
- Windows下ELK环境搭建(单机多节点集群部署)
1.背景 日志主要包括系统日志.应用程序日志和安全日志.系统运维和开发人员可以通过日志了解服务器软硬件信息.检查配置过程中的错误及错误发生的原因.经常分析日志可以了解服务器的负荷,性能安全性,从而及时 ...
- zookeeper的单实例和伪集群部署
原文链接: http://gudaoyufu.com/?p=1395 zookeeper工作方式 ZooKeeper 是一个开源的分布式协调服务,由雅虎创建,是 Google Chubby 的开源实现 ...
- ELK + filebeat集群部署
ELK + filebeat集群部署 一.ELK简介 1. Elasticsearch Elasticsearch是一个实时的分布式搜索分析引擎, 它能让你以一个之前从未有过的速度和规模,去探索你的数 ...
- ansible playbook部署ELK集群系统
一.介绍 总共4台机器,分别为 192.168.1.99 192.168.1.100 192.168.1.210 192.168.1.211 服务所在机器为: redis:192.168.1.211 ...
- ActionMQ集群部署
ActiveMQ集群部署 一.应用场景 消息中间件是分布式系统中重要的组件,主要解决应用耦合,异步消息,流量削锋等问题.实现高性能,高可用,可伸缩和最终一致性架构.是大型分布式系统不可缺少的中间件.目 ...
- Elasticsearch学习总结 (Centos7下Elasticsearch集群部署记录)
一. ElasticSearch简单介绍 ElasticSearch是一个基于Lucene的搜索服务器.它提供了一个分布式多用户能力的全文搜索引擎,基于RESTful web接口.Elasticse ...
- ELK集群之elasticsearch(3)
Elasticsearch-基础介绍及索引原理分析 介绍 Elasticsearch 是一个分布式可扩展的实时搜索和分析引擎,一个建立在全文搜索引擎 Apache Lucene(TM) 基础上的搜索引 ...
- Quartz.net持久化与集群部署开发详解
序言 我前边有几篇文章有介绍过quartz的基本使用语法与类库.但是他的执行计划都是被写在本地的xml文件中.无法做集群部署,我让它看起来脆弱不堪,那是我的罪过. 但是quart.net是经过许多大项 ...
随机推荐
- jmeter ---监控服务器CPU, 内存,网络数据
JMeter如何收集获得服务器cpu,内存,磁盘,网络等相关资源使用率的信息 1. JMeter 自带的Monitor Results 监控 JMeter 自带的Monitor Results 在官网 ...
- windows系统如何设置域名解析
C:\Windows\System32\drivers\etc
- Digispark红外接收器
一.红外协议之NEC协议原理 NEC协议格式: 首次发送的是9ms的高电平脉冲,其后是4.5ms的低电平,接下来就是8bit的地址码(从低有效位开始发),而后是8bit的地址码的反码(主要是用于校验是 ...
- require 与 include 的区别
require 的英文意思是 需要,有赖于.如果使用了这条语句,也就是告诉PHP内核,我这个程序需要这个文件,有赖于这个文件.或者通俗点儿讲就是:我要她!所以,PHP如果发现require参数中的文件 ...
- pyqt环境安装
pyqt环境配置 pip install pyqt5 windows下 pip install pyqt5-tools linux安装designer sudo apt install qttools ...
- workerman vmstat服务器状态监控服务
转载出自 :http://www.workerman.net/workerman-vmstat workerman vmstat服务器状态监控服务 vmstat 命令可以展现服务器的CPU使用率,内存 ...
- 黄聪:FFmpeg 使用指南
1. ffmpeg 是什么? ffmpeg(命令行工具) 是一个快速的音视频转换工具. 2. ffmpeg 的使用方式 命令行: ffmpeg [全局选项] {[输入文件选项] -i ‘输入文件’} ...
- 陷入了一个NGUI自适应的一个坑
自己对anchor的乱用.造成自己深陷anchor来搞自适应 耽误了太多的精力,最终也是回到正轨的途径 这期间浪费的太多精力了. 沉迷一件错误的事情过久 就 要果断的跳出 调整 . 但凡让自己觉得别扭 ...
- PAT 乙级 1026 程序运行时间(15) C++版
1026. 程序运行时间(15) 时间限制 200 ms 内存限制 65536 kB 代码长度限制 8000 B 判题程序 Standard 作者 CHEN, Yue 要获得一个C语言程序的运行时间, ...
- IRQL Ring0实现
一,IRQL的定义Interrupt ReQuest Level DDK对IRQL的定义是:中断请求级(IRQL)标示中断的优先级.处理器在一个IRQL上执行线程代码,IRQL是帮助决定线程如 ...