Data Flow Diagram with Examples - Customer Service System
Data Flow Diagram (DFD) provides a visual representation of the flow of information (i.e. data) within a system. By creating a Data Flow Diagram, you can tell the information provided by and delivered to someone who takes part in system processes, the information needed in order to complete the processes and the information needed to be stored and accessed. Data Flow Diagram is widely-used in software engineering. You can use DFD in modeling information systems. This article describes and explain Data Flow Diagram (DFD) by using a customer service system as an example.
The CS System Example
The data flow diagram is a hierarchy of diagram consist of:
- Context Diagram (conceptually level zero)
- The Level-1 DFD
- And possible Level-2 DFD and further levels of functional decomposition depending on the complexity of your system
Context DFD
The figure below shows a context Data Flow Diagram that is drawn for a railway company's Customer Service System. It contains a process (shape) that represents the system to model, in this case, the "CS System". It also shows the participants who will interact with the system, called the external entities. In this example, CS Assistant and Passenger are the two entities who will interact with the system. In between the process and the external entities, there are data flow (connectors) that indicate the existence of information exchange between the entities and the system.
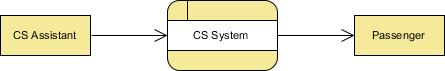
Context DFD is the entrance of a data flow model. It contains one and only one process and does not show any data store.
Level 1 DFD
The figure below shows the level 1 DFD, which is the decomposition (i.e. break down) of the CS System process shown in the context DFD. Read through the diagram and then we will introduce some of the key concepts based
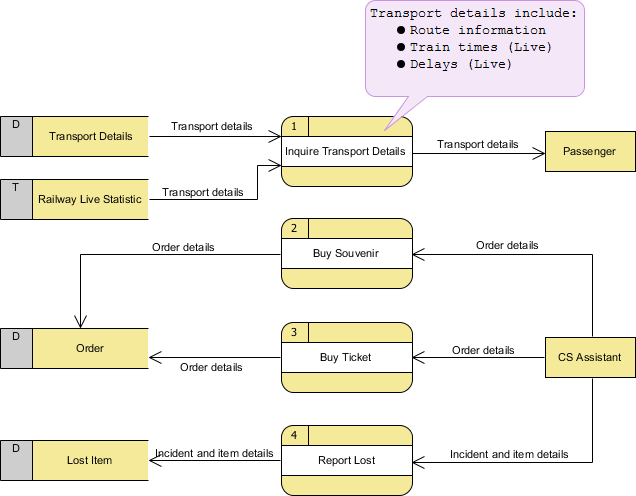
The CS System Data Flow Diagram example contains four processes, two external entities and four data stores. Although there is no design guidelines that governs the positioning of shapes in a Data Flow Diagram, we tend to put the processes in the middle and data stores and external entities on the sides to make it easier to comprehend.
Based on the diagram, we know that a Passenger can receive Transport details from the Inquiry Transport Details process, and the details are provided by the data stores Transport Details and Railway Live Statistic. While data stored in Transport Details are persistent data (indicated by the label "D"), data stored in Railway Live Statistic are transient data that are held for a short time (indicated by the label "T"). A callout shape is used to list out the kind of details that can be inquired by passenger.
CS Assistant can initiate the Buy Souvenir process, which will result in having the Order details stored in the Order data store. Although customer is the real person who buy souvenir, it is the CS Assistant who accesses the system for storing the order details. Therefore, we make the data flow from CS Assistant to the Buy Souvenir process.
CS Assistant can also initiate the Buy Ticket process by providing Order details and the details will be stored again in the Order data store. Data Flow Diagram is a high level diagram that is drawn with a high degree of abstraction. The data store Order which is drawn here does not necessarily imply a real order database or order table in a database. The way how order details are stored physically is to be decided later on when implementing the system.
Finally, CS Assistant can initiate the Report Lost process by providing the Incident and item details and the information will be stored in the Lost Item database.
Data Flow Diagram Tips and Cautions
Stating the type of data with D, M and T
Each data store which is drawn in a Data Flow Diagram are prefixed by a letter, which is 'D' by default. The letter indicates the kind of data the data store holds. The letter 'D' is used to represent a persistent computerized data, which is probably the most common kind of data type in a typical information system. Besides computerized data, data can also be held for a short time in temporary. We call this kind of data transient data and is represented by letter 'T'. Sometimes, data is stored without the use of a computer. We call this kind of data manual data and is represented by letter 'M'. Finally, if the data is stored without using computer and also is held for a short time, this is known as manual transient data and is represented by T(M).
Be aware of the level of details
In this Data Flow Diagram example, the word "details" is used many times when labeling data. We have "transport details" and "order details". What if we write them explicitly as "route information, train times and delays", "souvenir name, quantity and amount" and "ticket type and amount"? Is this correct? Well, there is no definite answer to this question but try to ask yourself a question when making a decision. Why are you drawing a DFD?
In most cases, Data Flow Diagram is drawn in the early phase of system development, where many details are yet to be confirmed. The use of general terminologies like "details", "information", "credential" certainly leave room for discussion. However, using general terms can be kind of lacking details and make the design lost its usefulness. So it really depends on the purpose of your design.
Don't overdrawn
In a Data Flow Diagram, we focus on the interactions between the system and external parties, rather than the internal communications among interfaces. Therefore, data flows between interfaces and the data stores used are considered to be out of scope and should not be shown in the diagram.
Don't mix up data flow and process flow
Some designers may feel uncomfortable when coming across a connector connecting from a data store to a process, without showing the step of data request being specified on the diagram. Some designers will attempt to put a request attached to the connector between a process and a data store, labeling it "a request" or "request for something", which is surely unnecessary.
Keep in mind that Data Flow Diagram was designed for representing the exchange of information. Connectors in a Data Flow Diagram are for representing data, not for representing process flow, step or anything else. When we label a data flow that ends at a data store "a request", this literally means we are passing a request as data into a data store. Although this may be the case in implementation level as some of the DBMS do support the use of functions, which intake some values as parameters and return a result, however, in data flow diagram, we tend to treat data store as a sole data holder that does not possess any processing capability. If you want to model the system flow or process flow, you could use either Activity Diagram or BPMN Business Process Diagram instead. If you want to model the internal structure of data store, you may use Entity Relationship Diagram.
Data Flow Diagram with Examples - Customer Service System的更多相关文章
- 数据可视化 —— 数据流图(Data Flow Diagram)
数据流图(Data Flow Diagram):简称 DFD,它从数据传递和加工角度,以图形方式来表达系统的逻辑功能.数据在系统内部的逻辑流向和逻辑变换过程,是结构化系统分析方法的主要表达工具及用于表 ...
- react & redux data flow diagram
react & redux data flow diagram Redux 数据流程图
- SSIS Data Flow 的 Execution Tree 和 Data Pipeline
一,Execution Tree 执行树是数据流组件(转换和适配器)基于同步关系所建立的逻辑分组,每一个分组都是一个执行树的开始和结束,也可以将执行树理解为一个缓冲区的开始和结束,即缓冲区的整个生命周 ...
- Intel® Threading Building Blocks (Intel® TBB) Developer Guide 中文 Parallelizing Data Flow and Dependence Graphs并行化data flow和依赖图
https://www.threadingbuildingblocks.org/docs/help/index.htm Parallelizing Data Flow and Dependency G ...
- Data Flow ->> Script Component
和Control Flow中的Script Task非常类似,不同的是Script Component是Per-Row的执行类型.打个比方,在Script Component中加入两个Output的字 ...
- Spring Cloud Data Flow 中的 ETL
Spring Cloud Data Flow 中的 ETL 影宸风洛 程序猿DD 今天 来源:SpringForAll社区 1 概述 Spring Cloud Data Flow是一个用于构建实时数据 ...
- 【SFA官方译文】:Spring Cloud Data Flow中的ETL
原创: 影宸风洛 SpringForAll社区 昨天 原文链接:https://www.baeldung.com/spring-cloud-data-flow-etl 作者:Norberto Ritz ...
- (转)CAS (4) —— CAS浏览器SSO访问顺序图详解(CAS Web Flow Diagram by Example)
CAS (4) —— CAS浏览器SSO访问顺序图详解(CAS Web Flow Diagram by Example) tomcat版本: tomcat-8.0.29 jdk版本: jdk1.8.0 ...
- SSIS ->> Data Flow Design And Tuning
Requirements: Source and destination system impact Processing time windows and performance Destinati ...
随机推荐
- what the fuck!(二分查找 / 暴力模拟)
what the fuck! Description 现在有一家公司有nnn个员工(nnn为奇数),他们的工资发放是基本工资+提成,现在这家公司计划再招一批人.要写一篇招聘启事,但是对于这个招聘启事中 ...
- Springboot项目中 前端展示本地图片
Springboot项目中 前端展示本地图片 本文使用的是Springboot官方推荐的thymeleaf(一种页面模板技术) 首先在pom文件加依赖 <dependency> <g ...
- php静态变量的运用
<?php $count = 5; function get_count() { static $count = 0; return $count++; } echo $count; echo ...
- 【Linux】系统管理
软件包管理 一 软件包分类 源码包: .tar.gz .tar.bz2 二进制包: .rpm 二 二进制包安装 (一) rpm命令手动管理二进制包 (挂载光盘) 1 包名-版本号-发布次数-适合lin ...
- 3.K均值算法
一.概念 K-means中心思想:事先确定常数K,常数K意味着最终的聚类类别数,首先随机选定初始点为质心,并通过计算每一个样本与质心之间的相似度(这里为欧式距离),将样本点归到最相似的类中,接着,重新 ...
- python3(一)
print('test', '怎么自动建了这么多目录', 'aaaaaaa') #test 怎么自动建了这么多目录 aaaaaaa 注释# # ---------------------------- ...
- Linux C++ 网络编程学习系列(6)——多路IO之epoll高级用法
poll实现多路IO 源码地址:https://github.com/whuwzp/linuxc/tree/master/epoll_libevent 源码说明: server.cpp: 监听127. ...
- Apache与PHP的配置
Listen 表示端口号 ServerName 表示域名 <Directory 路径> 表示默认开放的路径 <IfModule dir_module> 表示默认显示的文件名 & ...
- JAVA+HttpServletRequest文件上传
public Result fileUp(HttpServletRequest request) { RowsVo vo = new RowsVo(); MultipartHttpServletReq ...
- Java学习成长第一集
由于最近所在项目组的项目临近结尾,所以有时间对自己近来的学习做个总结.不得不说,程序员不学习就退步这句话是真的很让人信服!自己入行将近一年的时间,所学的就是Java开发的专业,很羞愧的是现在的自己能力 ...