Exploring the MapBox stack: MBTiles, TileJSON, UTFGrids and Wax
转自:http://blog.thematicmapping.org/2012/11/exploring-mapbox-stack-mbtiles-tilejson.html
In my last blog post, we created a population density map of New Zealand using QGIS, SQLite and TileMill. Today, we’re going to publish this map to the web using various MapBox inventions. I'll also show you how to publish an interactive TileMill map on your own web server using some PHP and JavaScript wizardry.
I love MapBox. The team behind this platform has created a series of new specifications, allowing us to create fast, good looking and interactive maps. The downside is the limited support for other map projections than Web Mercator.
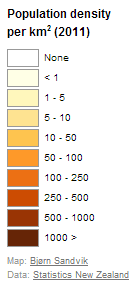
TileMill allows you to add legends and tooltips to your maps. I’ve added a legend to my population density map with a HTML snippet describing the map and the color scale.
| 123456789101112131415161718 |
<div class='my-legend'>
<div class='legend-title'>Population density<br/>per km<sup>2</sup> (2011)</div>
<div class='legend-scale'>
<ul class='legend-labels'>
<li><span style='background:#FFFFFF;'></span>None</li>
<li><span style='background:#FFFFE5;'></span>< 1</li>
<li><span style='background:#FFF7BC;'></span>1 - 5</li>
<li><span style='background:#FEE391;'></span>5 - 10</li>
<li><span style='background:#FEC44F;'></span>10 - 50</li>
<li><span style='background:#FE9929;'></span>50 - 100</li>
<li><span style='background:#EC7014;'></span>100 - 250</li>
<li><span style='background:#CC4C02;'></span>250 - 500</li>
<li><span style='background:#993404;'></span>500 - 1000</li>
<li><span style='background:#662506;'></span>1000 ></li>
</ul>
</div>
<div class='legend-source'>Map: <a href="http://blog.thematicmapping.org">Bjørn Sandvik</a><br/>Data: <a href="http://www.stats.govt.nz/">Statistics New Zealand</a></div>
</div>
|
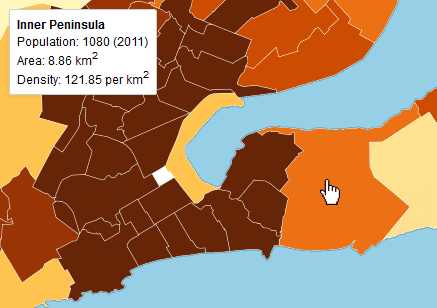
The tooltip shows when the user hovers over or clicks on the map. It allows us to show dynamic content - additional data, images, charts - for each map feature. I want to show the name, total population, area and population density for each feature:
| 123456 |
<div>
<strong>{{{au_name}}}</strong><br>
Population: {{{pop2011}}} (2011)<br>
Area: {{{area}}} km<sup>2</sup><br>
Density: {{{popdens}}} per km<sup>2</sup>
</div>
|
The data fields for the layer are wrapped in curly Mustache tags. These tags will be replaced by data when you interact with the map. You can use the full Mustache template language.
The easy way to publish this map is to upload it to MapBox Hosting, and use the embed code provided. If you want to publish your map on your own web server, this is an alternative route:
To export an interactive map from TileMill, you need to use the MBTiles format. This is an innovative SQLite-basedformat specification capable of storing millions of map tiles in a single file. The format is also supported by various3rd-party applications, and I'm sure we'll see a greater adoption in the future.
Within the MBTiles file, the map legend, the tooltip template and information about map extent, zoom levels etc. is stored in a format named TileJSON. This is also an open specification, providing a consistent way of describing a map, making it easier to load and display a map the way it’s meant to be seen. The TileJSON for my map looks like this:
| 1234567891011121314151617181920 |
{
"tilejson": "2.0.0",
"scheme": "xyz",
"bounds": [ 166, -47.5, 179, -34 ],
"center": [ 173.3, -41.273, 5 ],
"minzoom": 0,
"maxzoom": 12,
"name": "Population density map of New Zealand",
"description": "Created by Bjørn Sandvik\nhttp://blog.thematicmapping.org/",
"legend": "<div class='my-legend'>\n<div class='legend-title'>Population density<br/>per km<sup>2</sup> (2011)</div>\n<div class='legend-scale'>\n <ul class='legend-labels'>\n <li><span style='background:#FFFFFF;'></span>None</li>\n <li><span style='background:#FFFFE5;'></span>< 1</li>\n <li><span style='background:#FFF7BC;'></span>1 - 5</li>\n <li><span style='background:#FEE391;'></span>5 - 10</li>\n <li><span style='background:#FEC44F;'></span>10 - 50</li>\n <li><span style='background:#FE9929;'></span>50 - 100</li>\n <li><span style='background:#EC7014;'></span>100 - 250</li>\n <li><span style='background:#CC4C02;'></span>250 - 500</li>\n <li><span style='background:#993404;'></span>500 - 1000</li>\n <li><span style='background:#662506;'></span>1000 ></li>\n </ul>\n</div>\n<div class='legend-source'>Map: <a href=\"http://blog.thematicmapping.org\">Bjørn Sandvik</a><br/>Data: <a href=\"http://www.stats.govt.nz/\">Statistics New Zealand</a></div>\n</div>",
"attribution": "Statistics New Zealand",
"template": "{{#__location__}}{{/__location__}}{{#__teaser__}}<div>\n<strong>{{{au_name}}}</strong><br>\nPopulation: {{{pop2011}}} (2011)<br>\nArea: {{{area}}} km<sup>2</sup><br>\nDensity: {{{popdens}}} per km<sup>2</sup>\n</div>{{/__teaser__}}{{#__full__}}{{/__full__}}",
"version": "1.0.0",
"tiles": [
"http://earthatlas.info/nz/tiles/nz-popden/{z}/{x}/{y}.png"
],
"grids": [
"http://earthatlas.info/nz/tiles/nz-popden/{z}/{x}/{y}.json"
]
}
|
If you add interactivity to your map (tooltips), your MBTiles file will also include the most impressing part of the MapBox specifications: UTFgrids. This JSON-format allows us to add thousands of interactive points or polygons through interactivity data grids, and it will even work in older browsers with limited support for vector data.
So how do we turn our MBTiles file into an interactive map? Previously, I've used MBUtil to extract the contents from MBTiles into a directory structure. But by doing this, we loose the benefits of the MBTiles format, like storing a map in a single file and dealing with redundant images. What we need is a script on our web server that will extract content from our MBTiles file on demand. I decided to try a PHP script from infostreams (this is probably not the most scaleable solution). The script supports the full MBTiles specification, including TileJSON and UTFGrids. Installation is simple: just put the .php file and the .htaccess file in the same directory as your .mbtiles files. The .htaccess file includes a rule that rewrites requested URLs on the fly, so the map data is available un URLs like:
- TileJSON: http://earthatlas.info/nz/tiles/nz-popden.tilejson
- Map tile: http://earthatlas.info/nz/tiles/nz-popden/9/504/320.png
- UTFGrid: http://earthatlas.info/nz/tiles/nz-popden/9/504/320.json
So when we have our backend sorted, how can we recreate our interactive map with Leaflet or other JavaScript mapping libraries? This is way the MapBox team created Wax, which is a client implementation of the MBTiles interaction specification. You just include the wax script together with your mapping library of choice, and then you can add interactivity with a few lines of code:
| 123456789101112131415161718 |
// Load TileJSON
wax.tilejson('http://earthatlas.info/nz/tiles/nz-popden.tilejson', function(tilejson) {
// Create map and add image tiles
var map = new L.Map('map-div')
.addLayer(new wax.leaf.connector(tilejson))
.setView(new L.LatLng(51, 0), 1);
// Create map legend
wax.leaf.legend(map, tilejson).appendTo(map._container);
// Add map interaction (tooltips)
wax.leaf.interaction()
.map(map)
.tilejson(tilejson)
.on(wax.tooltip().animate(true).parent(map._container).events());
});
|
I've also done some extra JavaScript coding to allow switching between various interactive map layers. I'll save that for a later blog post.
The Leaflet map looks like this (there seems to be an issue with the latest Wax distribution and Google Chrome):
Exploring the MapBox stack: MBTiles, TileJSON, UTFGrids and Wax的更多相关文章
- 与你相遇好幸运,mbview的mbtiles文件分析
mbview是一个查看.mbtiles文件的本地程序. https://github.com/mapbox/mbview .mbtiles文件就是一个Sqlite文件,用Navicat Premium ...
- Tilemill + tilestream + mapbox.js 自制地图
感谢Mapbox,带来了一整套完整的地图方案. 你可以把你的地图放在Mapbox的网站上.也可以使用他们提供的开源软件自己架设地图服务. Mapbox的地图方案包括web,ios和android. 不 ...
- TileJSON
TileJSON TileJSON is an open standard for representing map metadata. License The text of this specif ...
- MBTiles
MBTiles Specification MBTiles is a specification for storing tiled map data in SQLite databases for ...
- UVA 1362 Exploring Pyramids 区间DP
Archaeologists have discovered a new set of hidden caves in one of the Egyptian pyramids. The decryp ...
- 支持 MBTiles 规范的预缓存
SuperMap iServer 支持生成符合MBTiles规范的预缓存(MBTiles是由MapBox制定的一种将瓦片地图数据存储到SQLite数据库中并可快速使用,管理和分享的规范. 该规范由Ma ...
- Exploring Python Code Objects
Exploring Python Code Objects https://late.am/post/2012/03/26/exploring-python-code-objects.html Ins ...
- Exploring the 7 Different Types of Data Stories
Exploring the 7 Different Types of Data Stories What makes a story truly data-driven? For one, the n ...
- LA 3516(ZOJ 2641) Exploring Pyramids(递推 DP)
Exploring Pyramids Archaeologists have discovered a new set of hidden caves in one of the Egyptian p ...
随机推荐
- MyEclipse性能调优初体验
MyEclipse性能调优初体验 简介一下工作环境,MyEclipse2014,你懂的 项目中有一个基于web的工作流引擎,仅仅要执行起来就CPU差点儿耗尽(尽管看似27%,事实上已经把俺4核的CPU ...
- Cocos2d-x3.0游戏实例之《别救我》第四篇——乱入的主角
好了,前面说了那么多废话,最终要进入正题了(等等,敢情前面你都是在耍我们么?) 笨木头花心贡献,啥?花心?不呢,是用心~ 转载请注明,原文地址: http://www.benmutou.com/blo ...
- ASP.NET之电子商务系统开发-3(订单)
一.前言 继上次的购物车,这是第三篇.记录一下订单功能.这功能做的时候,走过弯路,很是烧脑,因为思路没理顺,数据库设计的也不怎么好,做到一半才发现有问题,接着把数据库重新设计好,理清思路后,终于完成了 ...
- BZOJ 1489: [HNOI2009]双递增序( dp )
dp(i, j)表示选第i个, 且当前序列长度为j, 另一个序列的最后一个元素的最小值...然后根据上一个是哪个序列选的讨论一下就行了...奇怪的dp... --------------------- ...
- pl/sql oracle
http://uule.iteye.com/blog/2061773(出处) 批量导入脚本: 打开一个command window > 输入@ > 它会让你选择要导入的文件 (自己要知道 ...
- A Byte of Python 笔记(4)控制流:if、for、while、break、continue
第6章 控制流 3种控制流语句-- if for while 默认pyhon使用ASCII码来解释程序的,默认不支持中文,需要在程序的第一行或者第二行声明编码.官方参考具体参考以下三种方式:1. ...
- 如何使用autotools生成Makefile
安装autotools工具sudo apt-get install autoconf 一,四个代码文件init.s lcd.c addr.h uart.c 二,命令:autoscan 三,命令:vi ...
- jQuery File Upload
jQuery File Upload介绍.............................................. 2 实现基本原理......................... ...
- Oracle笔记(十三) 视图、同义词、索引
一.视图 在之前所学习过的所有的SQL语法之中,查询操作是最麻烦的,如果程序开发人员将大量的精力都浪费在查询的编写上,则肯定影响代码的工作进度,所以 一个好的数据库设计人员,除了根据业务的操作设计出数 ...
- C++的二进制兼容问题(以QT为例)
二进制不兼容带来的问题(需要重新编译库文件,以前编译的失效): http://my.oschina.net/lieefu/blog/505363?fromerr=f5jn7rct 二进制不兼容的原理: ...