
13个JavaScript图表(JS图表)图形绘制插件
转自:http://blog.jobbole.com/13671/
1. Flash 过去是最佳解决方案,但很多人多在从那迁移;
2. 现代浏览器及其更强大的计算能力,使其在转化绘制实时数据方面的能力更佳;
3. 绘制矢量图的不同技术愈发成熟:VML、SVG 和 Canvas。
当然了,你需要仔细选择,以符合自身需求。正如前面提到的,正因使用了各种技术,因此一些支持Canvas的插件仅需要一个现代浏览器。
在这篇文章中,我们已收集 13 个JavaScript图表和图形绘制插件。少数是独立的框架,大多数支持条图、线图、饼图等基本图形,很多甚至支持更加复杂的图形,比如:维恩图、热图、进化树、二维散点图、二维散点气泡图、三维散点图等。相信你应当能在这个列表中找到所需的。
1. Flotr2

Flotr2 是个独立框架库,支持HTML5图表和图形。它是 flotr 的一个分支版本,移除了 Prototype 依赖性,并且有很多改进。支持:线图、条图、蜡状图、饼图、气泡图。诸如 IE6 类的老浏览器也支持。
2. Rickshaw

Rickshaw 是个用于创建交互式时序图的JS工具。它依赖 D3 可视化库和其他一些 jQuery 和 jQuery UI 的插件。
3. D3
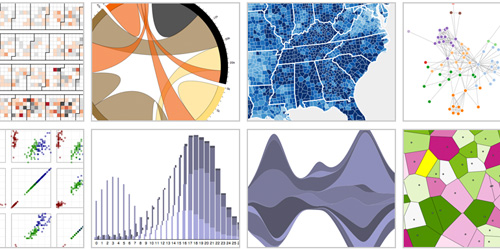
D3 是一款著名且高效的可视化库。

AwesomeChartJS 是个简洁的JS库,用于基于HTML5画布元素的图表。
5. canvasXpress

CanvasXpress is a javascript library based on the tag implemented in HTML5. I developed this library as the core visualization component for our BMS systems biology platform. It supports crazy amount of highly complicated charts and graphs.
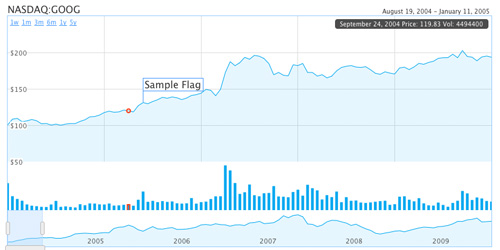
HumbleFinance is an HTML5 data visualization tool written as a demonstration of interactive graphing in HTML5. It is similar to the Flash tool on http://finance.google.com/. The tool itself is written entirely in JavaScript, using the Prototype and Flotr libraries. It can be used to display any two 2-D data sets of real numerical data which share an axis.
7. RGraph
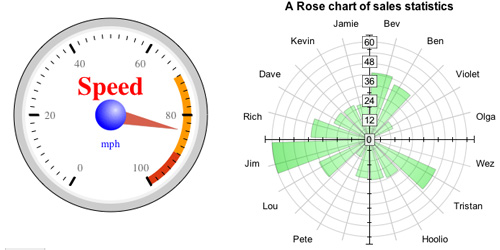
RGraph is a HTML5 Javascript charts library that supports over 20 different types of charts. Using the new HTML5 canvas tag, RGraph creates these Javascript charts in the web browser, meaning quicker pages and less web server load. Using RGraph is an easy way of speeding up your website.
8. dygraphs

dygraphs is an open source JavaScript library that produces produces interactive, zoomable charts of time series. It is designed to display dense data sets and enable users to explore and interpret them. This is a lightweight solution and works in Internet explorer too.
9. HighChart
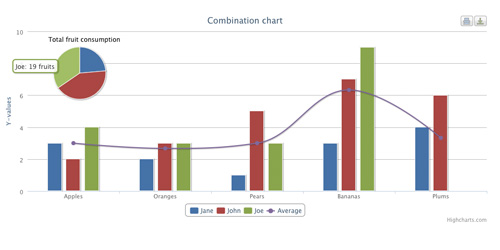
Highcharts is a charting library written in pure JavaScript, offering intuitive, interactive charts to your web site or web application. Highcharts currently supports line, spline, area, areaspline, column, bar, pie and scatter chart types. A famous chart/graph solution used by many well-known organization such as IBM, NASA, Siemens, HP etc.
10. gRaphael

gRaphaël’s goal is to help you create stunning charts on your website. It is based on Raphaël graphics library. Check out the demos to see static and interactive charts in action. gRaphaël currently supports Firefox 3.0+, Safari 3.0+, Opera 9.5+ and Internet Explorer 6.0+.
11. jqPlot

jqPlot is a plotting and charting plugin for the jQuery Javascript framework. jqPlot produces beautiful line, bar and pie charts with many features.
12. JS Charts

JS Charts is a JavaScript based chart generator that requires little or no coding. With JS Charts drawing charts is a simple and easy task, since you only have to use client-side scripting (i.e. performed by your web browser). No additional plugins or server modules are required. Just include our scripts, prepare chart data in XML, JSON or JavaScript Array and your chart is ready!
13. JSXGraph

JSXGraph is a cross-browser library for interactive geometry, function plotting, charting, and data visualization in a web browser. It is implemented completely in JavaScript, does not rely on any other library, and uses SVG, VML, or canvas. JSXGraph is easy to embed and has a small footprint: less than 100 KByte if embedded in a web page. No plug-ins are required! Special care has been taken to optimize the performance.
原文:Kevin Liew 编译:伯乐在线 – 黄利民
13个JavaScript图表(JS图表)图形绘制插件的更多相关文章
- 13个JavaScript图表(JS图表)图形绘制插件【转】
现在网络上又有越来越多的免费的(JS 图表)JavaScript图表图形绘制插件.我之前给一家网站做过复杂的图形,我们用的是 highchart.在那段时间,没有很多可供选择的插件.但现在不同了,很容 ...
- 【转】13个JavaScript图表(JS图表)图形绘制插件
现在网络上又有越来越多的免费的(JS 图表)JavaScript图表图形绘制插件.我之前给一家网站做过复杂的图形,我们用的是 highchart.在那段时间,没有很多可供选择的插件.但现在不同了,很容 ...
- SVG.js 基础图形绘制整理(二)
一.折线 var draw = SVG('svg1').size(300, 300); //画折线 //使用字符串点 // var polyline=draw.polyline('0,0 100,50 ...
- SVG.js 基础图形绘制整理(一)
一.矩形 //指定width和height 画矩形 //返回rect对象 var draw = SVG('svg1').size(300, 300); var rect = draw.rect(100 ...
- 转-——推荐几个web中常用的一些js图表插件 - zccst
http://www.tuicool.com/articles/bqq2Qn 作者:zccst 我自己用过fusioncharts和highchart. jQuery插件有: TufteGraph f ...
- 推荐几个web中常用js图表插件
作者:zccst 我自己用过fusioncharts和highchart. jQuery插件有: TufteGraph flot js charts jqchart elycharts jquery ...
- 免费而优秀的图表JS插件
1.百度的Echart ECharts,缩写来自Enterprise Charts,是百度推出的一款开源的,商业级数据图表,它最初是为了满足百度公司商业体系里各种业务系统(如凤巢.广告管家等等)的报表 ...
- 推荐12个最好的 JavaScript 图形绘制库
众多周知,图形和图表要比文本更具表现力和说服力.图表是数据图形化的表示,通过形象的图表来展示数据,比如条形图,折线图,饼图等等.可视化图表可以帮助开发者更容易理解复杂的数据,提高生产的效率和 Web ...
- 转:几款免费的图表js插件
1,ichartjs(国产)(http://www.ichartjs.com/) ===============强烈推荐ichartjs是一款优秀的国产开源插件,作者是王鹤,英文名taylor,毕业 ...
随机推荐
- WPF笔记(1.8 资源与映射)——Hello,WPF!
原文:WPF笔记(1.8 资源与映射)--Hello,WPF! 终于,看明白了,已经是凌晨1:39分.这本书这一节写得实在是不好,一个local搞得我糊里糊涂,于是,准备按照他的思路,按照我的理解,改 ...
- fragment点击跳转到外部Activity后,怎么通过返回按钮返回
楼主的情况应该是比较简单的吧,跟三楼说的一样,只要在D跳到下一个Activity的时候,D所在的Activity不要调用finish(),然后在下一个Activity关闭的时候直接调用finish() ...
- 【转】如何定制android源码的编译选项 & 后期安装? ---- 不错
原文网址:http://blog.sina.com.cn/s/blog_3e3fcadd0100z3o9.html Android编译过程比较长,配置起来也很麻烦.现仅就工作遇到的问题做个总结.所用硬 ...
- UESTC_秋实大哥带我飞 2015 UESTC Training for Graph Theory<Problem B>
B - 秋实大哥带我飞 Time Limit: 300/100MS (Java/Others) Memory Limit: 65535/65535KB (Java/Others) Submit ...
- HDU 4614 Vases and Flowers (2013多校第二场线段树)
题意摘自:http://blog.csdn.net/kdqzzxxcc/article/details/9474169 ORZZ 题意:给你N个花瓶,编号是0 到 N - 1 ,初始状态花瓶是空的,每 ...
- .Net语言中关于AOP 的实现详解
来源: IT人家 发布时间: 2011-03-22 20:28 阅读: 3546 次 推荐: 2 原文链接 [收藏] 摘要:该文章主要和大家讲解开发应用系统时在.Net语言中关于AOP ...
- ID(dfs+bfs)-hdu-4127-Flood-it!
题目链接: http://acm.hdu.edu.cn/showproblem.php?pid=4127 题目意思: 给n*n的方格,每个格子有一种颜色(0~5),每次可以选择一种颜色,使得和左上角相 ...
- 【快速选择算法与nth_element函数】【续UVA11300 】
在白书中提到了一种O(n)级别的寻找中位数算法 就是我们今天要介绍的主角 快速选择算法 类似快排 选择一个比较元素 进行递归处理寻找第k大元素 假设最后比较元素到了i 以下描述是我写快排的常用字符 所 ...
- CentOS 7.0 systemd代替service
CentOS 7.0中一个最主要的改变,就是切换到了systemd.它用于替代红帽企业版Linux前任版本中的SysV和Upstart,对系统和服务进行管理.systemd兼容SysV和Linux标准 ...
- Android显示系统设计框架介绍
1. Linux内核提供了统一的framebuffer显示驱动,设备节点/dev/graphics/fb*或者/dev/fb*,以fb0表示第一个显示屏,当前实现中只用到了一个显示屏. 2. Andr ...