matplotlib画图
matplotlib画图
import numpy as np
import matplotlib.pyplot as plt
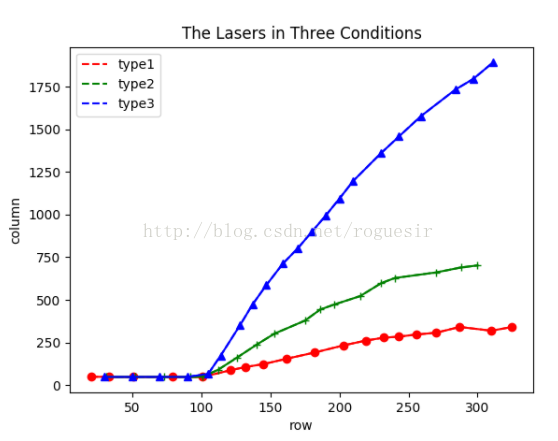
x1=[20,33,51,79,101,121,132,145,162,182,203,219,232,243,256,270,287,310,325]
y1=[49,48,48,48,48,87,106,123,155,191,233,261,278,284,297,307,341,319,341]
x2=[31,52,73,92,101,112,126,140,153,175,186,196,215,230,240,270,288,300]
y2=[48,48,48,48,49,89,162,237,302,378,443,472,522,597,628,661,690,702]
x3=[30,50,70,90,105,114,128,137,147,159,170,180,190,200,210,230,243,259,284,297,311]
y3=[48,48,48,48,66,173,351,472,586,712,804,899,994,1094,1198,1360,1458,1578,1734,1797,1892]
x=np.arange(20,350)
l1=plt.plot(x1,y1,'r--',label='type1')
l2=plt.plot(x2,y2,'g--',label='type2')
l3=plt.plot(x3,y3,'b--',label='type3')
plt.plot(x1,y1,'ro-',x2,y2,'g+-',x3,y3,'b^-')
plt.title('The Lasers in Three Conditions')
plt.xlabel('row')
plt.ylabel('column')
plt.legend()
plt.show()
# -*- coding: UTF-8 -*-
import numpy as np
import matplotlib as mpl
import matplotlib.pyplot as plt #这里导入你自己的数据
#......
#......
#x_axix,train_pn_dis这些都是长度相同的list() #开始画图
sub_axix = filter(lambda x:x%200 == 0, x_axix)
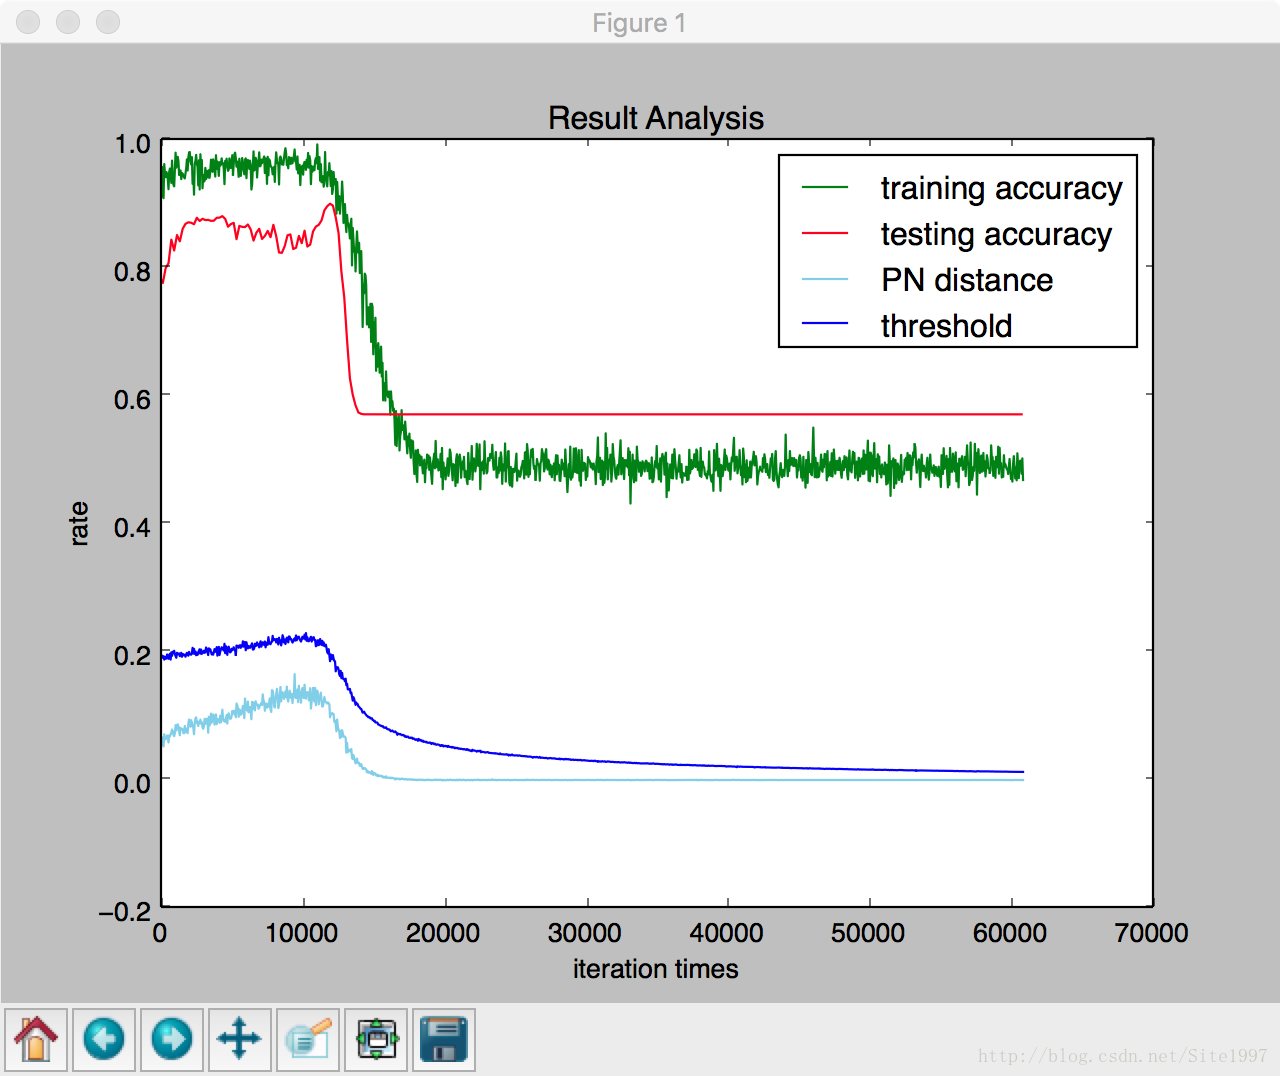
plt.title('Result Analysis')
plt.plot(x_axix, train_acys, color='green', label='training accuracy')
plt.plot(sub_axix, test_acys, color='red', label='testing accuracy')
plt.plot(x_axix, train_pn_dis, color='skyblue', label='PN distance')
plt.plot(x_axix, thresholds, color='blue', label='threshold')
plt.legend() # 显示图例 plt.xlabel('iteration times')
plt.ylabel('rate')
plt.show()
#python 一个折线图绘制多个曲线
matplotlib画图的更多相关文章
- python matplotlib画图产生的Type 3 fonts字体没有嵌入问题
ScholarOne's 对python matplotlib画图产生的Type 3 fonts字体不兼容,更改措施: 在程序中添加如下语句 import matplotlib matplotlib. ...
- 使用python中的matplotlib 画图,show后关闭窗口,继续运行命令
使用python中的matplotlib 画图,show后关闭窗口,继续运行命令 在用python中的matplotlib 画图时,show()函数总是要放在最后,且它阻止命令继续往下运行,直到1.0 ...
- matplotlib 画图
matplotlib 画图 1. 画曲线图 Tompson = np.array([0, 0, 0, 0, 0.011, 0.051, 0.15, 0.251, 0.35, 0.44, 0 ...
- python3 使用matplotlib画图出现中文乱码的情况
python3使用matplotlib画图,因python3默认使用中unicode编码,所以在写代码时不再需要写 plt.xlabel(u’人数’),而是直接写plt.xlabel(‘人数’). 注 ...
- matplotlib画图实例:pyplot、pylab模块及作图參数
http://blog.csdn.net/pipisorry/article/details/40005163 Matplotlib.pyplot画图实例 {使用pyplot模块} matplotli ...
- python使用matplotlib画图
python使用matplotlib画图 matplotlib库是python最著名的画图库.它提供了一整套和matlab类似的命令API.十分适合交互式地进行制图. 先介绍了怎样使用matplotl ...
- matplotlib画图报错This figure includes Axes that are not compatible with tight_layout, so results might be incorrect.
之前用以下代码将实验结果用matplotlib show出来 plt.plot(np.arange(len(aver_reward_list)), aver_reward_list) plt.ylab ...
- matplotlib画图出现乱码情况
python3使用matplotlib画图,因python3默认使用中unicode编码,所以在写代码时不再需要写 plt.xlabel(u’人数’),而是直接写plt.xlabel(‘人数’). 注 ...
- python使用matplotlib画图,jieba分词、词云、selenuium、图片、音频、视频、文字识别、人脸识别
一.使用matplotlib画图 关注公众号"轻松学编程"了解更多. 使用matplotlib画柱形图 import matplotlib from matplotlib impo ...
随机推荐
- 洛谷 P1083 借教室
传送门:Probem 1083 https://www.cnblogs.com/violet-acmer/p/9721160.html 一.暴力简述 首先我们不难看出,这道题--并不是一道多难的题,因 ...
- SQL Server 2008 数据库回滚到某个时间点
数据库回滚到时间的的前提: 事务日志完整,数据库在完整恢复模式下进行过一次完整备份,数据库没有进行过还原操作(惨痛教训). 当数据库误操作时,切记冷静,不然问题就是滚雪球, 在不做下一步错误前 可观 ...
- grafana-zabbix部署和使用
grafana-zabbix安装 官网安装介绍地址:https://grafana.com/plugins/alexanderzobnin-zabbix-app/installation 下载地址:h ...
- selenium_基本用法
Python爬虫视频教程零基础小白到scrapy爬虫高手-轻松入门 https://item.taobao.com/item.htm?spm=a1z38n.10677092.0.0.482434a6E ...
- 记录一次iptables端口转发的配置
需求是公网访问2.2.2.22的80端口,直接转发到内网的192.100.100.178的80端口上. 代理服务器的,两个不同的网卡 eth0 2.2.2.22 eth1 192.100.100.10 ...
- Unity做AR
Unity做AR呢这里借助了高通的AR包 这里是视频教程 http://www.tudou.com/programs/view/dnvEbIubNzI/ 这里是结果演示 http://www.tu ...
- 多目标遗传算法 ------ NSGA-II (部分源码解析)二元锦标赛选择 tourselect.c
tourselect.c 文件中共有两个函数: selection (population *old_pop, population *new_pop) individual* tournament ...
- python---tornado初识(2)实现登录和发布文章
# coding:utf8 # __author: Administrator # date: 2018/3/6 0006 # /usr/bin/env python import tornado.i ...
- gitlab与pycharm结合
一切都在图中 点开pycharm里的菜单选项 设置git代码仓库的地址 修改了代码之后,如何推送到git服务器上 通过pycharm下载代码仓库 pycharm中如何设置分支 pycharm新建了分支 ...
- POJ - 1426 Find The Multiple(搜索+数论)
转载自:優YoU http://user.qzone.qq.com/289065406/blog/1303946967 以下内容属于以上这位dalao http://poj.org/problem? ...