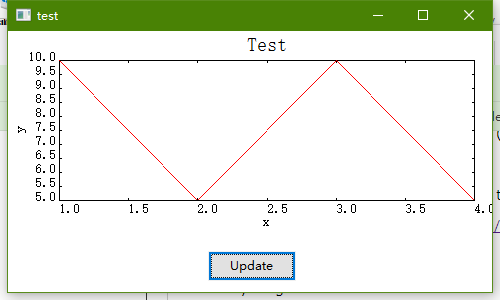
wxpython绘制折线图
environment:win10 + eclipse + pydev + python2.7.11 + wxpython3.0.2
code sample:
 #!/usr/bin/env python

 # -*- coding: UTF-8 -*-

 import wx

 import wx.lib.plot as plot

 class MyFrame(wx.Frame):

     def __init__(self):

         self.frame1 = wx.Frame(None, title="test", id=-1, size=(500, 300))

         self.panel1 = wx.Panel(self.frame1)

         self.panel1.SetBackgroundColour("white")

         Button1 = wx.Button(self.panel1, -1, "Update", (200,220))

         Button1.Bind(wx.EVT_BUTTON, self.redraw)

         plotter = plot.PlotCanvas(self.panel1)

         plotter.SetInitialSize(size=(500, 200))

         data= [[1, 10], [2, 5], [3,10], [4, 5]]

         line= plot.PolyLine(data, colour='red', width=1)

         gc= plot.PlotGraphics([line], 'Test', 'x', 'y')

         plotter.Draw(gc)

         self.frame1.Show(True)

     def redraw(self, event):

         plotter = plot.PlotCanvas(self.panel1)

         plotter.SetInitialSize(size=(500, 200))

         data2= [[1, 20], [2, 15], [3,20], [4, -10]]

         line= plot.PolyLine(data2, colour='red', width=1)

         gc= plot.PlotGraphics([line], 'Test', 'x', 'y')

         plotter.Draw(gc)

 app = wx.PySimpleApp()

 f = MyFrame()

 app.MainLoop()
error 1:raise ImportError("NumPy not found.\n" + msg)
solution: run console with"cmd", and run 'pip install numpy'.
error 2:TypeError: Required argument 'type' (pos 2) not found
solution:that's A BUG with wx3.0.2!
patch the latest wx.lib.plot can totally solve that.
url:https://github.com/wxWidgets/wxPython/commit/30bc07d80ae1c81d70b4de2daac62ecd7996d703
now everything is fine!
转载注明出处:http://www.cnblogs.com/ityoung/
github: https://github.com/ityoung
wxpython绘制折线图的更多相关文章
- 用canvas绘制折线图
<!DOCTYPE html> <html lang="en"> <head> <meta charset="UTF-8&quo ...
- php中用GD绘制折线图
php中用GD绘制折线图,代码如下: Class Chart{ private $image; // 定义图像 private $title; // 定义标题 private $ydata; // 定 ...
- UUChart的使用--iOS绘制折线图
UUChart是一个用于绘制图表的第三方,尤其适合去绘制折线图. 二.下载地址: https://github.com/ZhipingYang/UUChartView 三.使用 第一步.首先我们将下载 ...
- html5绘制折线图
html5绘制折线图详细代码 <html> <canvas id="a_canvas" width="1000" height="7 ...
- Android自己定义组件系列【9】——Canvas绘制折线图
有时候我们在项目中会遇到使用折线图等图形,Android的开源项目中为我们提供了非常多插件,可是非常多时候我们须要依据详细项目自己定义这些图表,这一篇文章我们一起来看看怎样在Android中使用Can ...
- JFreeChart绘制折线图实例
JFreeChart是JAVA平台上的一个开放的第三方图表绘制类库.只要下载JFreeChart的类库,导入项目即可使用.下面是一个绘制折线图的实例.各处注释都已经写的比较清晰了. package c ...
- 【带着canvas去流浪】(2)绘制折线图
目录 一. 任务说明 二. 重点提示 三. 示例代码 3.1 一般折线图 3.2 用贝塞尔曲线绘制平滑折线图 四. 大数据量场景 示例代码托管在:https://github.com/dashnowo ...
- python使用matplotlib绘制折线图教程
Matplotlib是一个Python工具箱,用于科学计算的数据可视化.借助它,Python可以绘制如Matlab和Octave多种多样的数据图形.下面这篇文章主要介绍了python使用matplot ...
- 用PNChart绘制折线图
写在前面 上一篇文章已经介绍过用PNChart绘制饼状图了,绘制折线图的步骤和饼状图的步骤是相似的,按照中的准备做好准备工作后就可以绘制折线图了. 开始使用 1.在view中声明一个PNLineCha ...
随机推荐
- MSSQL远程连接
背景:部署公司自己研发的ERP系统. 1)系统架构: .NET+MSSQL. 2)服务器系统:Windows Server 2008 R2 Enterprise 3)数据库:MSSQL Server ...
- IE7,6与Fireofx的CSS兼容性处理方法集结
CSS对浏览器的兼容性有时让人很头疼,尤其是对于IE6这个问题多多的浏览器版本,从网上收集了IE7,6与Fireofx的兼容性处理方法并整理了一下.对于web2.0的过度,请尽量用xhtml格式写代码 ...
- SharePoint 部署时报错: 未能提取此解决方案中的cab文件
在vs里右击SharePoint项目,选择"部署",结果报错: Error occurred in deployment step 'Add Solution':Fail to e ...
- android 帧动画,补间动画,属性动画的简单总结
帧动画——FrameAnimation 将一系列图片有序播放,形成动画的效果.其本质是一个Drawable,是一系列图片的集合,本身可以当做一个图片一样使用 在Drawable文件夹下,创建ani ...
- 【原】HTTP in iOS你看我就够
声明:本文是本人 编程小翁 原创,转载请注明. 本文同步发布在简书中,强烈建议移步简书查看,编程小翁 HTTP属于老话题了,在项目中我们经常需要往服务端发POST或者GET请求,但是对于HTTP的了解 ...
- Oracle学习笔记十一 游标
游标的简介 游标的概念 游标是从数据表中提取出来的数据,以临时表的形式存放在内存中,在游标中有一个数据指针,在初始状态下指向的是首记录,利用fetch语句可以移动该指针,从而对游标中的数据进行各种操作 ...
- 使用httpclient发送get或post请求
HttpClient 是 Apache Jakarta Common 下的子项目,可以用来提供高效的.最新的.功能丰富的支持 HTTP 协议的客户端编程工具包,并且它支持 HTTP 协议最新的版本和建 ...
- Don't repeat yourself
今天工作上要测试不同版本mysql在不同系统的速度,学习了怎么源码安装mysql后,就开始敲命令安装和编译执行测试程序. 这么走了两遍后,想起一句话——当一件事重复做三遍后,要考虑把它工具化,自动化. ...
- Struts2入门案例
struts2最简便的案例 Struts 2是一个MVC框架,以WebWork框架的设计思想为核心,吸收了Struts 1的部分优点.Struts 2拥有更加广阔的前景,自身功能强大,还对其他框架 ...
- 理解HTML语义化
1.什么是HTML语义化? <基本上都是围绕着几个主要的标签,像标题(H1~H6).列表(li).强调(strong em)等等> 根据内容的结构化(内容语义化),选择合适的标签(代码语义 ...