监控服务器配置(二)-----Grafana安装配置
1.下载grafana安装包(linux版)到 /opt/minitor/grafana 。
下载地址:https://download.csdn.net/download/a15565772151/11111935
可以私聊我一下我发你资源
2.运行 tar -zxvf grafana-5.3.4.linux-amd64.tar.gz ,解压文件到当前目录。
3.进入 /opt/minitor/grafana/grafana-5.3.4/bin目录,执行一下命令启动grafana:
systemctl start grafana-server      : 启动grafana

systemctl stop grafana-server       : 停止grafana

systemctl restart grafana-server    : 重启grafana
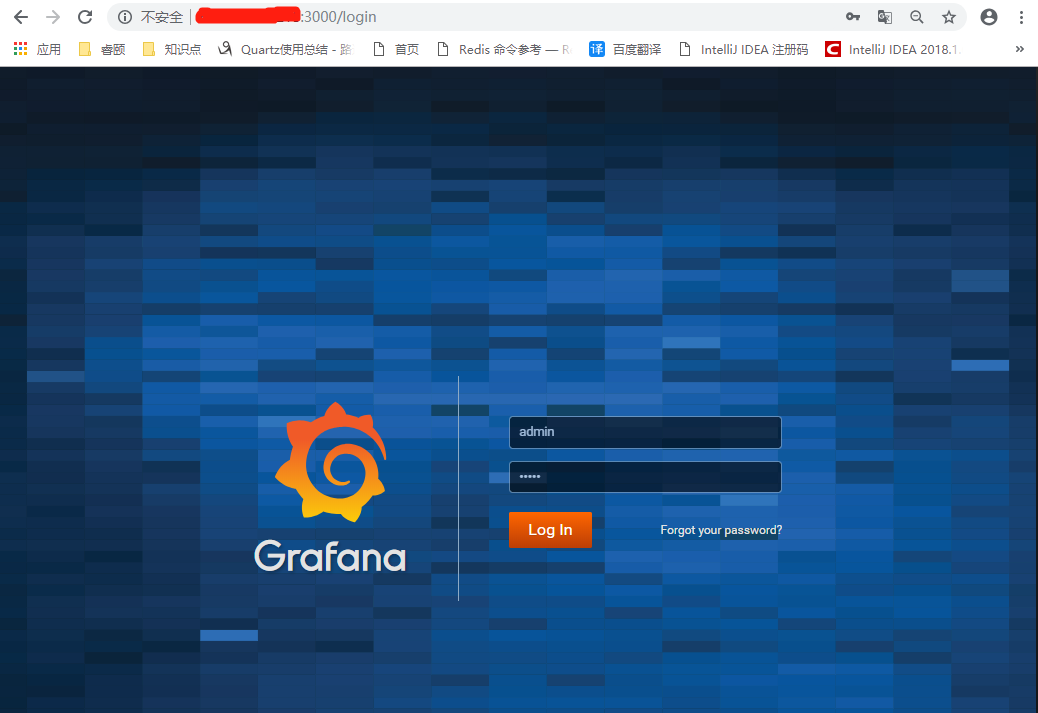
4.grafana默认端口号为3000,默认的用户名密码为admin/admin
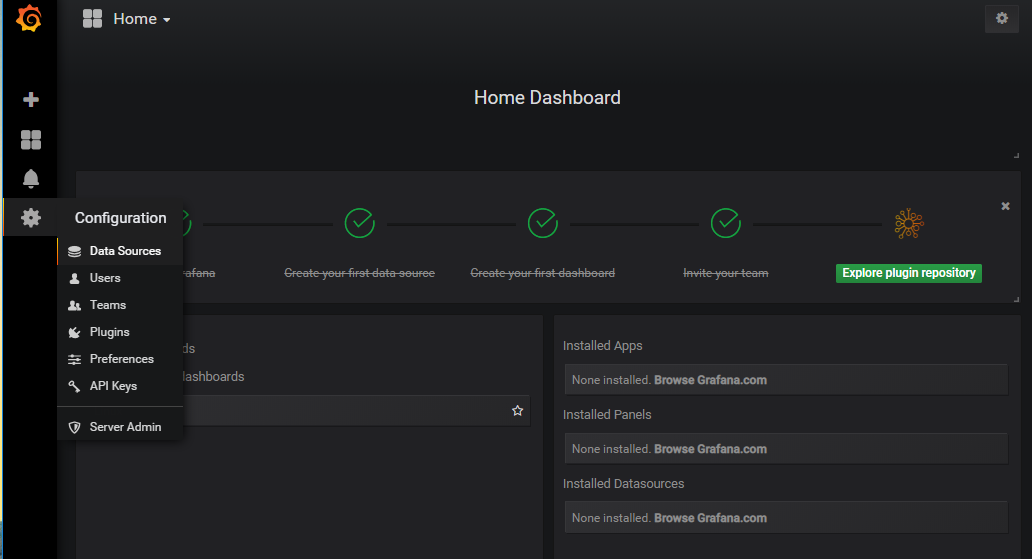
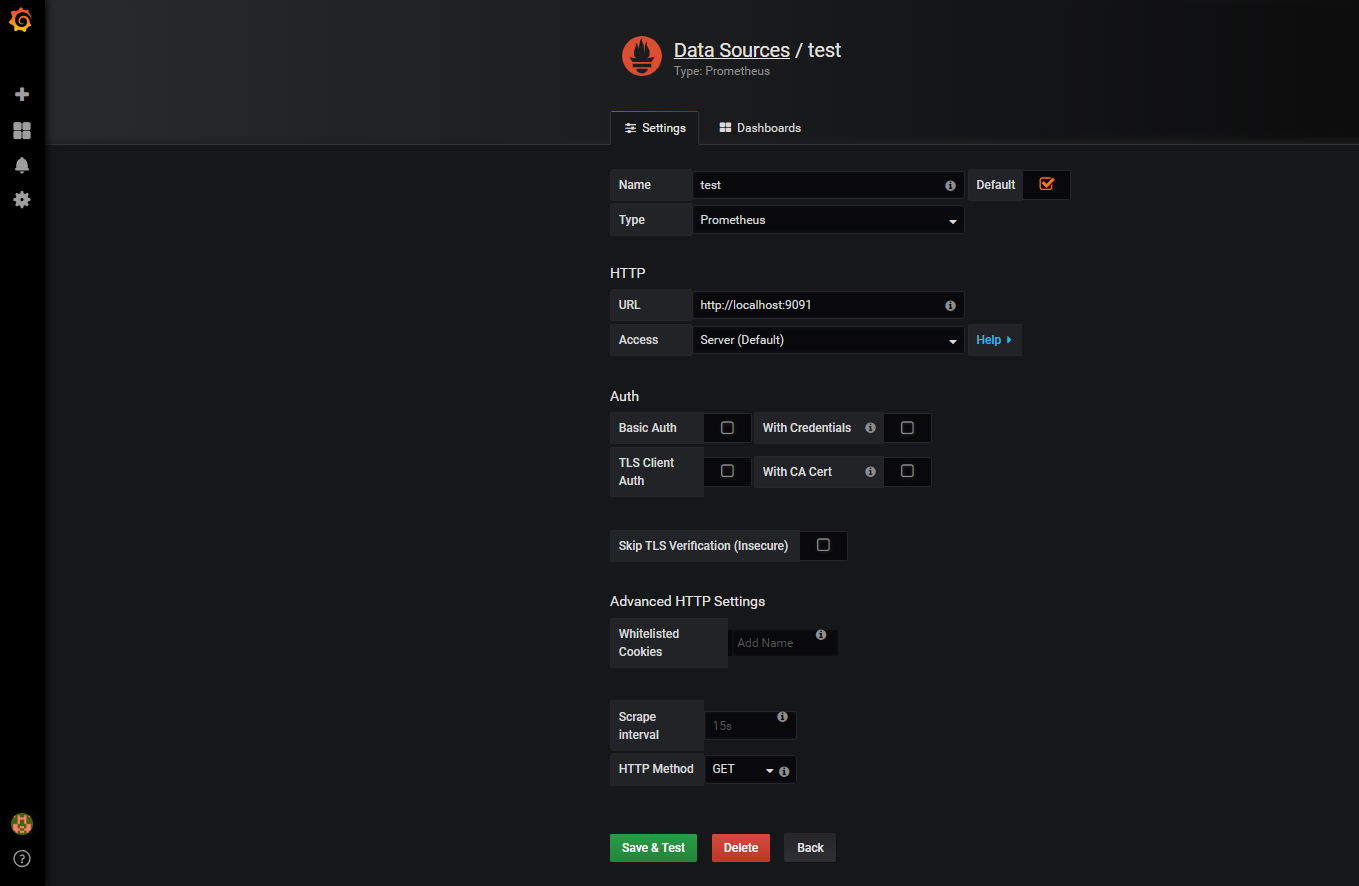
5.登录成功后,设置数据源
几个重要的参数:
Name : 可以自定义

Type : 选Prometheus

URL : prometheus所在服务器ip地址+端口号

HTTP Method : GET
#################################### Anonymous Auth ##########################

[auth.anonymous]

# enable anonymous access

;enabled = false

# specify organization name that should be used for anonymous users

;org_name = Main Org.

# Specify role for anonymous users. Defaults to Viewer, other valid options are Editor and Admin

;org_role = Viewer
监控服务器配置(二)-----Grafana安装配置的更多相关文章
- 监控服务器配置(四)-----OracleDb_exporter安装配置
1.下载oracle客户端安装包(linux版)到 /opt/minitor/oracleDb . 下载地址:https://download.csdn.net/download/a155657721 ...
- 监控服务器配置(三)-----Node_exporter安装配置
此安装主要是为了监控服务器运行状况 1.下载node_exporter安装包(linux版)到 /opt/minitor/node_exporter . 下载地址:https://download.c ...
- 监控服务器配置(一)-----Prometheus安装配置
最近和朋友一起做的监控配置,拿出来共享一下 1.下载prometheus安装包(linux版)到 /opt/minitor/prometheus . 下载地址:https://download.csd ...
- 监控服务器配置(五)-----Redis_exporter安装配置
1.下载redis_exporter安装包(linux版)到 /opt/minitor/redis_exporter . 下载地址:https://download.csdn.net/download ...
- Prometheus(一):Prometheus+Grafana 安装配置
一.基础环境 系统 IP 监控主机 CentOS 7 192.168.56.200 被监控主机 CentOS 7 192.168.56.201 二.Prometheus服务端安装 以下操作皆在监控主机 ...
- grafana 安装配置
Grafana安装配置 1.下载安装包 wget https://s3-us-west-2.amazonaws.com/grafana-releases/release/grafana-5.1.3.l ...
- Hadoop 系列(二)安装配置
Hadoop 系列(二)安装配置 Hadoop 官网:http://hadoop.apache.or 一.Hadoop 安装 1.1 Hadoop 依赖的组件 JDK :从 Oracle 官网下载,设 ...
- Jmeter+ InfluxDB+Grafana安装配置
前置条件: 系统:windows jmeter:5.1 InfluxDB安装 下载InfluxDB-v1.7.9和Chronograf-v1.7.14(InfluxDB的可视化web端). 下载完成之 ...
- influxDB+grafana安装配置及邮件告警发送配置
1. InfluxDB安装 下载包并解压: $:wgethttps://dl.influxdata.com/influxdb/releases/influxdb-1.3.6_linux_amd64.t ...
随机推荐
- 学习MeteoInfo二次开发教程(十一)
1.新添加状态栏ToolStrip,可能名称为toolStripStatusLabel2 这时需要把TSSL_Coord改为toolStripStatusLabel2 2.SetMapView();语 ...
- JS面试Q&A(续2): Rest parameter,Arrow function 等
rest parameter 和 Destructuring assignment. function fun1(...theArgs) { console.log(theArgs.length);} ...
- SpringBoot+Mybatis+Maven+MySQL逆向工程实现增删改查
SpringBoot+Mybatis+MySQL+MAVEN逆向工程实现增删改查 这两天简单学习了下SpringBoot,发现这玩意配置起来是真的方便,相比于SpringMVC+Spring的配置简直 ...
- MQTT项目请求设置
MQTT项目请求设置:XMLHttpRequest WithCredentials 1.如果在发送来自其他域的XMLHttpRquest请求之前,未设置withCredentiaals为true,那么 ...
- Spark启动报错|java.io.FileNotFoundException: File does not exist: hdfs://hadoop101:9000/directory
at org.apache.spark.deploy.history.FsHistoryProvider.<init>(FsHistoryProvider.scala:) at org.a ...
- Windows2008R2操作系统日志清理
Windows日志路径 c:/windows/system32/winevt/logs
- Tools:实现ping操作带时间戳【windows+linux】
[windows下]: ping.vbs Dim args, flag, unsuccOut args="" otherout="" flag= If WScr ...
- zabbix3.0.4 探索主机Discovery自动发现agent主机和zabbix-agent自动注册详细图文教程
Zabbix 自动发现(Discovery)功能使用 随着监控主机不断增多,有的时候需要添加一批机器,特别是刚用zabbix的运维人员需要将公司的所有服务器添加到zabbix,如果使用传统办法去单个添 ...
- java面试题复习(七)
61.jdbc的操作步骤 加载驱动:Class.forName("oracle.jdbc.driver.OracleDriver"); 创建连接:Connection con =D ...
- Spring-表达式语言
概念及作用 Spring表达式语言全称为“Spring Expression Language”,缩写为“SPEL”,类似于Struts2x中使用的OGNL表达式语言,能在运行时构建复杂表达式.存取对 ...