
Statistical Concepts and Market Returns
Statistical Concepts and Market Returns
Categories of statistics
- Descriptive statistics: used to summarize the important characteristics of large data sets.
- Inferential statistics: pertain to the procedures used to make forecasts, estimates, or judgments about a large set of data on the basis of the statistical characteristics of a sample.
Measures of Central Tendency
When describing investments, measures of central tendency provide an indication of an investment's expected return.
- Arithmetic mean (算术平均)
- Geometric mean (几何平均): often used when calculating investment returns over multiple periods or when measuring compound growth rates.

- Weighted mean (加权平均)
- Median (中位数): the midpoint of a data set when the data is arranged in ascending or decending order.
- Mode (众数): the value that occurs most frequently in a data set. A data set may have more than one mode or even no mode.
- Harmonic mean(调和平均数/倒数平均数): used for certain computations, wuch as the average cost of shares purchased over time. 是总体各统计变量倒数的算术平均数的倒数
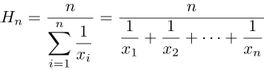
Note: The geometric mean is always less than or equal to the arithmetic mean, and the difference increases as the dispersion of the observations increases. The only time the arithmetic and geometric means are equal is when there is no variability in the observations (i.e. all observations are equal)
Note: For values that are not all equal: harmonic mean < geometric mean < arithmetic mean. This mathematical fact is the basis for the claimed benefit of purchasing the same dollar amount of mutual fund shares each month or each week. Some refer to this practice as "dollar cost averaging"
Note: modal interval: for any frequency distribution, the interval with the greatest frequency is referred to as the modal interval. 模式区间:发生频率最高的区间。
均值(mean)和平均值(average)在很多情况下可以不加区分地使用,但是两者还是有所区别:1)样本的“均值”是根据上面的算术平均公式计算得出2)"平均值"是若干种可以描述样本的典型值或集中趋势(central tendency)的汇总统计量之一。
Measures of Dispersion
When describing investment, measures of dispersion indicate the riskiness of an investment.
Dispersion is defined as the variability around the central tendency. The common theme in finance and investmentss is the tradeoff between reward and variability, where the central tendency is the measure of the reward and dispersion is a measure of risk.
Range (范围): range = maximum value - minimum value
Mean absolute deviation (MAD/平均绝对偏差): the average of the absolute values of the deviations of individual observations from the arithmetic mean.
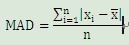
Variance (方差):
Standard Deviation(标准差):
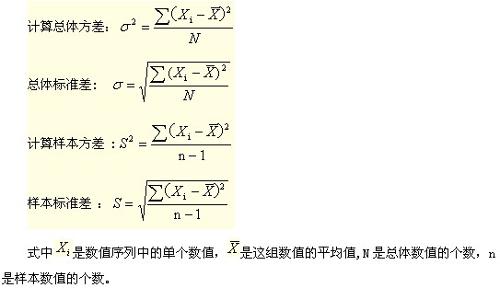
Note: The most noteworthy difference from the formula for population variance is that the denominator for s^2 is n-1, one less than the sampe size n, where σ^2 uses the entire population size N. Based on the mathematical theory behind statistical procedures, the use of the entire number of sample observations, n instead of n-1 as the divisor in the commputation of s^2, will systematically underestimate the population parameter σ^2, particular for small sample sizes. This sysmatic underestimation causes the same variance to be what is referrerd to as biased estimator of the population variance. Using n-1 instead of n iin the denominator, however, improves the statistical properties of s^2 as an estimator of σ^2. Thus, s^2 is considdered to be an unbiased estimator of σ^2.
Chebyshev's Inequality
Chebyshev's inequality(切比雪夫不等式) states that for any set of observations, whether sample or population data and regardless of the shape of the distribution, the percentage of the observations that lie within k standard deviations of the mean is at least 1-1/k^2 for k > 1.
The importance of Chebyshev's inequality is that is applies to any distribution.
Coefficient of Variation (变异系数/离散系数)
Relative disperation is the amount of variability in a distribution relative to a reference point or benchmark. Relative disperation is commonly measured with the coefficient of vairation(CV).
离散系数,离散系数又称变异系数,是统计学当中的常用统计指标,主要用于比较不同水平的变量数列的离散程度及平均数的代表性。
CV = (standard devition of x)/(average value of x)
CV measures the amount of dispersion in a distribution relative to the distribution's mean. In an investments setting, the CV is used to measure the risk(variability) per unit of expected return(mean).
Sharpe Ratio
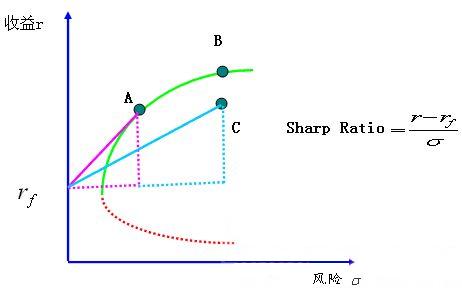
The Sharpe measure(a.k.a., the Sharpe ratio or reward-to-variability ratio) is widely used for investment performance measurement and measures excess return per unit of risk.
夏普比率: 反应风险及回报的比率。测量组合回报的风险,将高于无风险回报的部分除以某一时段内的标准差,得出的结果就是每一单位风险产生的超额回报。比率越高,调整风险后的回报越高。
Skewness(偏度)
Skewness, or skew, refers to the extent to which a distribution is not sysmmetrical. Nonsysmmetrical distributions may be either positively or negatively skewe and result from the occurrence of outliers in the data set. Outliers are observations with extraordinarily large values, either positve or negative.
A positively skewed distribution is characterized by many outliers in the upper region or right tail. A positively skewed distribution is said to be skewed right because of its relatively long upper(right) tail.
A negatively skewed distribution has a disproportionately large amount of outliers that fall within its lower(left) tail. A negatively skewed distribution is said to be skewed left because of its lower tail.
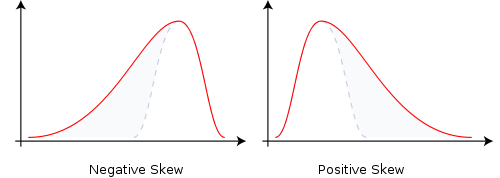
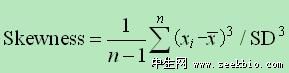
Values of Sk in excess of 0.5 in absolute value indicate significant levels of skewness.
Kurtosis(峰度)
Kurtosis is a measure of the degree to which a distribution is more or less "peaked" than a normal distribution. Leptokurtic(频率分配曲线的尖顶峰度) describes a distribution that is more peaked tha a normal distribution, whereas platykurtic (低峰态分布) refers to a distribution that is less peeked, or flatter than a normal distribution. A distribution is mesokurtic(常态峰) if it has the same kurtosis as a normal distribution.
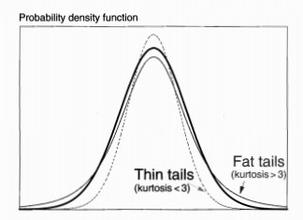
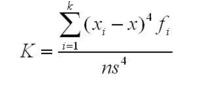
A distribution is said to exhibit excess kurtosis if it has either more or less kurtosis than the normal distribution. The computed kurtosis for all normal distribution is 3. A normal distribution has excess kurtosis equal to 0, a leptokurtic distribution has excess kurtosis greater than 0, and platykurtic distributions will have excess kurtosis less than 0.
In general, greater positive kurtosis and more negative skew in returns distributions indicates increased risk.
Excess kurtosis values that exceed 1.0 in absolute value are considered large.
excess kurtosis=sample kurtosis-3Statistical Concepts and Market Returns的更多相关文章
- QM3_Statistics Concepts and Market Returns
Basic Concepts Terms Descriptive Statistics Describes the important aspects of large data sets. 统计 概 ...
- AIMR 固定收益推荐读物
目录 AIMR Suggested Fixed-Income Readings I. Perspectives on Interest Rates and Pricing of Traditional ...
- SVD分解.潜语义分析.PythonCode
原文链接:http://www.cnblogs.com/appler/archive/2012/02/02/2335886.html 原始英文链接:http://www.puffinwarellc.c ...
- 潜在语义分析Latent semantic analysis note(LSA)原理及代码
文章引用:http://blog.sina.com.cn/s/blog_62a9902f0101cjl3.html Latent Semantic Analysis (LSA)也被称为Latent S ...
- Variance Inflation Factor (VIF) 方差膨胀因子解释_附python脚本
python信用评分卡(附代码,博主录制) https://study.163.com/course/introduction.htm?courseId=1005214003&utm_camp ...
- Quantitative Startegies for Achieving Alpha(二)
Chapter 3 The Day-To-Day Drivers Of Stock Market Returns Summary: (1) Earning growth is the primary ...
- An Introduction to Stock Market Data Analysis with R (Part 1)
Around September of 2016 I wrote two articles on using Python for accessing, visualizing, and evalua ...
- (转) Using the latest advancements in AI to predict stock market movements
Using the latest advancements in AI to predict stock market movements 2019-01-13 21:31:18 This blog ...
- Brief introduction to Scala and Breeze for statistical computing
Brief introduction to Scala and Breeze for statistical computing 时间 2013-12-31 03:17:19 Darren Wilk ...
随机推荐
- Opera Unit如何自定义My Opera的网页界面
1 双击Opera Unite Home进入你的个人主页 2 点击你的头像进入你的个人信息设置页面,然后点击右上角的设置图标 3 在下拉菜单中选择"Customize design" ...
- ZH奶酪:AngularJS判断checkbox/复选框是否选中并实时显示
最近做了一个选择标签的功能,把一些标签展示给用户,用户选择自己喜欢的标签,就类似我们在购物网站看到的那种过滤标签似的: 简单的效果如图所示: 首先看一下html代码: <!DOCTYPE htm ...
- Silverlight 之 断点调试
silverlight程序经常会遇到无法调试的情况,下面来总结解决方案. 一.问题描述 在Silverlight开发过程中,经常时不时的会碰到Silverlight无法调试的问题.如下几种情况: 1. ...
- 第十一节,命名空间namespace
1,命名空间的定义 命名空间可以把不同的方法分散到不同的文件去实现,如果你会objective-C,他的作用和里面的类目有异曲同工之妙.当然了也有很多不同的地方,首先要明白的是,命名空间并不是一个类, ...
- uni - 条件渲染
vue官方文档和uni官方同步:https://cn.vuejs.org/v2/guide/conditional.html 1.多次切换建议使用v-show(始终保存在BOM) 2.因为if是惰性判 ...
- Flask 源代码阅读笔记
我认为我已经养成了一个坏习惯.在使用一个框架过程中对它的内部原理非常感兴趣,有时候须要花不少精力才 明确,这也导致了学习的缓慢,但换来的是对框架的内部机理的熟悉,正如侯捷所说,源代码面前,了无秘密.这 ...
- PHP 循环
PHP 中的循环语句用于执行相同的代码块指定的次数. 循环 在您编写代码时,您经常需要让相同的代码块运行很多次.您可以在代码中使用循环语句来完成这个任务. 在 PHP 中,我们可以使用下列循环语句: ...
- GNU与Linux
GNU是自由软件之父 Richard Stallman在1984年组织开发的一个完全基于自由软件的软件体系,与此相应的有一分通用公共许可证(General Public License,简称GPL). ...
- webpack 生命周期
1.插件 可以安装lifecycle-webpack-plugin 插件来查看生命周期信息. 2.webpack流程(生命周期图) 地址:https://img.alicdn.com/tps/TB1G ...
- c语言转移符和三字母序列
三字母序列