Prometheus Node_exporter
Node Exporter
node_exporter 主要用于 *NIX 系统监控, 用 Golang 编写。
功能对照表
默认开启的功能
| 名称 | 说明 | 系统 |
|---|---|---|
| arp | 从 /proc/net/arp 中收集 ARP 统计信息 |
Linux |
| conntrack | 从 /proc/sys/net/netfilter/ 中收集 conntrack 统计信息 |
Linux |
| cpu | 收集 cpu 统计信息 |
Darwin, Dragonfly, FreeBSD, Linux |
| diskstats | 从 /proc/diskstats 中收集磁盘 I/O 统计信息 |
Linux |
| edac | 错误检测与纠正统计信息 | Linux |
| entropy | 可用内核熵信息 | Linux |
| exec | execution 统计信息 | Dragonfly, FreeBSD |
| filefd | 从 /proc/sys/fs/file-nr 中收集文件描述符统计信息 |
Linux |
| filesystem | 文件系统统计信息,例如磁盘已使用空间 |
Darwin, Dragonfly, FreeBSD, Linux, OpenBSD |
| hwmon | 从 /sys/class/hwmon/ 中收集监控器或传感器数据信息 |
Linux |
| infiniband | 从 InfiniBand 配置中收集网络统计信息 | Linux |
| loadavg | 收集系统负载信息 |
Darwin, Dragonfly, FreeBSD, Linux, NetBSD, OpenBSD, Solaris |
| mdadm | 从 /proc/mdstat 中获取设备统计信息 |
Linux |
| meminfo | 内存统计信息 |
Darwin, Dragonfly, FreeBSD, Linux |
| netdev | 网口流量统计信息,单位 bytes |
Darwin, Dragonfly, FreeBSD, Linux, OpenBSD |
| netstat | 从 /proc/net/netstat 收集网络统计数据,等同于 netstat -s |
Linux |
| sockstat | 从 /proc/net/sockstat 中收集 socket 统计信息 |
Linux |
| stat | 从 /proc/stat 中收集各种统计信息,包含系统启动时间,forks, 中断等 |
Linux |
| textfile | 通过 --collector.textfile.directory参数指定本地文本收集路径,收集文本信息 |
any |
| time | 系统当前时间 | any |
| uname | 通过 uname 系统调用, 获取系统信息 |
any |
| vmstat | 从 /proc/vmstat 中收集统计信息 |
Linux |
| wifi | 收集 wifi 设备相关统计数据 | Linux |
| xfs | 收集 xfs 运行时统计信息 | Linux (kernel 4.4+) |
| zfs | 收集 zfs 性能统计信息 | Linux |
默认关闭的功能
| 名称 | 说明 | 系统 |
|---|---|---|
| bonding | 收集系统配置以及激活的绑定网卡数量 | Linux |
| buddyinfo | 从 /proc/buddyinfo 中收集内存碎片统计信息 |
Linux |
| devstat | 收集设备统计信息 | Dragonfly, FreeBSD |
| drbd | 收集远程镜像块设备(DRBD)统计信息 | Linux |
| interrupts | 收集更具体的中断统计信息 | Linux,OpenBSD |
| ipvs | 从 /proc/net/ip_vs 中收集 IPVS 状态信息,从 /proc/net/ip_vs_stats 获取统计信息 |
Linux |
| ksmd | 从 /sys/kernel/mm/ksm 中获取内核和系统统计信息 |
Linux |
| logind | 从 logind 中收集会话统计信息 |
Linux |
| meminfo_numa | 从 /proc/meminfo_numa 中收集内存统计信息 |
Linux |
| mountstats | 从 /proc/self/mountstat 中收集文件系统统计信息,包括 NFS 客户端统计信息 |
Linux |
| nfs | 从 /proc/net/rpc/nfs 中收集 NFS 统计信息,等同于 nfsstat -c |
Linux |
| qdisc | 收集队列推定统计信息 | Linux |
| runit | 收集 runit 状态信息 | any |
| supervisord | 收集 supervisord 状态信息 | any |
| systemd | 从 systemd 中收集设备系统状态信息 |
Linux |
| tcpstat | 从 /proc/net/tcp 和 /proc/net/tcp6 收集 TCP 连接状态信息 |
Linux |
注意:我们可以使用 --collectors.enabled 运行参数指定 node_exporter 收集的功能模块, 如果不指定,将使用默认模块。
程序安装
下载地址:https://prometheus.io/download/#node_exporter
安装node exporter
tar -zxvf node_exporter-0.16.0.linux-amd64.tar.gz

mv node_exporter-0.16.0.linux-amd64 /usr/local/node_exporter
创建systemd服务
vim /etc/systemd/system/node_exporter.service

[Unit]

Description=node_exporter

After=network.target

[Service]

Type=simple

User=prometheus

ExecStart=/usr/local/node_exporter/node_exporter

Restart=on-failure

[Install]

WantedBy=multi-user.target
启动node_exporter
systemctl daemon-reload

systemctl start node_exporter

systemctl status node_exporter

systemctl enable node_exporter
验证启动成功
curl 127.0.0.1:9100

curl 127.0.0.1:9100/metrics
拉取数据
可以利用 Prometheus 的 static_configs 来拉取 node_exporter 的数据。
编辑prometheus.yml文件,添加内容
- job_name: 'node'

    static_configs:

    - targets: ['localhost:9100']
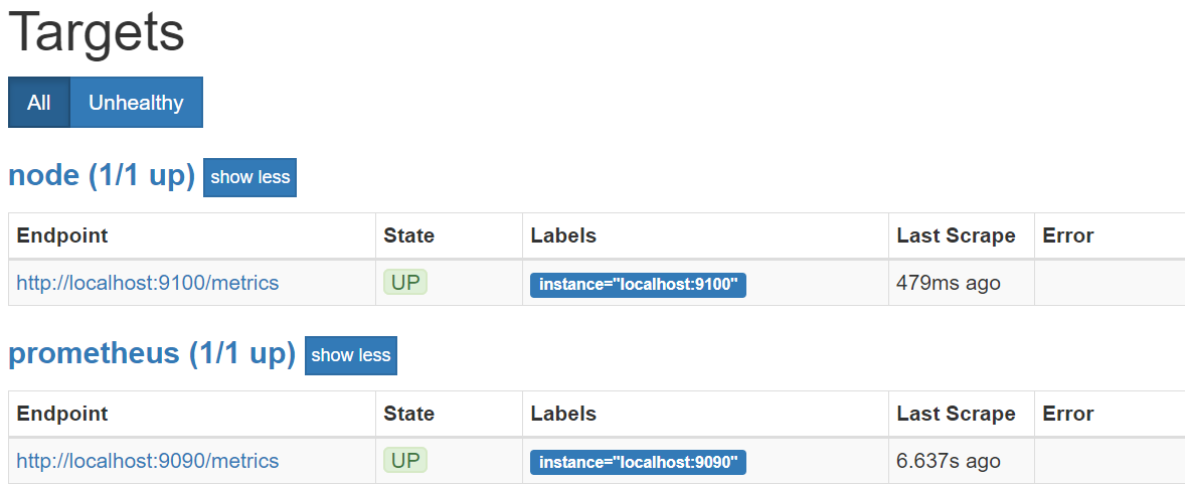
重启prometheus,然后在Prometheus页面中的Targets中就能看到新加入的node
Node Exporter 常用查询语句
收集到 node_exporter 的数据后,我们可以使用 PromQL 进行一些业务查询和监控,下面是一些比较常见的查询
以下查询均以单个节点作为例子,如果大家想查看所有节点,将 instance="xxx" 去掉即可。
CPU使用率
100 - (avg by (instance) (irate(node_cpu{instance="172.16.8.153:9100", mode="idle"}[5m])) * 100)
CPU各个mode使用率
avg by (instance, mode) (irate(node_cpu{instance="172.16.8.153:9100"}[5m])) * 100
User:CPU一共花了多少比例的时间运行在用户态空间或者说是用户进程(running user space processes)。典型的用户态空间程序有:Shells、数据库、web服务器等
Nice:可理解为,用户空间进程的CPU的调度优先级,范围为[-20,19]
System:System的含义与User相似。System表示:CPU花了多少比例的时间在内核空间运行。分配内存、IO操作、创建子进程……都是内核操作。这也表明,当IO操作频繁时,System参数会很高
ioWait:在计算机中,读写磁盘的操作远比CPU运行的速度要慢,CPU负载处理数据,而数据一般在磁盘上需要读到内存中才能处理。当CPU发起读写操作后,需要等着磁盘驱动器将数据读入内存,从而导致CPU 在等待的这一段时间内无事可做。CPU处于这种等待状态的时间由Wait参数来衡量
Idle:CPU处于空闲状态时间比例。一般而言,idel + user + nice 约等于100%
机器平均负载
node_load1{instance="172.16.8.153:9100"}   // 1分钟负载

node_load5{instance="172.16.8.153:9100"}   // 5分钟负载

node_load15{instance="172.16.8.153:9100"}  // 15分钟负载
内存使用率
100-(node_memory_MemFree{instance="172.16.8.172:9100"}+node_memory_Cached{instance="172.16.8.172:9100"}+node_memory_Buffers{instance="172.16.8.172:9100"})/node_memory_MemTotal{instance="172.16.8.172:9100"} * 100
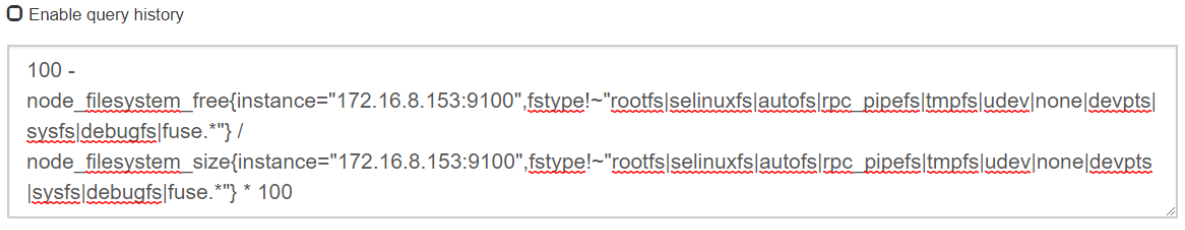
磁盘使用率
100 - node_filesystem_free{instance="172.16.8.153:9100",fstype!~"rootfs|selinuxfs|autofs|rpc_pipefs|tmpfs|udev|none|devpts|sysfs|debugfs|fuse.*"} / node_filesystem_size{instance="172.16.8.153:9100",fstype!~"rootfs|selinuxfs|autofs|rpc_pipefs|tmpfs|udev|none|devpts|sysfs|debugfs|fuse.*"} * 100
或者你也可以直接使用 {fstype="xxx"} 来指定想查看的磁盘信息
网卡出/入包
// 入包量

sum by (instance) (rate(node_network_receive_bytes{instance="172.16.8.153:9100",device!="lo"}[5m]))

// 出包量

sum by (instance) (rate(node_network_transmit_bytes{instance="172.16.8.153:9100",device!="lo"}[5m]))
Node exporter Dashboard 模板
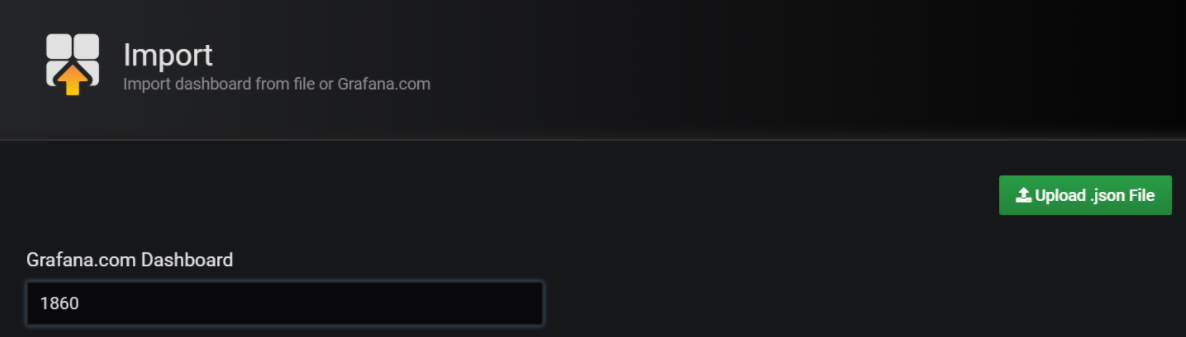
获取node exporter dashboard
1.下载dashboard json文件在上传到grafana中

https://grafana.com/dashboards/1860

2.直接在grafana中输入相应导入的dashboard code_id
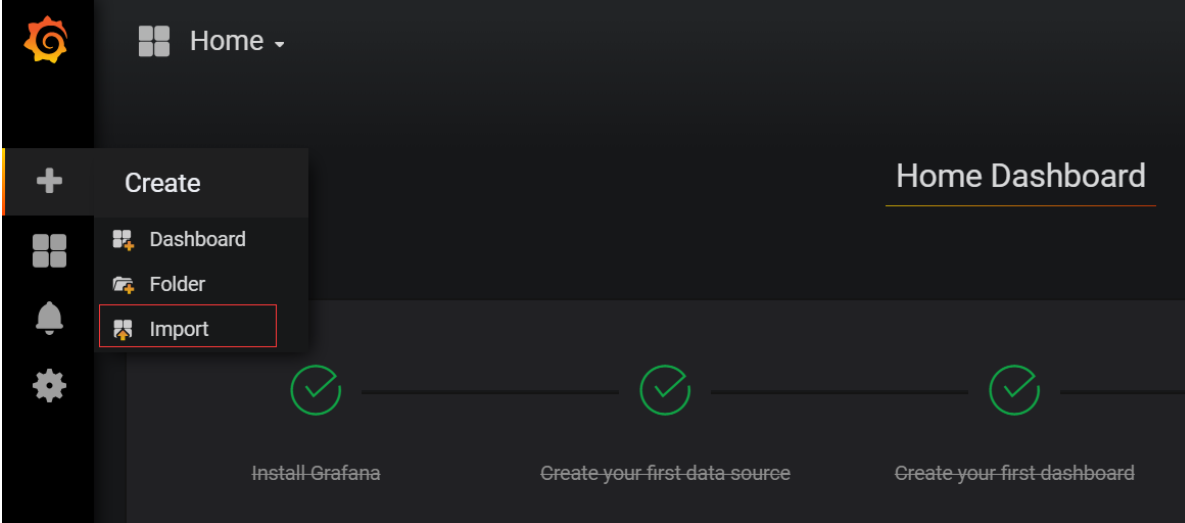
输入code_id 或者 导入json文件
有些仪表盘上面是没有数据的,可能有些参数需要调整(模板可能适应以前的版本),对照这PromQL 修改参数
Prometheus Node_exporter的更多相关文章
- Centos7.X 搭建Prometheus+node_exporter+Grafana实时监控平台
Prometheus简介 什么是 Prometheus Prometheus是一个开源监控报警系统和时序列数据库 主要功能 多维数据模型(时序由 metric 名字和 k/v 的 labels 构成) ...
- Golang 基于Prometheus Node_Exporter 开发自定义脚本监控
Golang 基于Prometheus Node_Exporter 开发自定义脚本监控 公司是今年决定将一些传统应用从虚拟机上迁移到Kubernetes上的,项目多而乱,所以迁移工作进展缓慢,为了建立 ...
- Centos8.X 搭建Prometheus+node_exporter+Grafana实时监控平台
Prometheus Promtheus是一个时间序列数据库,其采集的数据会以文件的形式存储在本地中,因此项目目录下需要一个data目录,需要我们自己创建,下面会讲到 下载 下载好的.tar.gz包放 ...
- Prometheus node_exporter grafana部署安装
1.环境 centos7 prometheus-2.10.0.linux-amd64.tar.gz node_exporter-0.18.1.linux-amd64.tar.gz 2.安装 创建sys ...
- Grafana+Prometheus+node_exporter监控,Grafana无法显示数据的问题
环境搭建: 被测linux机器上部署了Grafana,Prometheus,node_exporter,并成功启动了它们. Grafana中已经创建了Prometheus数据源,并测试通过,并且导入了 ...
- Prometheus Node_exporter 详解
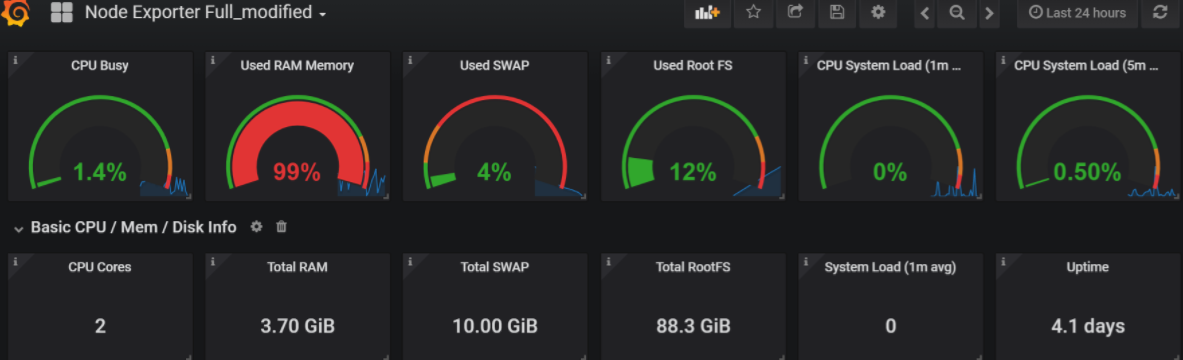
Basic CPU / Mem / Disk Info https://www.cnblogs.com/qianyuliang/p/10479515.html Basic CPU / Mem / Di ...
- Prometheus Node_exporter 之 Node Exporter
Node Exporter 1. Node Exporter Scrape Time type: GraphUnit: secondsLabel: Seconds{{collector}} - 各个收 ...
- Prometheus Node_exporter 之 Network Netstat ICMP
Network Netstat ICMP /proc/net/snmp 1. ICMP Errors 1 type: GraphUnit: shortLabel: Messages out (-) / ...
- Prometheus Node_exporter 之 Network Netstat UDP
Network Netstat UDP /proc/net/snmp 1. UDP In / Out type: GraphUnit: shortLabel: Datagrams out (-) / ...
随机推荐
- 第九次Scrum meeting
第九次Scrum meeting 任务及完成度: 成员 12.31 1.1 陈谋 任务1040:完成stackoverflow的数据处理后的json处理(99%) 任务1114-1:完成对网页数据的 ...
- Java实验报告一:Java开发环境的熟悉
实验要求: 1. 使用JDK编译.运行简单的Java程序 2.使用Eclipse 编辑.编译.运行.调试Java程序 实验内容 (一) 命令行下Java程序开发 (二)Eclipse下Java程序 ...
- Java提高篇(1)封装
三大特性之---封装 封装从字面上来理解就是包装的意思,专业点就是信息隐藏,是指利用抽象数据类型将数据和基于数据的操作封装在一起,使其构成一个不可分割的独立实体,数据被保护在抽象数据类型的内部,尽可能 ...
- 微信小程序动态数据跑马灯组件编写
开发必备:熟悉微信小程序组件开发 开发思路:如果只有一条数据,直接用css3关键帧动画:如果有多条数据,则在当前动画运动到一定时间的时候,将其数据替换掉,使之在视觉效果上有一个从下到上播放的状态.数组 ...
- Docker(十三)-Docker save and load镜像保存
持久化docker的镜像或容器的方法 Docker的镜像和容器可以有两种方式来导出 docker save #ID or #Name docker export #ID or #Name docker ...
- Angular $scope和$rootScope
<!DOCTYPE html><html ng-app='myModule'><head lang="en"> <meta charset ...
- 注册鼠标右键CMD
Windows Registry Editor Version 5.00 [-HKEY_CLASSES_ROOT\Directory\shell\runas] [HKEY_CLASSES_ROOT\D ...
- ThreadLocal的使用场景及实现原理
1. 什么是ThreadLocal? 线程局部变量(通常,ThreadLocal变量是private static修饰的,此时ThreadLocal变量相当于成为了线程内部的全局变量) 2. 使用场景 ...
- python之使用smtplib模块发送邮件
# 使用smtplib模块发送邮件 import smtplib from email.mime.text import MIMEText from email.header import Heade ...
- 实现CSS等分布局的5种方式
前面的话 等分布局是指子元素平均分配父元素宽度的布局方式,本文将介绍实现等分布局的5种方式 float [思路一]float 缺点:结构和样式存在耦合性,IE7-浏览器下对宽度百分比取值存在四舍五入的 ...