springboot如何集成Prometheus如何暴露Histogram来获取P99等监控指标
背景
springboot如何集成Prometheus我这里不做详细描述,要想了解集成过程,可以参考一下博客:
Spring Boot 使用 Micrometer 集成 Prometheus 监控 Java 应用性能,
这里我讲一下如果我们j需要获取到某些监控指标的p99、p90等度量数据,比如说http请求的响应时长p99等,
Micrometer
根据指标监控的对象个数、监视目的和含义的不同,Micrometer指标类型大体可以分为Gauge、Counter、DistributionSummary、Timer四种。
这里我重点说一下DistributionSummary。
DistributionSummary
DistributionSummary是用于跟踪事件的分布情况,有多个指标组成:
- count,事件的个数,聚合指标,如响应的个数
- sum,综合,聚合指标,如响应大小的综合
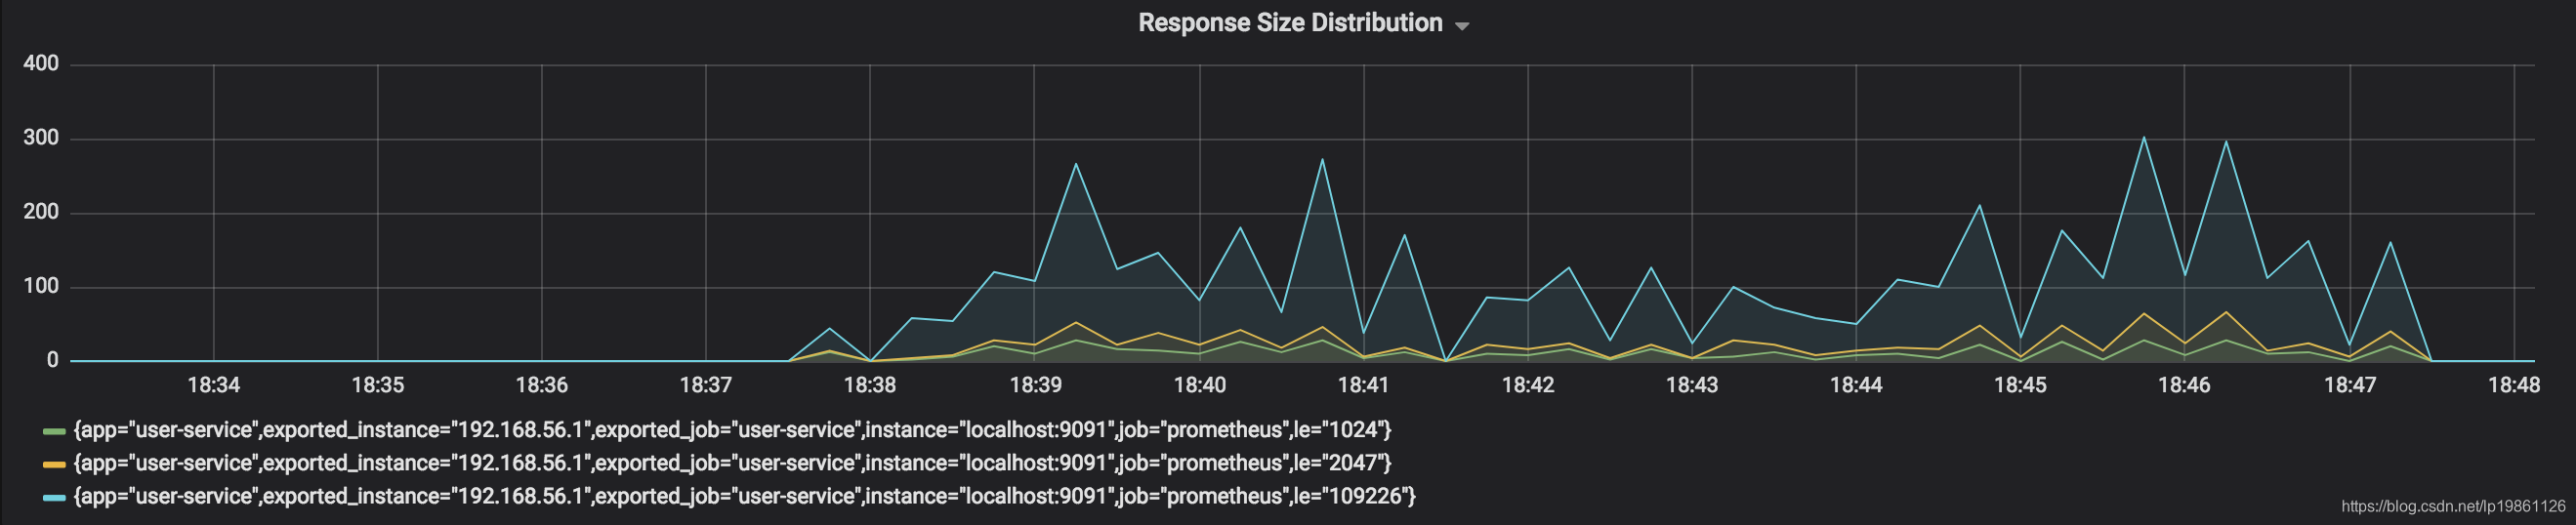
- histogram,分布,聚合指标,包含le标签用于区分bucket,例如web.response.size.historgram{le=512} = 99,表示响应大小不超过512(Byte)的响应个数是99个。一般有多个bucket,如le=128,le=256,le=512,le=1024,le=+Inf等。
每个bucket展示为一条时间序列,会得到类似下面的图。
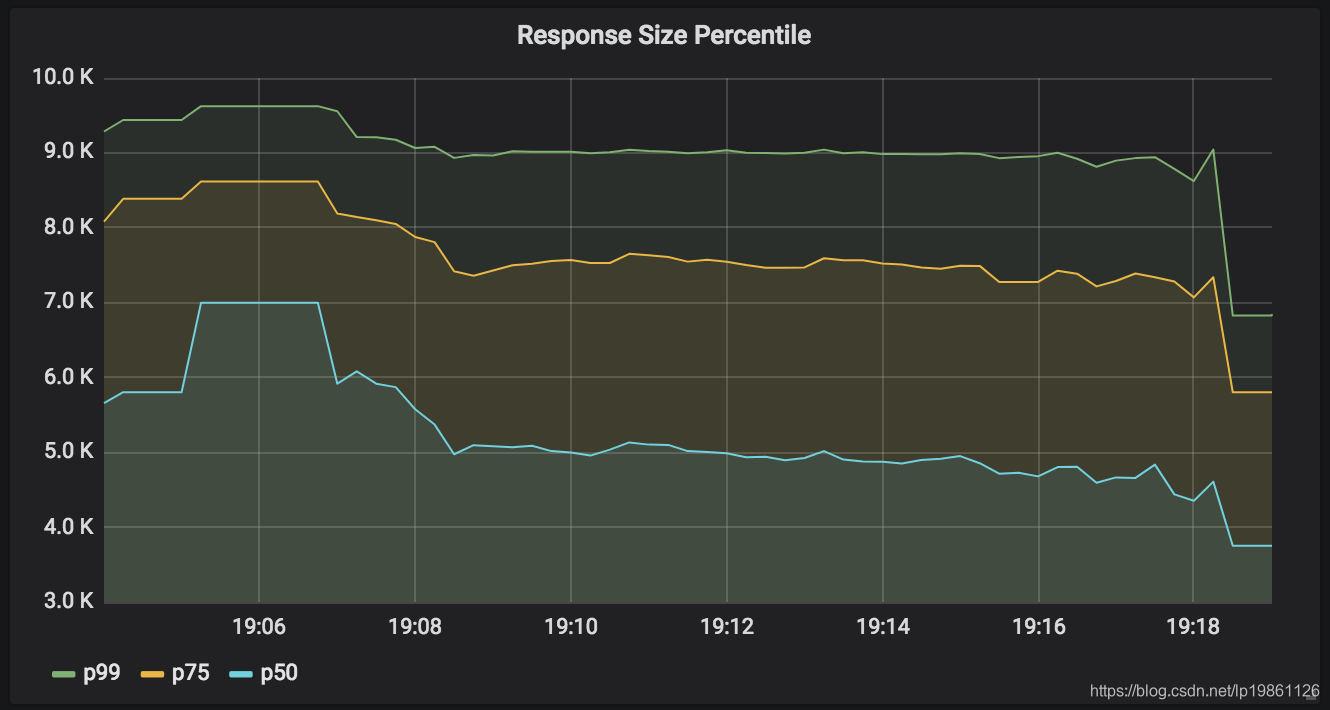
percentile(quantile),百分位数,聚合指标,包含percentile标签用于区分不同的百分位,例如web.response.size.percentile{p=90) = 512,表示90%的响应大小都小于512。一般有多个percentile,如p50,p75,p90,p99。
每个百分位展示为一条时间序列,会得到类似下面的图。
Timer
Timer是DistributionSummary的特化,专门用于计时类的指标,可以对记录的时间值(duration)进行单位换算。
暴露histogram
 <dependency>

            <groupid>io.micrometer</groupid>

            <artifactid>micrometer-registry-prometheus</artifactid>

        </dependency>
其中prometheus的类库中为我们提供了很多的监控指标,可以访问下
http://localhost:8080/actuator/prometheus就可以看到已有监控看信息
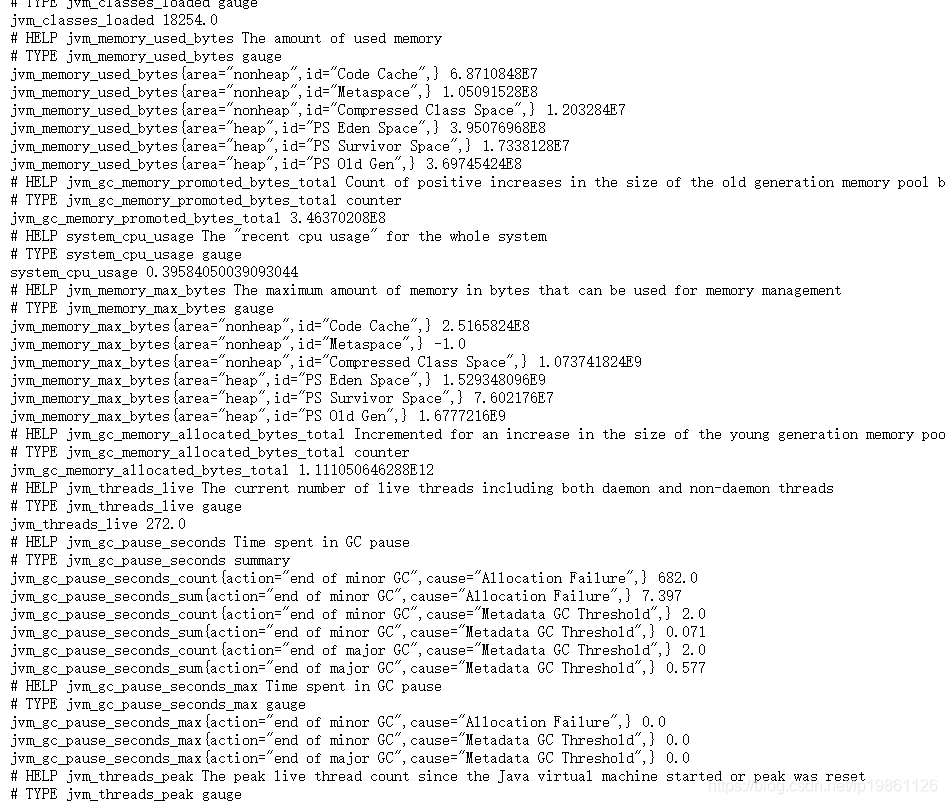
但是默认这些监控指标并不是DistributionSummary,所以需要我们在初始化时替换配置并打开计数开关,如下:
import io.micrometer.core.instrument.Meter;
import io.micrometer.core.instrument.MeterRegistry;
import io.micrometer.core.instrument.config.MeterFilter;
import io.micrometer.core.instrument.distribution.DistributionStatisticConfig;
import lombok.extern.slf4j.Slf4j;
import org.springframework.boot.actuate.autoconfigure.metrics.MeterRegistryCustomizer;
import org.springframework.context.annotation.Bean;
import org.springframework.context.annotation.Configuration;
import java.time.Duration;
@Configuration
@Slf4j
public class MicrometerConfig {
@Bean
MeterRegistryCustomizer<meterregistry> metricsCommonTags() {
return registry -> {
registry.config().meterFilter(
new MeterFilter() {
@Override
public DistributionStatisticConfig configure(Meter.Id id, DistributionStatisticConfig config) {
if (id.getType() == Meter.Type.TIMER&&id.getName().matches("^(http|hystrix){1}.*")) {
return DistributionStatisticConfig.builder()
.percentilesHistogram(true)
.percentiles(0.5, 0.90,0.95, 0.99)
.sla(Duration.ofMillis(50).toNanos(),
Duration.ofMillis(100).toNanos(),
Duration.ofMillis(200).toNanos(),
Duration.ofSeconds(1).toNanos(),
Duration.ofSeconds(5).toNanos(),
.minimumExpectedValue(Duration.ofMillis(1).toNanos())
.maximumExpectedValue(Duration.ofSeconds(5).toNanos())
.build()
.merge(config);
} else {
return config;
}
}
});
};
}
}
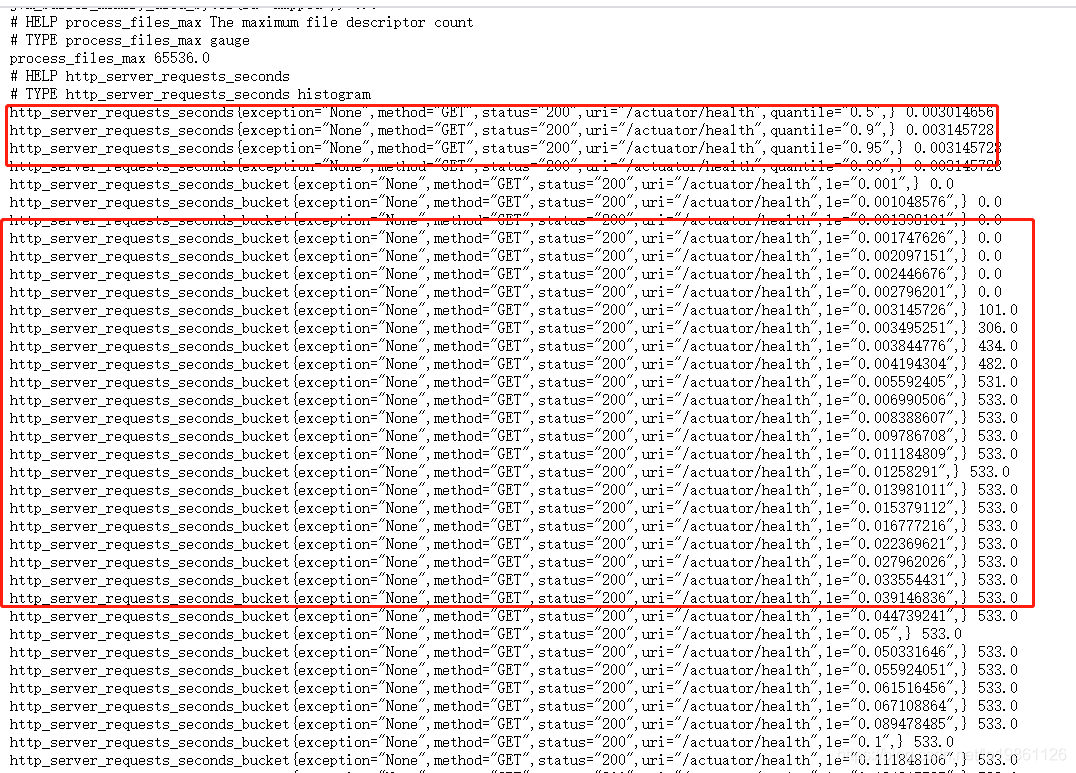
以上代码根据需要来暴露histogram信息,这里是选择http响应时长以及hystrix响应监控暴露histogram,如果有需要可以不增加过滤条件。
打开后可以看到多了很多监控信息:
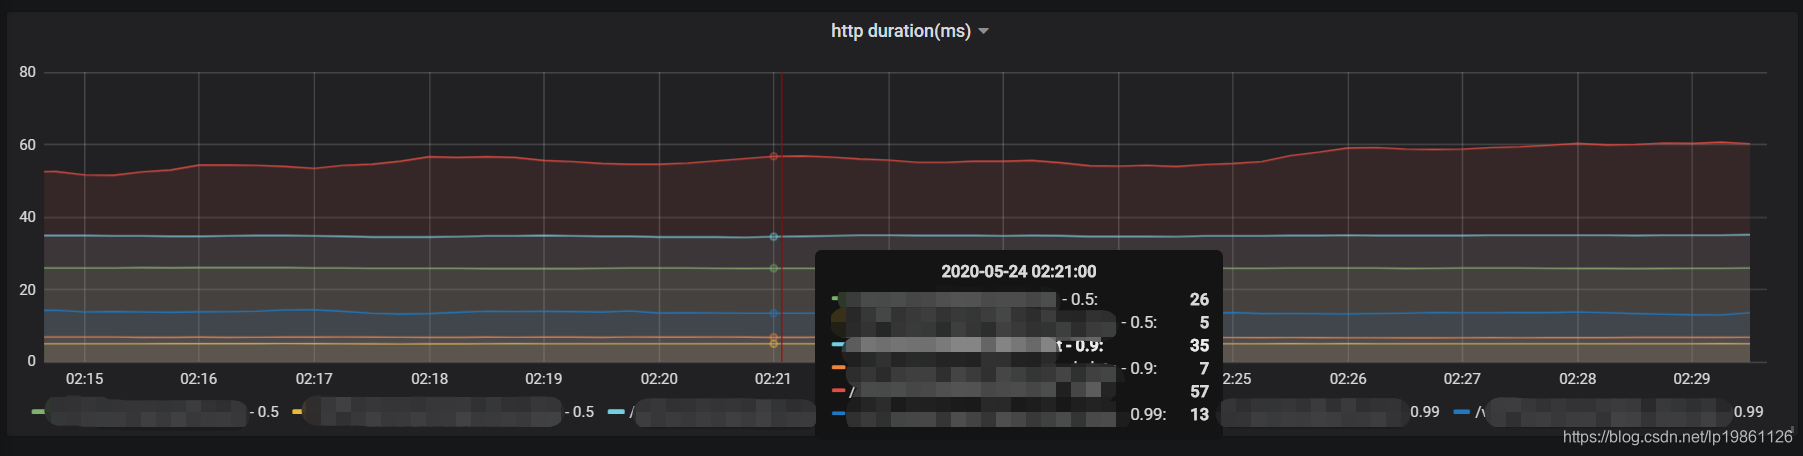
配置到grafana
avg(http_server_requests_seconds{service=~"$service" ,quantile =~ "0.9|0.5|0.99", uri !~ "/actuator.*|/health|/prometheus|root"}*1000 > 0) by (uri,quantile)
 </meterregistry>
springboot如何集成Prometheus如何暴露Histogram来获取P99等监控指标的更多相关文章
- asp.net core 集成 Prometheus
asp.net core 集成 prometheus Intro Prometheus 是一个开源的现代化,云原生的系统监控框架,并且可以轻松的集成 PushGateway, AlertManager ...
- SpringBoot应用集成微服务组件Nacos
目录 springboot与微服务组件nacos Nacos服务快速启动 STS4 开发工具 Maven 环境配置 STS4开发工具引入Maven配置 Maven Repo配置阿里云镜像源 Sprin ...
- Spring Boot 微服务应用集成Prometheus + Grafana 实现监控告警
Spring Boot 微服务应用集成Prometheus + Grafana 实现监控告警 一.添加依赖 1.1 Actuator 的 /prometheus端点 二.Prometheus 配置 部 ...
- springboot elasticsearch 集成注意事项
文章来源: http://www.cnblogs.com/guozp/p/8686904.html 一 elasticsearch基础 这里假设各位已经简单了解过elasticsearch,并不对es ...
- Springboot Application 集成 OSGI 框架开发
内容来源:https://www.ibm.com/developerworks/cn/java/j-springboot-application-integrated-osgi-framework-d ...
- SpringBoot项目集成Hystrix
Hystrix Hystrix是由Netflix开源的一个服务隔离组件,通过服务隔离来避免由于依赖延迟.异常,引起资源耗尽导致系统不可用的解决方案. 1.什么是服务熔断 服务熔断就是对该服务的调用 ...
- 钉钉通知机器人与SpringBoot的集成
Spring Boot Admin 集成自定义监控告警(2.0.1版本)------钉钉机器人 - yuancao24的博客 - CSDN博客https://blog.csdn.net/yuancao ...
- SpringBoot项目集成PageHelper使用
SpringBoot项目集成PageHelper使用 一.开始 地址:https://github.com/pagehelper/Mybatis-PageHelper 在spring boot ...
- Springboot简单集成ActiveMQ
Springboot简单集成ActiveMQ 消息发送者的实现 pom.xml添加依赖 <dependency> <groupId>org.springframework.bo ...
- 在springboot中集成mybatis开发
在springboot中利用mybatis框架进行开发需要集成mybatis才能进行开发,那么如何在springboot中集成mybatis呢?按照以下几个步骤就可以实现springboot集成myb ...
随机推荐
- socket 端口复用 SO_REUSEPORT 与 SO_REUSEADDR
背景 在学习 SO_REUSEADDR 地址复用的时候,看到有人提到了 SO_REUSEPORT .于是也了解了一下. SO_REUSEPORT 概述 SO_REUSEPOR这个socket选项可以让 ...
- LangGraph实战
1.概述 前段时间LangChain发布了LangGraph,它引起了很多关注.LangGraph 的主要优势在于它能够实现循环工作流,这对于在 LLM 应用程序中模拟类似代理的行为至关重要.本篇博客 ...
- 如何解决jenkins插件下载过慢的问题
1.修改/var/lib/jenkins/updates目录下的default.json文件 通过sed命令将插件的下载地址替换成国内的地址: sed -i 's#http:\/\/updates.j ...
- WEB入门 - 文件上传
WEB入门 - 文件上传 参考文章 https://fushuling.com/index.php/2023/08/20/ctfshow刷题记录持续更新中/ https://www.cnblogs.c ...
- 在Winform程序中增加隐藏的按键处理,用于处理一些特殊的界面显示或者系统初始化操作
以前,我看到一个朋友在对一个系统做初始化的时候,通过一组魔幻般的按键,调出来一个隐藏的系统设置界面,这个界面在常规的菜单或者工具栏是看不到的,因为它是一个后台设置的关键界面,不公开,同时避免常规用户的 ...
- 委托之Action与Func
1 例程代码: using System; using System.Collections.Generic; using System.Linq; using System.Text; using ...
- Loggie Geek Camp 火热启动,社区大神带你玩开源
由开源构建的协作模式,正成为描绘数字蓝图.创造美好未来的主航道,中国工商银行.阿里云等组织已经在网易数帆"架构开发.内核开源"理念中与后者达成合作,来自华为.阿里云.中国移动.eB ...
- CRC 循环冗余效验
CRC循环冗余效验 利用多项式 x6 + x4 + x3,实际为使用模2除法来做的加密 常用crc多项式有 名称 生成多项式 数值式 简记式 标准引用 CRC-4 x4+x+1 0x1'3 0x3 I ...
- hmall | 引入ES实现高效搜索与同步双写
在gitee.飞书.百度云.B站中,黑马都没有上传该部分资料,以下皆为个人观点,如有纰漏欢迎指正 1.先把item-service中的searchcontroller抽出来,抽到一个模块中并将其设为h ...
- 2023/4/19 SCRUM个人博客
1.我昨天的任务 初步了解了pandas库,对series和dataframe有了初步的学习使用 2.遇到了什么困难 对PYQT5的概念没有定义,准备进行学习 3.我今天的任务 学习了PYQT5的部分 ...