Go的pprof使用
go中有pprof包来做代码的性能监控,在两个地方有包:
net/http/pprof

runtime/pprof
其实net/http/pprof中只是使用runtime/pprof包来进行封装了一下,并在http端口上暴露出来
pprof包
web 服务器
如果你的go程序是用http包启动的web服务器,你想查看自己的web服务器的状态。这个时候就可以选择net/http/pprof。你只需要引入包_"net/http/pprof",
然后就可以在浏览器中使用http://localhost:port/debug/pprof/直接看到当前web服务的状态,包括CPU占用情况和内存使用情况等。具体使用情况你可以看godoc的说明。
服务进程
如果你的go程序不是web服务器,而是一个服务进程,那么你也可以选择使用net/http/pprof包,同样引入包net/http/pprof,然后在开启另外一个goroutine来开启端口监听。
比如:
go func() {

        log.Println(http.ListenAndServe("localhost:6060", nil))

}()
应用程序
如果你的go程序只是一个应用程序,比如计算fabonacci数列,那么你就不能使用net/http/pprof包了,你就需要使用到runtime/pprof。具体做法就是用到pprof.StartCPUProfile和pprof.StopCPUProfile。比如下面的例子:
var cpuprofile = flag.String("cpuprofile", "", "write cpu profile to file")

func main() {

    flag.Parse()

    if *cpuprofile != "" {

        f, err := os.Create(*cpuprofile)

        if err != nil {

            log.Fatal(err)

        }

        pprof.StartCPUProfile(f)

        defer pprof.StopCPUProfile()

    }

…
运行程序的时候加一个--cpuprofile参数,比如fabonacci --cpuprofile=fabonacci.prof
这样程序运行的时候的cpu信息就会记录到XXX.prof中了。
下一步就可以使用这个prof信息做出性能分析图了(需要安装graphviz)。
使用go tool pprof (应用程序) (应用程序的prof文件)
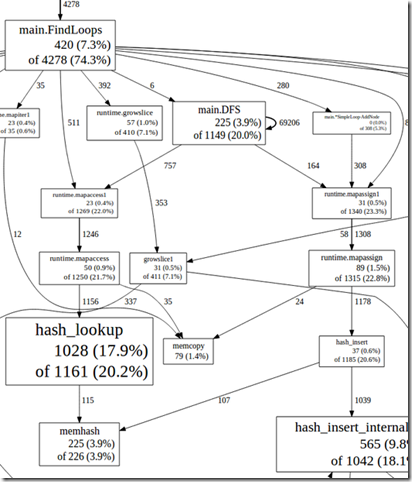
进入到pprof,使用web命令就会在/tmp下生成svg文件,svg文件是可以在浏览器下看的。像这个样子:
如果你的程序非常简单,比如只有println一个语句,你用pprof.StartCPUProfile是打印不出任何东西的。
举例
下面拿go-tour举个例子,这是个web程序,我在代码中加入了
_ "net/http/pprof"
在浏览器中我就可以直接看prof信息了
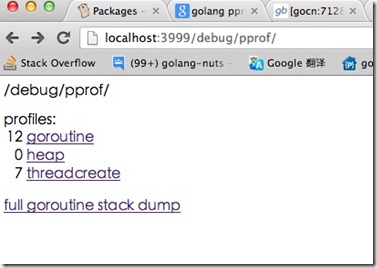
生成CPU状态分析图
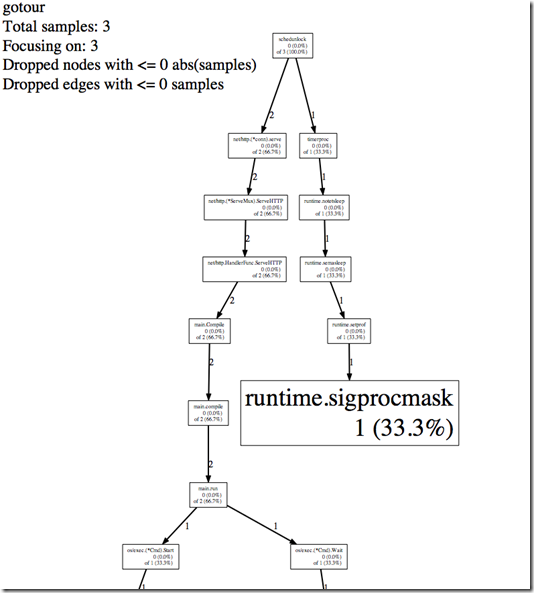
下面我们想要生成CPU状态分析图,调用go tool pprof http://localhost:3999/debug/pprof/profile
就会进入30秒的profile收集时间,在这段事件内猛刷新点击go-tour浏览器上的页面,尽量让cpu占用性能产生数据。
(pprof) top10
Total: 3 samples
1 33.3% 33.3% 1 33.3% MHeap_AllocLocked
1 33.3% 66.7% 1 33.3% os/exec.(*Cmd).closeDescriptors
1 33.3% 100.0% 1 33.3% runtime.sigprocmask
0 0.0% 100.0% 1 33.3% MCentral_Grow
0 0.0% 100.0% 2 66.7% main.Compile
0 0.0% 100.0% 2 66.7% main.compile
0 0.0% 100.0% 2 66.7% main.run
0 0.0% 100.0% 1 33.3% makeslice1
0 0.0% 100.0% 2 66.7% net/http.(*ServeMux).ServeHTTP
0 0.0% 100.0% 2 66.7% net/http.(*conn).serve
(pprof)web
参考
http://blog.golang.org/2011/06/profiling-go-programs.html
这篇官方文章说得很仔细了,但是要注意,将里面的gopprof工具换成go tool pprof就行了
Go的pprof使用的更多相关文章
- Golang pprof heap profile is empty
Q: When you use `go tool pprof` get heap data, profile is empty. A: The default sampling rate is 1 s ...
- 使用go tool pprof分析内存泄漏、CPU消耗
go中提供了pprof包来做代码的性能监控,在两个地方有包: net/http/pprof runtime/pprof 其实net/http/pprof中只是使用runtime/pprof包来进行封装 ...
- go pprof
import _ "net/http/pprof" func main() { go func() { http.ListenAndServe("localhost:60 ...
- golang使用pprof检查goroutine泄露
有一段时间,我们的推送服务socket占用非常不正常,我们自己统计的同一时候在线就10w的用户,可是占用的socket居然达到30w,然后查看goroutine的数量,发现已经60w+. 每一个用户占 ...
- Golang使用pprof和qcachegrind进行性能监控
Golang为我们提供了非常方便的性能测试工具pprof,使用pprof可以非常方便地对Go程序的运行效率进行监测.本文讲述如何使用pprof对Go程序进行性能测试,并使用qcachegrind查看性 ...
- Go 程序的性能优化及 pprof 的使用
Go 程序的性能优化及 pprof 的使用 程序的性能优化无非就是对程序占用资源的优化.对于服务器而言,最重要的两项资源莫过于 CPU 和内存.性能优化,就是在对于不影响程序数据处理能力的情况下,我们 ...
- 使用 pprof 和 Flame-Graph 调试 Golang 应用
前言 最近用 Golang 实现了一个日志搜集上报程序(内部称 logger 项目),线上灰度测试过程发现 logger 占用 CPU 非常高(80% - 100%).而此项目之前就在线上使用,用于消 ...
- golang 使用pprof进行性能调优
package main import "fmt" func lengthOfNonRepeatingSubStr(s string) int { lastOccurred := ...
- go笔记-pprof使用
go tool pprof http://localhost:6060/debug/pprof/profile go tool pprof http://localhost:6060/debug/pp ...
随机推荐
- UVALive 2403 77377解题报告(深搜)
题意:给你一些固定的字符串,在给出数字,根据键盘的对应关系,输出所有的满足条件的字符串,输出顺序无所谓. 思路:因为题目说了,输出比较小,说明测试数据并不强,所以可以暴力回溯求出答案,将所有的给出的字 ...
- 4--OC --合成存取器方法
1. 从OC 2.0开始就已经可以自动生成设置函数方法和获取函数方法(统称为存取器方法). 什么是 @property 和 @synthesize ? @property 和 @synthesize ...
- 转:LoadRunner检查点使用小结
LR中检查点有两种:图片和文字. 常用检查点函数如下: 1)web_find()函数用于从 HTML 页中搜索指定的文本字符串: 2)web_reg_find()函数注册一个请求,以在下一个操作函数( ...
- PAT (Advanced Level) 1107. Social Clusters (30)
简单并查集. #include<cstdio> #include<cstring> #include<cmath> #include<vector> # ...
- ArrayList类
/* * Collection是集合的顶层接口,它的子体系有重复的,有唯一的,有有序的,有无序的 * * Collection的功能概述 * 1添加功能 * boolean add(Object ob ...
- 为什么做Web开发要选择PHP
大部分互联网公司做WEb开发都选择PHP,PHP的优势在哪?你应该知道的 以前偶尔被人问到,为什么你(和大部分互联网公司)做Web开发要选择PHP, PHP有什么好处.简单的回答便是“PHP简单,开发 ...
- 【转】获取/设置IFRAME内对象元素的几种JS方法
1.IE专用(通过frames索引形象定位): document.frames[i].document.getElementById('元素的ID'); 2.IE专用(通过IFRAME名称形象定位): ...
- ural1542 Autocompletion
Autocompletion Time limit: 2.0 secondMemory limit: 64 MB The Japanese are infinitely in love with ma ...
- 【转】Linux 标准目录结构
初学Linux,首先需要弄清Linux 标准目录结构 / root --- 启动Linux时使用的一些核心文件.如操作系统内核.引导程序Grub等. home --- 存储普通用户的个人文件 ftp ...
- 1381: Munching(BFS)
Description Bessie loves her grass and loves to hurry to the barn for her evening milking session. S ...