Android开源图表之树状图和饼状图的官方示例的整理
最近由于工作需要,所以就在github上搜了下关于chart的三方框架
官方地址https://github.com/PhilJay/MPAndroidChart
由于工作需要我这里整理了一份Eclipse版本的类库.(有需要要的留下邮箱)
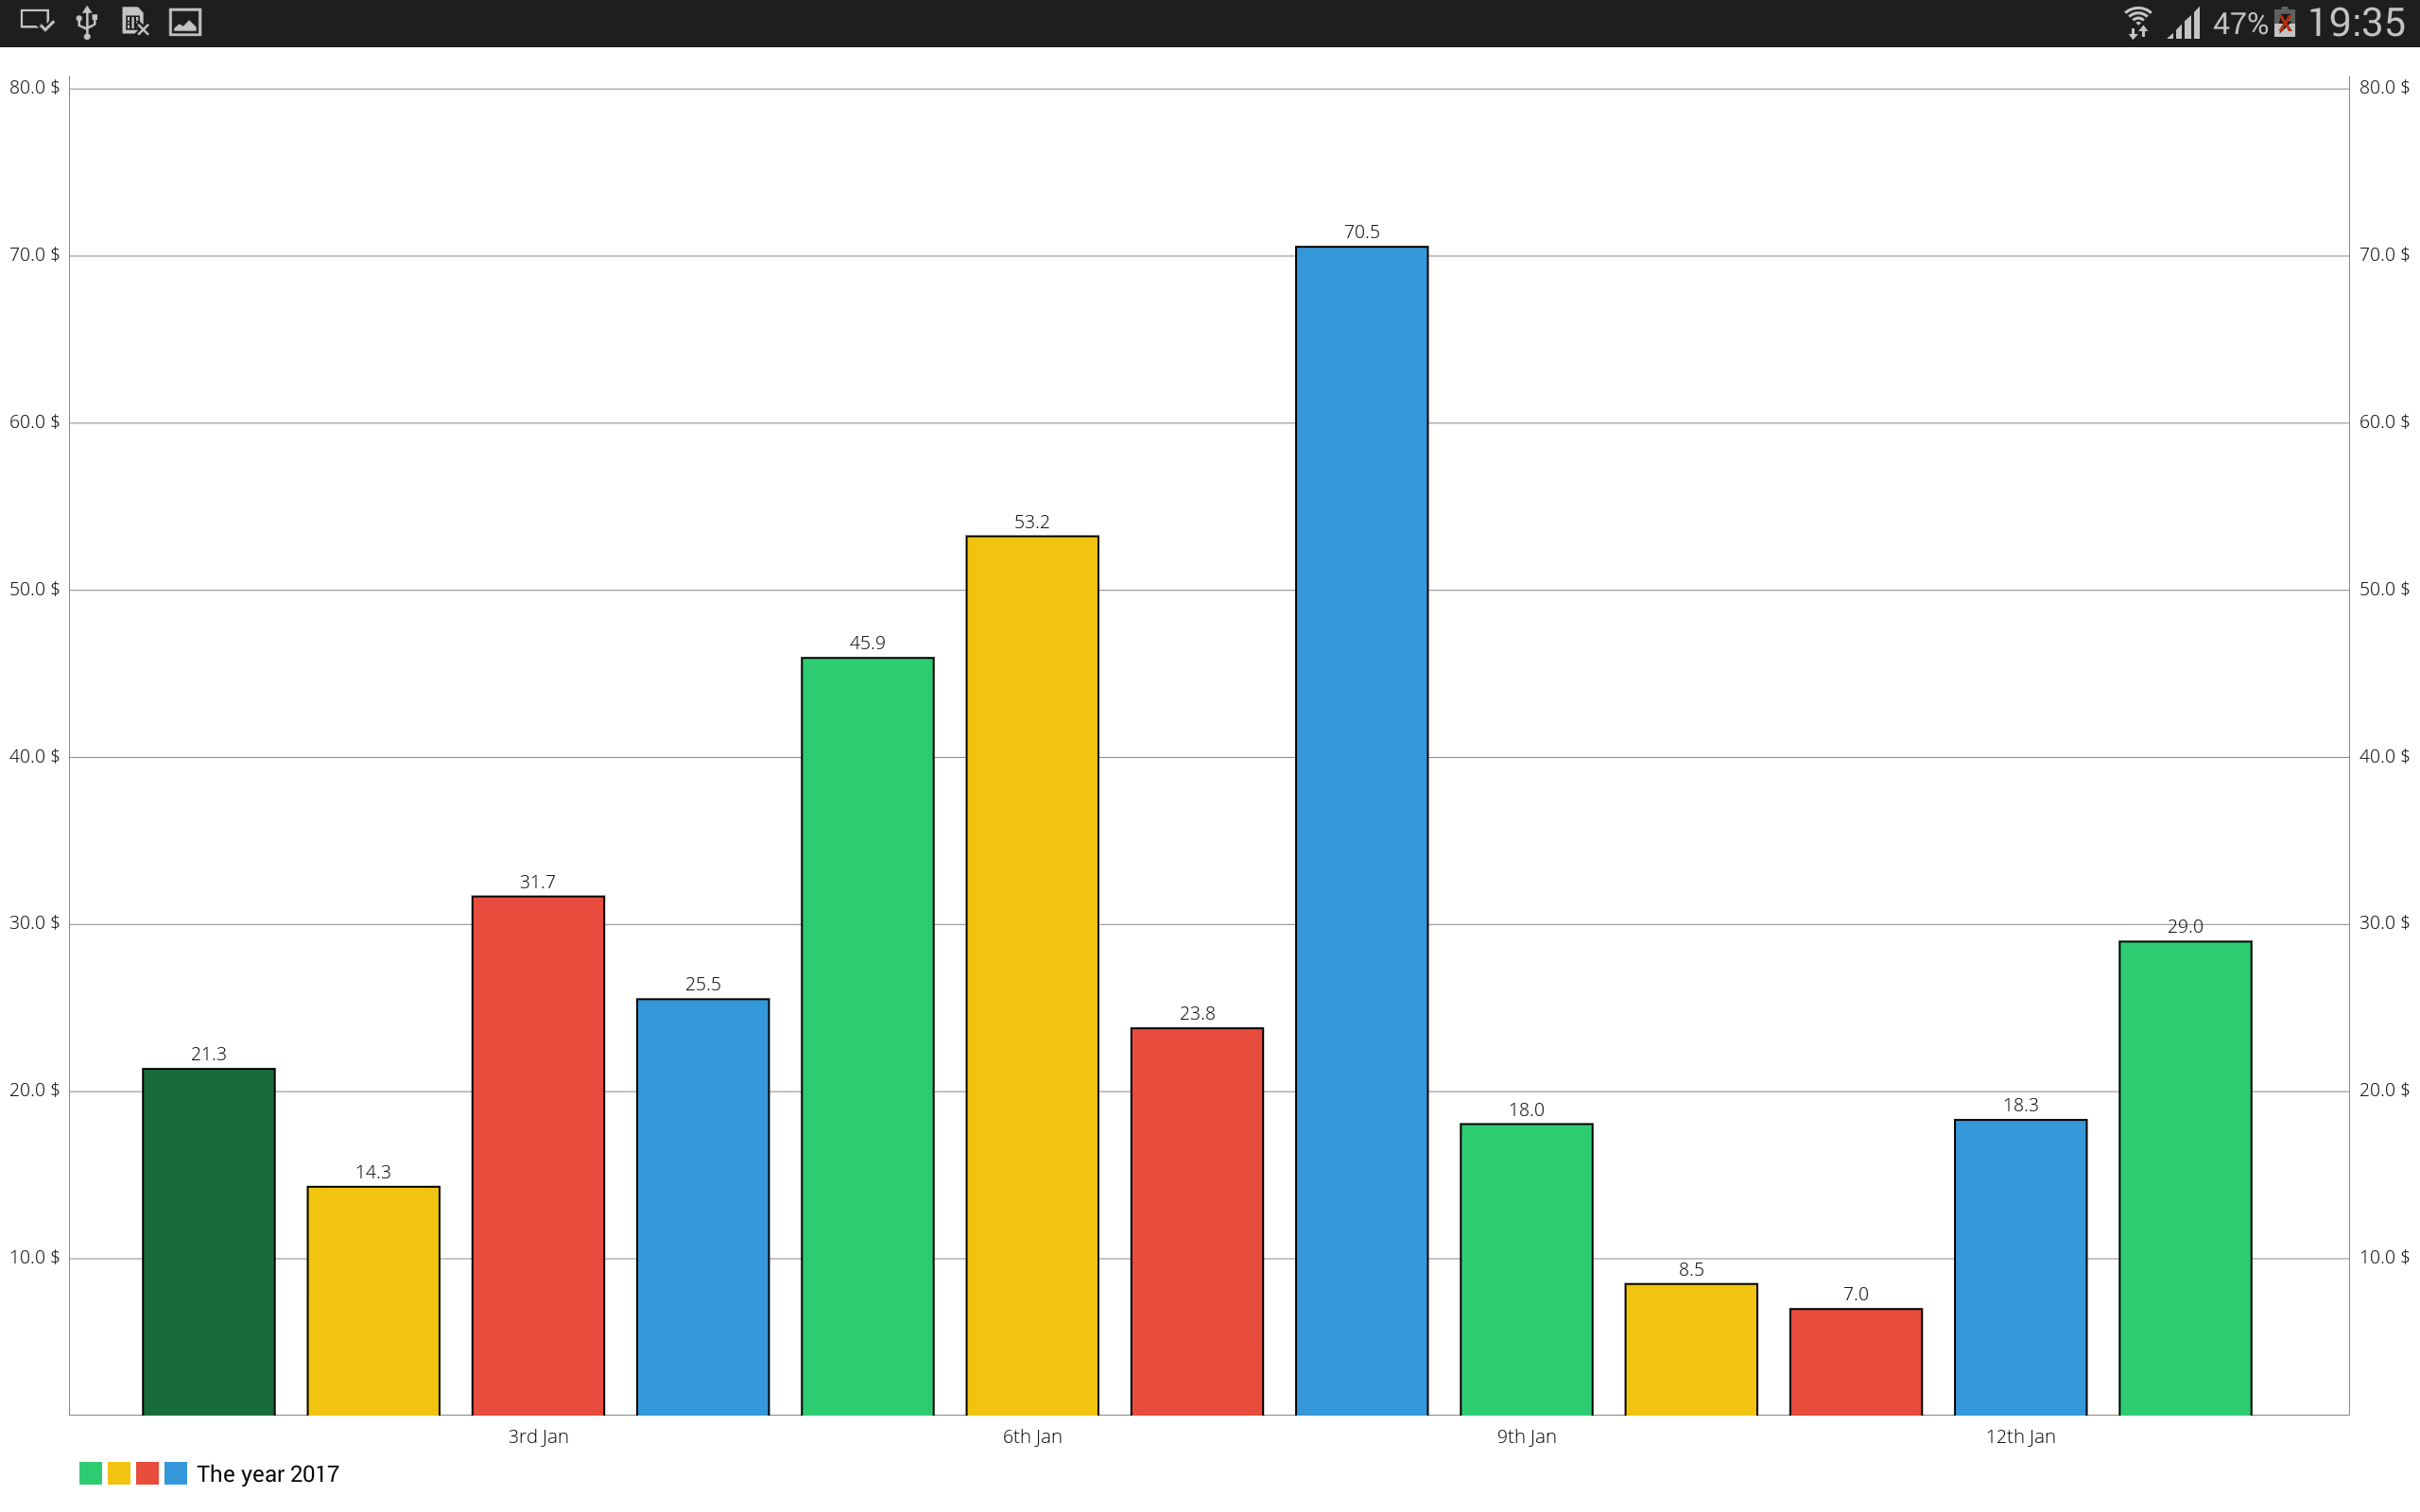
这就是Code中的效果(树状图)
 public class BarChartActivity extends Activity implements OnChartValueSelectedListener{

     private BarChart mChart;

     private Typeface mTfLight;

     @Override

     protected void onCreate(Bundle savedInstanceState) {

         // TODO Auto-generated method stub

         super.onCreate(savedInstanceState);

         setContentView(R.layout.activity_barchart);

         mTfLight = Typeface.createFromAsset(getAssets(), "OpenSans-Light.ttf");

         mChart = (BarChart) findViewById(R.id.chart1);

         mChart.setOnChartValueSelectedListener(this);

         mChart.setDrawBarShadow(false);//--绘制当前展示的内容顶部阴影

         mChart.setDrawValueAboveBar(true);//--绘制的图形都在bar顶部

         mChart.setDescription("");

         // if more than 60 entries are displayed in the chart, no values will be

         // drawn

         mChart.setMaxVisibleValueCount(80); //Y方向的最大值.

         // scaling can now only be done on x- and y-axis separately

         mChart.setPinchZoom(false);  //--双指缩放.

         mChart.setDrawGridBackground(false);//--绘制中心内容区域背景色.

         // mChart.setDrawYLabels(false);

         XAxis xAxis = mChart.getXAxis();

         xAxis.setPosition(XAxisPosition.BOTTOM);

         xAxis.setTypeface(mTfLight);

         xAxis.setDrawGridLines(false);//--是否绘制竖直分割线.

         xAxis.setGranularity(1f); // only intervals of 1 day  底部label的分割间隙

         xAxis.setLabelCount(5);  //--对应的当前绘制在底部的label数

         xAxis.setValueFormatter(new DayAxisValueFormatter(mChart));

         AxisValueFormatter custom = new MyAxisValueFormatter();

         YAxis leftAxis = mChart.getAxisLeft();

         leftAxis.setTypeface(mTfLight);

         leftAxis.setDrawGridLines(false); //-绘制水平分割线,按照当前Y方向的label点为起始点

         leftAxis.setLabelCount(8, false); //--绘制Y方向(应该)被显示的数量,第二个参数表示label是否是精准变化,还是近似变化

         leftAxis.setValueFormatter(custom);

         leftAxis.setPosition(YAxisLabelPosition.OUTSIDE_CHART);//Y方向文字的位置,在线外侧.(默认在外侧)

         leftAxis.setSpaceTop(15f);  //分割线的间距百分比.

         leftAxis.setAxisMinValue(0f); // this replaces setStartAtZero(true)  Y方向的起始值.

         YAxis rightAxis = mChart.getAxisRight();

         rightAxis.setDrawGridLines(true); //-绘制水平分割线,按照当前Y方向的label点为起始点

         rightAxis.setTypeface(mTfLight);

         rightAxis.setLabelCount(8, false);

         rightAxis.setValueFormatter(custom);

         rightAxis.setSpaceTop(15f);

         rightAxis.setAxisMinValue(0f); // this replaces setStartAtZero(true)

         Legend l = mChart.getLegend();

         l.setForm(LegendForm.SQUARE); //--设置legend的形状.

         l.setPosition(LegendPosition.BELOW_CHART_LEFT); //--设置legend的位置.

         l.setFormSize(12f);            //--设置legend的大小

         l.setTextSize(12f);               //--设置legend上的文字大小

 //        l.setXEntrySpace(100f);

         l.setYOffset(30f);

         // l.setExtra(ColorTemplate.VORDIPLOM_COLORS, new String[] { "abc",

         // "def", "ghj", "ikl", "mno" });

         // l.setCustom(ColorTemplate.VORDIPLOM_COLORS, new String[] { "abc",

         // "def", "ghj", "ikl", "mno" });

         mChart.animateY(3000);

         mChart.setPinchZoom(true);

         setData(12, 80);

     }

     private void setData(int count, float range) {

         float start = 0f;

         mChart.getXAxis().setAxisMinValue(start);

         mChart.getXAxis().setAxisMaxValue(start + count + 2);

         ArrayList<BarEntry> yVals1 = new ArrayList<BarEntry>();

         for (int i = (int) start; i < start + count + 1; i++) {

             float mult = (range + 1);

             float val = (float) (Math.random() * mult);

             BarEntry barEntry = new BarEntry(i + 1f, val);

             yVals1.add(barEntry);

         }

         BarDataSet set1;

         if (mChart.getData() != null &&

                 mChart.getData().getDataSetCount() > 0) {

             set1 = (BarDataSet) mChart.getData().getDataSetByIndex(0);

             set1.setValues(yVals1);

             mChart.getData().notifyDataChanged();

             mChart.notifyDataSetChanged();

         } else {

             set1 = new BarDataSet(yVals1, "The year 2017");

             set1.setBarBorderWidth(1);

             set1.setColors(ColorTemplate.MATERIAL_COLORS);

             ArrayList<IBarDataSet> dataSets = new ArrayList<IBarDataSet>();

             dataSets.add(set1);

             BarData data = new BarData(dataSets);

             data.setValueTextSize(10f);

             data.setValueTypeface(mTfLight);

             data.setBarWidth(0.8f);//--设置bar的宽度 ,取值(0-1).

             mChart.setData(data);

         }

     }

     protected RectF mOnValueSelectedRectF = new RectF();

     @Override

     public void onValueSelected(Entry e, Highlight h) {

         // TODO Auto-generated method stub

          if (e == null)

                 return;

             RectF bounds = mOnValueSelectedRectF;

             mChart.getBarBounds((BarEntry) e, bounds);

             MPPointF position = mChart.getPosition(e, AxisDependency.LEFT);

             Log.i("bounds", bounds.toString());

             Log.i("position", position.toString());

             Log.i("x-index",

                     "low: " + mChart.getLowestVisibleX() + ", high: "

                             + mChart.getHighestVisibleX());

             MPPointF.recycleInstance(position);

     }

     @Override

     public void onNothingSelected() {

         // TODO Auto-generated method stub

     }

     @Override

     public boolean onCreateOptionsMenu(Menu menu) {

         getMenuInflater().inflate(R.menu.bar, menu);

         return true;

     }

     @Override

     public boolean onOptionsItemSelected(MenuItem item) {

         switch (item.getItemId()) {

             case R.id.actionToggleValues: {

                 for (IDataSet set : mChart.getData().getDataSets())

                     set.setDrawValues(!set.isDrawValuesEnabled());

                 mChart.invalidate();

                 break;

             }

             case R.id.actionToggleHighlight: {

                 if (mChart.getData() != null) {

                     mChart.getData().setHighlightEnabled(!mChart.getData().isHighlightEnabled());

                     mChart.invalidate();

                 }

                 break;

             }

             case R.id.actionTogglePinch: {

                 if (mChart.isPinchZoomEnabled())

                     mChart.setPinchZoom(false);

                 else

                     mChart.setPinchZoom(true);

                 mChart.invalidate();

                 break;

             }

             case R.id.actionToggleAutoScaleMinMax: {

                 mChart.setAutoScaleMinMaxEnabled(!mChart.isAutoScaleMinMaxEnabled());

                 mChart.notifyDataSetChanged();

                 break;

             }

             case R.id.actionToggleBarBorders: {

                 for (IBarDataSet set : mChart.getData().getDataSets())

                     ((BarDataSet) set).setBarBorderWidth(set.getBarBorderWidth() == 1.f ? 0.f : 1.f);

                 mChart.invalidate();

                 break;

             }

             case R.id.animateX: {

                 mChart.animateX(3000);

                 break;

             }

             case R.id.animateY: {

                 mChart.animateY(3000);

                 break;

             }

             case R.id.animateXY: {

                 mChart.animateXY(3000, 3000);

                 break;

             }

             case R.id.actionSave: {

                 if (mChart.saveToGallery("title" + System.currentTimeMillis(), 50)) {

                     Toast.makeText(getApplicationContext(), "Saving SUCCESSFUL!",

                             Toast.LENGTH_SHORT).show();

                 } else

                     Toast.makeText(getApplicationContext(), "Saving FAILED!", Toast.LENGTH_SHORT)

                             .show();

                 break;

             }

         }

         return true;

     }
上述代码中关键点已经加入注释,纯属自己个个人研究理解,那里理解不对的地方,回应告知
说完树状图紧接着就是饼状图我这里分别实现了两种,不过基本code都是一样的
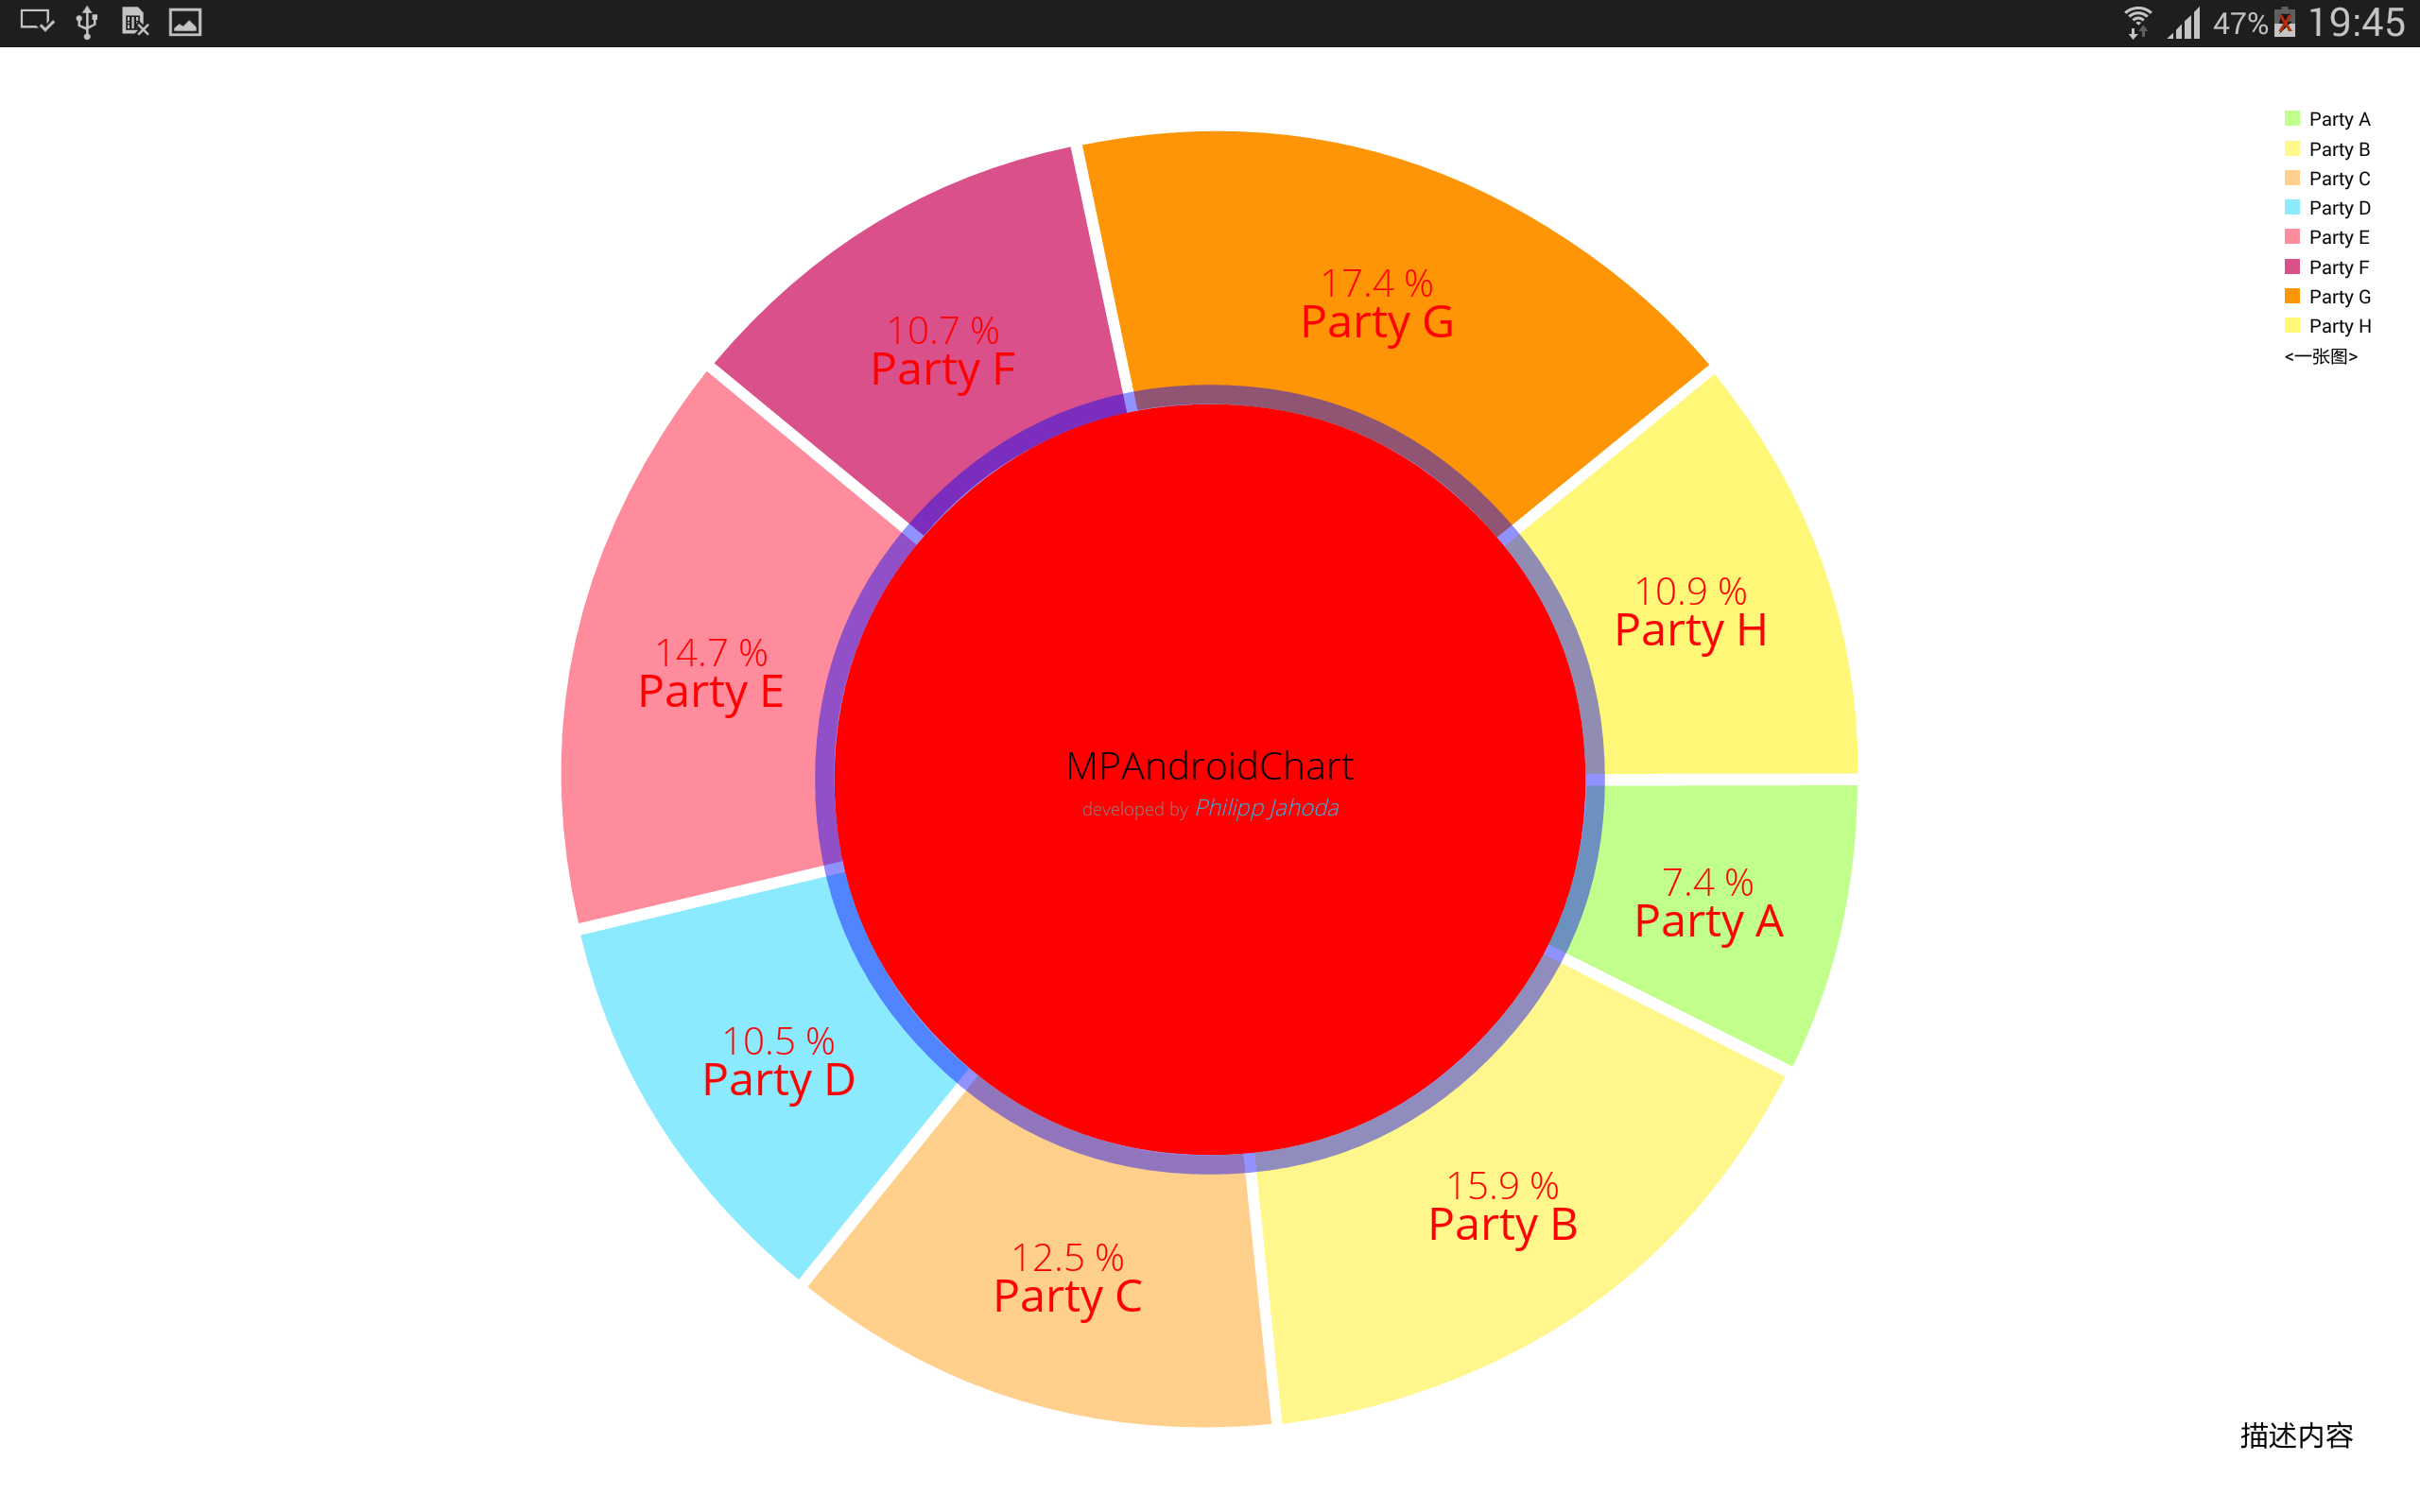
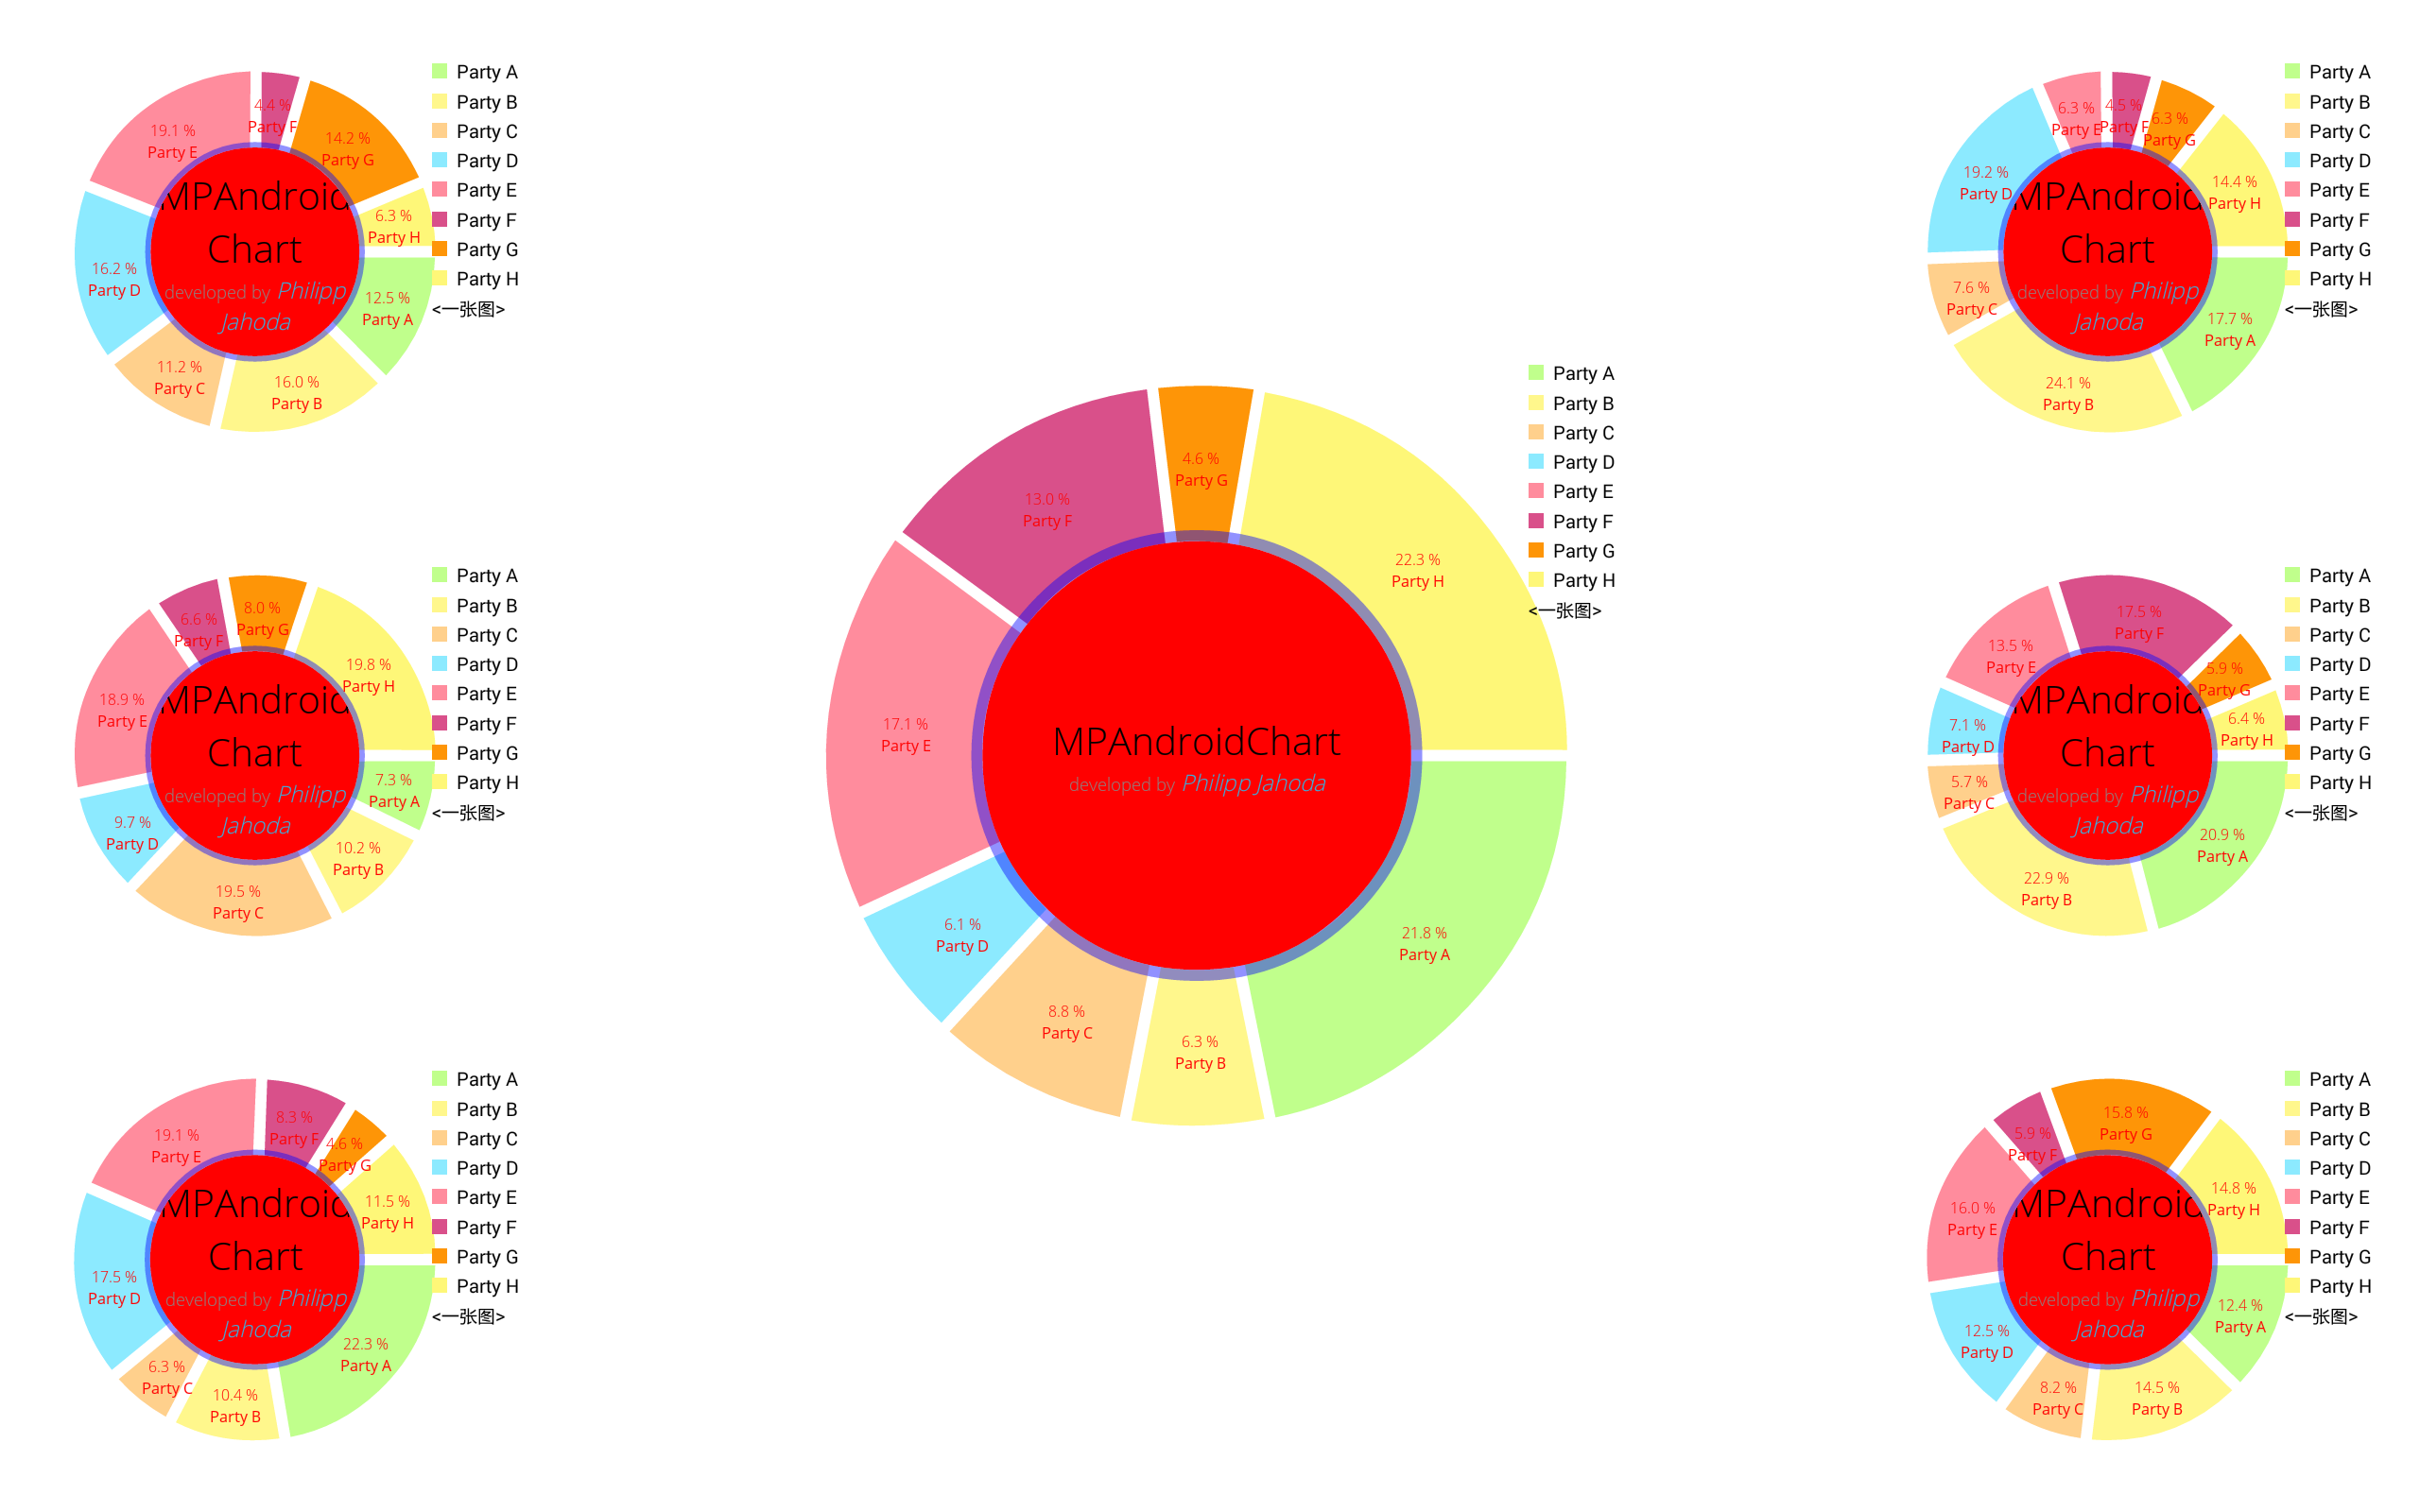
不多说直接上代码:
 public class PieChartActivity extends Activity implements OnChartValueSelectedListener {

     private PieChart mChart;

     private Typeface mTfRegular;

     private Typeface mTfLight;

     protected String[] mMonths = new String[] {

                 "Jan", "Feb", "Mar", "Apr", "May", "Jun", "Jul", "Aug", "Sep", "Okt", "Nov", "Dec"

     };

     protected String[] mParties = new String[] {

             "Party A", "Party B", "Party C", "Party D", "Party E", "Party F", "Party G", "Party H",

             "Party I", "Party J", "Party K", "Party L", "Party M", "Party N", "Party O", "Party P",

             "Party Q", "Party R", "Party S", "Party T", "Party U", "Party V", "Party W", "Party X",

             "Party Y", "Party Z"

     };

     @Override

     protected void onCreate(Bundle savedInstanceState) {

         super.onCreate(savedInstanceState);

         setContentView(R.layout.activity_main);

         mTfRegular = Typeface.createFromAsset(getAssets(), "OpenSans-Regular.ttf");

         mTfLight = Typeface.createFromAsset(getAssets(), "OpenSans-Light.ttf");

         mChart = (PieChart) findViewById(R.id.chart1);

         mChart.setUsePercentValues(true);

         mChart.setDescription("描述内容");

         mChart.setDescriptionTextSize(20);

         mChart.setExtraOffsets(5, 5, 5, 5);

         mChart.setDragDecelerationFrictionCoef(0.95f);

         mChart.setCenterTextTypeface(mTfLight);

         mChart.setCenterText(generateCenterSpannableText());//--设置中心点文字

         mChart.setDrawHoleEnabled(true);

         mChart.setHoleColor(Color.RED);

         mChart.setTransparentCircleColor(Color.BLUE);//--内圆边框色

         mChart.setTransparentCircleAlpha(110);       //--内圆边框透明度

         mChart.setHoleRadius(58f); //--内院半径

         mChart.setTransparentCircleRadius(61f); //--内圆边框大小半径

         mChart.setDrawCenterText(true);

         mChart.setRotationAngle(0); //--绘制的开始位置

         // enable rotation of the chart by touch

         mChart.setRotationEnabled(true);     //--允许旋转

         mChart.setHighlightPerTapEnabled(true); //---允许点击其中某个扇形区域.

         // add a selection listener

         mChart.setOnChartValueSelectedListener(this);

         setData(8, 100);

         mChart.animateY(1400, Easing.EasingOption.EaseInOutQuad);

         Legend l = mChart.getLegend();

         l.setPosition(LegendPosition.RIGHT_OF_CHART);

         l.setXEntrySpace(100f);

         l.setYEntrySpace(0f);

         l.setYOffset(0f);

         // entry label styling

         mChart.setEntryLabelColor(Color.RED); //--设置饼状图其中各个块上的文字颜色

         mChart.setEntryLabelTypeface(mTfRegular);//---设置字体

         mChart.setEntryLabelTextSize(24f);    //--设置字体大小

     }

      private void setData(int count, float range) {

             float mult = range;

             ArrayList<PieEntry> entries = new ArrayList<PieEntry>();

             // NOTE: The order of the entries when being added to the entries array determines their position around the center of

             // the chart.

             for (int i = 0; i < count ; i++) {

                 entries.add(new PieEntry((float) ((Math.random() * mult) + mult / 5), mParties[i % mParties.length]));

             }

 //            PieEntry --参数说明:第一个参数代表半分比,第二个参数表示名字。

             PieDataSet dataSet = new PieDataSet(entries, "<一张图>");

             dataSet.setSliceSpace(6f);//--饼状图

             dataSet.setSelectionShift(15f);//--选中饼状图时,向外扩张的大小.

             // add a lot of colors

             ArrayList<Integer> colors = new ArrayList<Integer>();

             for (int c : ColorTemplate.VORDIPLOM_COLORS)

                 colors.add(c);

             for (int c : ColorTemplate.JOYFUL_COLORS)

                 colors.add(c);

             for (int c : ColorTemplate.COLORFUL_COLORS)

                 colors.add(c);

             for (int c : ColorTemplate.LIBERTY_COLORS)

                 colors.add(c);

             for (int c : ColorTemplate.PASTEL_COLORS)

                 colors.add(c);

             colors.add(ColorTemplate.getHoloBlue());

             dataSet.setColors(colors);

             PieData data = new PieData(dataSet);

             data.setValueFormatter(new PercentFormatter());

             data.setValueTextSize(20f);       //--设置字体大小

             data.setValueTextColor(Color.RED);//--设置饼状图其中各个块上的百分比颜色

             data.setValueTypeface(mTfLight);  //--设置字体

             mChart.setData(data);

             // undo all highlights

             mChart.highlightValues(null);

             mChart.invalidate();

         }

     private SpannableString generateCenterSpannableText() {

         SpannableString s = new SpannableString("MPAndroidChart\ndeveloped by Philipp Jahoda");

         s.setSpan(new RelativeSizeSpan(1.7f), 0, 14, 0);

         s.setSpan(new StyleSpan(Typeface.NORMAL), 14, s.length() - 15, 0);

         s.setSpan(new ForegroundColorSpan(Color.GRAY), 14, s.length() - 15, 0);

         s.setSpan(new RelativeSizeSpan(.8f), 14, s.length() - 15, 0);

         s.setSpan(new StyleSpan(Typeface.ITALIC), s.length() - 14, s.length(), 0);

         s.setSpan(new ForegroundColorSpan(ColorTemplate.getHoloBlue()), s.length() - 14, s.length(), 0);

         return s;

     }

     @Override

     public boolean onCreateOptionsMenu(Menu menu) {

         getMenuInflater().inflate(R.menu.pie, menu);

         return true;

     }

     @Override

     public boolean onOptionsItemSelected(MenuItem item) {

         switch (item.getItemId()) {

             case R.id.actionToggleValues: {

                 for (IDataSet<?> set : mChart.getData().getDataSets())

                     set.setDrawValues(!set.isDrawValuesEnabled());

                 mChart.invalidate();

                 break;

             }

             case R.id.actionToggleHole: {

                 if (mChart.isDrawHoleEnabled())

                     mChart.setDrawHoleEnabled(false);

                 else

                     mChart.setDrawHoleEnabled(true);

                 mChart.invalidate();

                 break;

             }

             case R.id.actionDrawCenter: {

                 if (mChart.isDrawCenterTextEnabled())

                     mChart.setDrawCenterText(false);

                 else

                     mChart.setDrawCenterText(true);

                 mChart.invalidate();

                 break;

             }

             case R.id.actionToggleXVals: {

                 mChart.setDrawEntryLabels(!mChart.isDrawEntryLabelsEnabled());

                 mChart.invalidate();

                 break;

             }

             case R.id.actionSave: {

                 // mChart.saveToGallery("title"+System.currentTimeMillis());

                 mChart.saveToPath("title" + System.currentTimeMillis(), "");

                 break;

             }

             case R.id.actionTogglePercent:

                 mChart.setUsePercentValues(!mChart.isUsePercentValuesEnabled());

                 mChart.invalidate();

                 break;

             case R.id.animateX: {

                 mChart.animateX(1400);

                 break;

             }

             case R.id.animateY: {

                 mChart.animateY(1400);

                 break;

             }

             case R.id.animateXY: {

                 mChart.animateXY(1400, 1400);

                 break;

             }

             case R.id.actionToggleSpin: {

                 mChart.spin(1000, mChart.getRotationAngle(), mChart.getRotationAngle() + 360, Easing.EasingOption

                         .EaseInCubic);

                 break;

             }

         }

         return true;

     }

     @Override

     public void onValueSelected(Entry e, Highlight h) {

         // TODO Auto-generated method stub

          if (e == null)

                 return;

             Log.i("VAL SELECTED",

                     "Value: " + e.getY() + ", index: " + h.getX()

                             + ", DataSet index: " + h.getDataSetIndex());

     }

     @Override

     public void onNothingSelected() {

         // TODO Auto-generated method stub

         Log.i("PieChart", "nothing selected");

     }

 }
Android开源图表之树状图和饼状图的官方示例的整理的更多相关文章
- Android绘图机制(四)——使用HelloCharts开源框架搭建一系列炫酷图表,柱形图,折线图,饼状图和动画特效,抽丝剥茧带你认识图表之美
Android绘图机制(四)--使用HelloCharts开源框架搭建一系列炫酷图表,柱形图,折线图,饼状图和动画特效,抽丝剥茧带你认识图表之美 这里为什么不继续把自定义View写下去呢,因为最近项目 ...
- android 开源图表库MPChart最简单使用方法示例教程Demo--折线图 柱状图
转载请注明本文出处:http://blog.csdn.net/wingichoy/article/details/50428246 MPChart是android上一款强大的图表开源库,他可以轻松的绘 ...
- Android开源图表图形库K线图
Android开源图表图形库K线图 web端k线图一般使用TradingView,android原生的一般是在MPAndroidChart 基础上做开发的,目前看到一个比较好的K线开源组件是KChar ...
- Android开源图表库介绍
XCL-Charts XCL-Charts V1.8 Android开源图表库(XCL-Charts is a free charting library for Android platfo ...
- 我的Android进阶之旅------>【强力推荐】Android开源图表库XCL-Charts版本发布及展示页
因为要做图表相关的应用,后来百度发现了一个很好的Android开源图表库(XCL-Charts is a free charting library for Android platform.) 下面 ...
- Android开源图表库XCL-Charts版本号公布及展示页
XCL-Charts V2.1 Android开源图表库(XCL-Charts is a free charting library for Android platform.) XCL-Charts ...
- java 柱状图、折线图、饼状图
1.绘制柱状图: //BarChartTool工具类代码 package GUIview; import HibernateTool.HibernateTools; import ProductCla ...
- Qt数据可视化(散点图、折线图、柱状图、盒须图、饼状图、雷达图)开发实例
目录 散点图 折线图 柱状图 水平柱状图 水平堆叠图 水平百分比柱状图 盒须图 饼状图 雷达图 Qt散点图.折线图.柱状图.盒须图.饼状图.雷达图开发实例. 在开发过程中我们会使用多各种各样的图 ...
- android开源图表库MPAndroidChart(曲线图、直方图、饼状图)
github地址:https://github.com/PhilJay/MPAndroidChart 添加依赖: Add the following to your project level bui ...
随机推荐
- lua中的中文乱码
最近在用lua, 发现一个有点意思的槽点啊-____-! 那就是lua貌似会使用系统所用的字符集. 具体点说, 就是在windows上, 它会使用cp936来表示代码中的中文. 来个例子: print ...
- ZeroMQ接口函数之 :zmq_socket_monitor - 注册一个监控回调函数
ZeroMQ 官方地址 :http://api.zeromq.org/4-2:zmq-socket-monitor zmq_socket_monitor(3) ØMQ Manual - ØMQ/4.1 ...
- JAVA自定义异常
创建自定义异常是为了表示应用程序的一些错误类型,为代码可能发生的一个或多个问题提供新含义. 可区分代码运行时可能出现的相似问题的一个或多个错误,或给出应用程序中一组错误的特定含义. //自定义异常类需 ...
- css 一些灵动性的小方法
CSS: 1.当鼠标放到一个图片上的时候,他会给你显示一些图片的信息或者是一些其他的信息. <!DOCTYPE html> <html lang="en"> ...
- hdu 5122
只要一个数的后面有比它小的数,这个数就要移,于是从后往前一趟遍历,记录一下这些数的个数就可以了. #include"iostream" #include"stdio.h& ...
- Delphi XE6 原生解析json
Delphi XE5带了system.json单元,原生提供了json支持类.下面是解析json用法说明: 最简单的JSON大致像这样 { "date":"周二(今天, ...
- C语言中static的作用
(1)在函数体内,局部的static变量.生存周期为程序的整个生命周期:作用域却在定义了的函数体内.一个被声明为静态的变量在这个函数被调用过程中维持其值不变.因为它分配在静态存储区域,函数调用结束以后 ...
- 转一个PDevMode格式属性说明...
找不到原始来源了... //PDevMode = _devicemodeW; // _devicemodeW = record // dmDeviceName: array[0..CCHDEVICEN ...
- C语言语法分析器
#include <stdio.h> #include <string.h> ], token[]; char ch; int syn,p,m,n,sum; ]= {" ...
- git clone时,报403错误,完美解决方案
首先命令行操作结果如下: root@zhiren-PowerEdge-T110-II:/zrun# git clone https://git.coding.net/xxxxxxxx/xxxx.git ...