九、chart控件的使用(图表数据的展示)
chart属于老插件网上还有新的插件功能也更多)
Chart控件是VS自带的控件,只是比较老了,功能肯定不如现在出来的某些插件强,不过对于简单的显示还是够用;那么现在来看看chart控件的使用方法:
1.ChartAreas属性
ChartAreas属性指绘图区,一个控件可以有多个绘图区,比如我要在同一个控件内显示饼图和柱状图,肯定不能放在同一个ChartAreas区域内,应该在同一个Chart控件里增加两个ChartAreas并分别绑定Series对象。所以ChartAreas属性对应的是一个集合。
2.Series属性
Series属性就是各种图表的图形啦,比如我们要显示某月的天气变化,那么应该有这样两组数据,一组是天数,一组是每天对应的温度值,同时绑定到Series对象中,再将Series对象Add()到Chart控件的Series属性里即可。为了横向比较,例如我要看本月与上月的天气曲线变化图,并同时显示在同一个ChartAreas中,那该怎么办呢?很简单,再实例一个Series对象,将上月的天数数组与温度值数组绑定到一个新的Series2实例中,再将Series2实例Add()到Chart控件的Series属性里,此时,Chart控件的第一个绘图区ChartArea里就会有两条曲线。
3.Legends属性
Legend就是指一个图标的图例,当一个Series属性有多个Series时,或是一个Series有几组数据时,为了区分各自的颜色,通常每个Serie对象一种颜色,这就需要用到图例来指明哪个颜色的代表的是什么数据。如下图所示:
4.关于数据的绑定
将要显示的X轴和Y轴的数据分别放到两个数组里在, 然后绑定即可。
cht1.Series[0].Points.DataBindXY(x, y);
完整的代码如下:
using System;
using System.Collections.Generic;
using System.Linq;
using System.Web;
using System.Web.UI;
using System.Web.UI.WebControls;
using System.Drawing;
using System.Web.UI.DataVisualization.Charting;
public partial class _Default : System.Web.UI.Page
{
protected void Page_Load(object sender, EventArgs e)
{
string[] x = new string[] { "南山大队", "福田大队", "罗湖大队", "宝安大队", "指挥处", "大帝科技", "南山大队", "福田大队", "罗湖大队", "宝安大队", "指挥处", "大帝科技"};
double[] y = new double[] { , , , , , , , , , , , };
string[] z = new string[] { "", "", "", "", "", "", "", "", "", "", "", "" };
string[] a = new string[] { "南山大队", "福田大队", "罗湖大队", "宝安大队", "指挥处", };
double[] b = new double[] { , , , , };
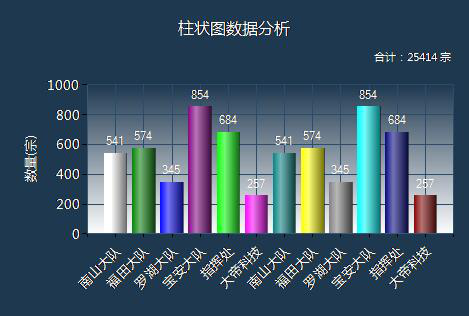
#region 柱状图
//标题
cht1.Titles.Add("柱状图数据分析");
cht1.Titles[].ForeColor = Color.White;
cht1.Titles[].Font = new Font("微软雅黑", 12f, FontStyle.Regular);
cht1.Titles[].Alignment = ContentAlignment.TopCenter;
cht1.Titles.Add("合计:25414 宗");
cht1.Titles[].ForeColor = Color.White;
cht1.Titles[].Font = new Font("微软雅黑", 8f, FontStyle.Regular);
cht1.Titles[].Alignment = ContentAlignment.TopRight;
//控件背景
cht1.BackColor = Color.Transparent;
//图表区背景
cht1.ChartAreas[].BackColor = Color.Transparent;
cht1.ChartAreas[].BorderColor = Color.Transparent;
//X轴标签间距
cht1.ChartAreas[].AxisX.Interval = ;
cht1.ChartAreas[].AxisX.LabelStyle.IsStaggered = true;
cht1.ChartAreas[].AxisX.LabelStyle.Angle = -;
cht1.ChartAreas[].AxisX.TitleFont = new Font("微软雅黑", 14f, FontStyle.Regular);
cht1.ChartAreas[].AxisX.TitleForeColor = Color.White;
//X坐标轴颜色
cht1.ChartAreas[].AxisX.LineColor = ColorTranslator.FromHtml("#38587a"); ;
cht1.ChartAreas[].AxisX.LabelStyle.ForeColor = Color.White;
cht1.ChartAreas[].AxisX.LabelStyle.Font = new Font("微软雅黑", 10f, FontStyle.Regular);
//X坐标轴标题
//cht1.ChartAreas[0].AxisX.Title = "数量(宗)";
//cht1.ChartAreas[0].AxisX.TitleFont = new Font("微软雅黑", 10f, FontStyle.Regular);
//cht1.ChartAreas[0].AxisX.TitleForeColor = Color.White;
//cht1.ChartAreas[0].AxisX.TextOrientation = TextOrientation.Horizontal;
//cht1.ChartAreas[0].AxisX.ToolTip = "数量(宗)";
//X轴网络线条
cht1.ChartAreas[].AxisX.MajorGrid.Enabled = true;
cht1.ChartAreas[].AxisX.MajorGrid.LineColor = ColorTranslator.FromHtml("#2c4c6d");
//Y坐标轴颜色
cht1.ChartAreas[].AxisY.LineColor = ColorTranslator.FromHtml("#38587a");
cht1.ChartAreas[].AxisY.LabelStyle.ForeColor = Color.White;
cht1.ChartAreas[].AxisY.LabelStyle.Font = new Font("微软雅黑", 10f, FontStyle.Regular);
//Y坐标轴标题
cht1.ChartAreas[].AxisY.Title = "数量(宗)";
cht1.ChartAreas[].AxisY.TitleFont = new Font("微软雅黑", 10f, FontStyle.Regular);
cht1.ChartAreas[].AxisY.TitleForeColor = Color.White;
cht1.ChartAreas[].AxisY.TextOrientation = TextOrientation.Rotated270;
cht1.ChartAreas[].AxisY.ToolTip = "数量(宗)";
//Y轴网格线条
cht1.ChartAreas[].AxisY.MajorGrid.Enabled = true;
cht1.ChartAreas[].AxisY.MajorGrid.LineColor = ColorTranslator.FromHtml("#2c4c6d");
cht1.ChartAreas[].AxisY2.LineColor = Color.Transparent;
cht1.ChartAreas[].BackGradientStyle = GradientStyle.TopBottom;
Legend legend = new Legend("legend");
legend.Title = "legendTitle";
cht1.Series[].XValueType = ChartValueType.String; //设置X轴上的值类型
cht1.Series[].Label = "#VAL"; //设置显示X Y的值
cht1.Series[].LabelForeColor = Color.White;
cht1.Series[].ToolTip = "#VALX:#VAL"; //鼠标移动到对应点显示数值
cht1.Series[].ChartType = SeriesChartType.Column; //图类型(折线)
cht1.Series[].Color = Color.Lime;
cht1.Series[].LegendText = legend.Name;
cht1.Series[].IsValueShownAsLabel = true;
cht1.Series[].LabelForeColor = Color.White;
cht1.Series[].CustomProperties = "DrawingStyle = Cylinder";
cht1.Legends.Add(legend);
cht1.Legends[].Position.Auto = false;
//绑定数据
cht1.Series[].Points.DataBindXY(x, y);
cht1.Series[].Points[].Color = Color.White;
cht1.Series[].Palette = ChartColorPalette.Bright;
#endregion
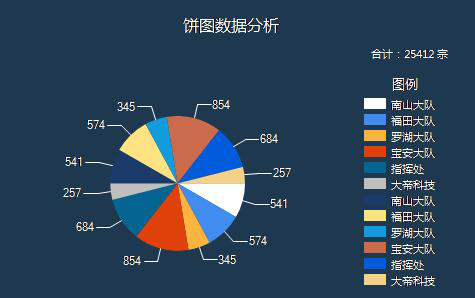
#region 饼图
//标题
cht2.Titles.Add("饼图数据分析");
cht2.Titles[].ForeColor = Color.White;
cht2.Titles[].Font = new Font("微软雅黑", 12f, FontStyle.Regular);
cht2.Titles[].Alignment = ContentAlignment.TopCenter;
cht2.Titles.Add("合计:25412 宗");
cht2.Titles[].ForeColor = Color.White;
cht2.Titles[].Font = new Font("微软雅黑", 8f, FontStyle.Regular);
cht2.Titles[].Alignment = ContentAlignment.TopRight;
//控件背景
cht2.BackColor = Color.Transparent;
//图表区背景
cht2.ChartAreas[].BackColor = Color.Transparent;
cht2.ChartAreas[].BorderColor = Color.Transparent;
//X轴标签间距
cht2.ChartAreas[].AxisX.Interval = ;
cht2.ChartAreas[].AxisX.LabelStyle.IsStaggered = true;
cht2.ChartAreas[].AxisX.LabelStyle.Angle = -;
cht2.ChartAreas[].AxisX.TitleFont = new Font("微软雅黑", 14f, FontStyle.Regular);
cht2.ChartAreas[].AxisX.TitleForeColor = Color.White;
//X坐标轴颜色
cht2.ChartAreas[].AxisX.LineColor = ColorTranslator.FromHtml("#38587a"); ;
cht2.ChartAreas[].AxisX.LabelStyle.ForeColor = Color.White;
cht2.ChartAreas[].AxisX.LabelStyle.Font = new Font("微软雅黑", 10f, FontStyle.Regular);
//X坐标轴标题
cht2.ChartAreas[].AxisX.Title = "数量(宗)";
cht2.ChartAreas[].AxisX.TitleFont = new Font("微软雅黑", 10f, FontStyle.Regular);
cht2.ChartAreas[].AxisX.TitleForeColor = Color.White;
cht2.ChartAreas[].AxisX.TextOrientation = TextOrientation.Horizontal;
cht2.ChartAreas[].AxisX.ToolTip = "数量(宗)";
//X轴网络线条
cht2.ChartAreas[].AxisX.MajorGrid.Enabled = true;
cht2.ChartAreas[].AxisX.MajorGrid.LineColor = ColorTranslator.FromHtml("#2c4c6d");
//Y坐标轴颜色
cht2.ChartAreas[].AxisY.LineColor = ColorTranslator.FromHtml("#38587a");
cht2.ChartAreas[].AxisY.LabelStyle.ForeColor = Color.White;
cht2.ChartAreas[].AxisY.LabelStyle.Font = new Font("微软雅黑", 10f, FontStyle.Regular);
//Y坐标轴标题
cht2.ChartAreas[].AxisY.Title = "数量(宗)";
cht2.ChartAreas[].AxisY.TitleFont = new Font("微软雅黑", 10f, FontStyle.Regular);
cht2.ChartAreas[].AxisY.TitleForeColor = Color.White;
cht2.ChartAreas[].AxisY.TextOrientation = TextOrientation.Rotated270;
cht2.ChartAreas[].AxisY.ToolTip = "数量(宗)";
//Y轴网格线条
cht2.ChartAreas[].AxisY.MajorGrid.Enabled = true;
cht2.ChartAreas[].AxisY.MajorGrid.LineColor = ColorTranslator.FromHtml("#2c4c6d");
cht2.ChartAreas[].AxisY2.LineColor = Color.Transparent;
//背景渐变
cht2.ChartAreas[].BackGradientStyle = GradientStyle.None;
//图例样式
Legend legend2 = new Legend("#VALX");
legend2.Title = "图例";
legend2.TitleBackColor = Color.Transparent;
legend2.BackColor = Color.Transparent;
legend2.TitleForeColor = Color.White;
legend2.TitleFont = new Font("微软雅黑", 10f, FontStyle.Regular);
legend2.Font = new Font("微软雅黑", 8f, FontStyle.Regular);
legend2.ForeColor = Color.White;
cht2.Series[].XValueType = ChartValueType.String; //设置X轴上的值类型
cht2.Series[].Label = "#VAL"; //设置显示X Y的值
cht2.Series[].LabelForeColor = Color.White;
cht2.Series[].ToolTip = "#VALX:#VAL(宗)"; //鼠标移动到对应点显示数值
cht2.Series[].ChartType = SeriesChartType.Pie; //图类型(折线)
cht2.Series[].Color = Color.Lime;
cht2.Series[].LegendText = legend2.Name;
cht2.Series[].IsValueShownAsLabel = true;
cht2.Series[].LabelForeColor = Color.White;
cht2.Series[].CustomProperties = "DrawingStyle = Cylinder";
cht2.Series[].CustomProperties = "PieLabelStyle = Outside";
cht2.Legends.Add(legend2);
cht2.Legends[].Position.Auto = true;
cht2.Series[].IsValueShownAsLabel = true;
//是否显示图例
cht2.Series[].IsVisibleInLegend = true;
cht2.Series[].ShadowOffset = ;
//饼图折线
cht2.Series[]["PieLineColor"] = "White";
//绑定数据
cht2.Series[].Points.DataBindXY(x, y);
cht2.Series[].Points[].Color = Color.White;
//绑定颜色
cht2.Series[].Palette = ChartColorPalette.BrightPastel;
#endregion
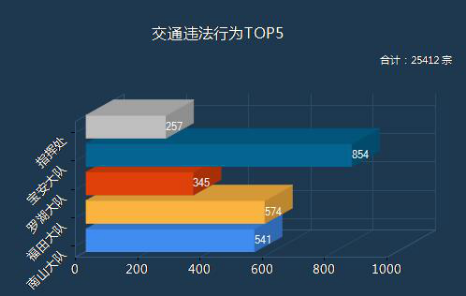
#region Bar图
//标题
cht3.Titles.Add("交通违法行为TOP5");
cht3.Titles[].ForeColor = Color.White;
cht3.Titles[].Font = new Font("微软雅黑", 12f, FontStyle.Regular);
cht3.Titles[].Alignment = ContentAlignment.TopCenter;
cht3.Titles.Add("合计:25412 宗 ");
cht3.Titles[].ForeColor = Color.White;
cht3.Titles[].Font = new Font("微软雅黑", 8f, FontStyle.Regular);
cht3.Titles[].Alignment = ContentAlignment.TopRight;
//控件背景
cht3.BackColor = Color.Transparent;
//图表区背景
cht3.ChartAreas[].BackColor = Color.Transparent;
cht3.ChartAreas[].BorderColor = Color.Transparent;
//X轴标签间距
cht3.ChartAreas[].AxisX.Interval = ;
cht3.ChartAreas[].AxisX.LabelStyle.IsStaggered = true;
cht3.ChartAreas[].AxisX.LabelStyle.Angle = -;
cht3.ChartAreas[].AxisX.TitleFont = new Font("微软雅黑", 14f, FontStyle.Regular);
cht3.ChartAreas[].AxisX.TitleForeColor = Color.White;
//X坐标轴颜色
cht3.ChartAreas[].AxisX.LineColor = ColorTranslator.FromHtml("#38587a"); ;
cht3.ChartAreas[].AxisX.LabelStyle.ForeColor = Color.White;
cht3.ChartAreas[].AxisX.LabelStyle.Font = new Font("微软雅黑", 10f, FontStyle.Regular);
//X坐标轴标题
//cht3.ChartAreas[0].AxisX.Title = "数量(宗)";
//cht3.ChartAreas[0].AxisX.TitleFont = new Font("微软雅黑", 10f, FontStyle.Regular);
//cht3.ChartAreas[0].AxisX.TitleForeColor = Color.White;
//cht3.ChartAreas[0].AxisX.TextOrientation = TextOrientation.Auto;
//cht3.ChartAreas[0].AxisX.ToolTip = "数量(宗)";
//X轴网络线条
cht3.ChartAreas[].AxisX.MajorGrid.Enabled = true;
cht3.ChartAreas[].AxisX.MajorGrid.LineColor = ColorTranslator.FromHtml("#2c4c6d");
//Y坐标轴颜色
cht3.ChartAreas[].AxisY.LineColor = ColorTranslator.FromHtml("#38587a");
cht3.ChartAreas[].AxisY.LabelStyle.ForeColor = Color.White;
cht3.ChartAreas[].AxisY.LabelStyle.Font = new Font("微软雅黑", 10f, FontStyle.Regular);
//Y坐标轴标题
//cht3.ChartAreas[0].AxisY.Title = "数量(宗)";
//cht3.ChartAreas[0].AxisY.TitleFont = new Font("微软雅黑", 10f, FontStyle.Regular);
//cht3.ChartAreas[0].AxisY.TitleForeColor = Color.White;
//cht3.ChartAreas[0].AxisY.TextOrientation = TextOrientation.Auto;
//cht3.ChartAreas[0].AxisY.ToolTip = "数量(宗)";
//Y轴网格线条
cht3.ChartAreas[].AxisY.MajorGrid.Enabled = true;
cht3.ChartAreas[].AxisY.MajorGrid.LineColor = ColorTranslator.FromHtml("#2c4c6d");
cht3.ChartAreas[].AxisY2.LineColor = Color.Transparent;
cht3.ChartAreas[].AxisX.IsMarginVisible = false;
cht3.ChartAreas[].Area3DStyle.Enable3D = true;
//背景渐变
cht2.ChartAreas[].BackGradientStyle = GradientStyle.None;
//图例样式
Legend legend3 = new Legend("#VALX");
legend3.Title = "图例";
legend3.TitleBackColor = Color.Transparent;
legend3.BackColor = Color.Transparent;
legend3.TitleForeColor = Color.White;
legend3.TitleFont = new Font("微软雅黑", 10f, FontStyle.Regular);
legend3.Font = new Font("微软雅黑", 8f, FontStyle.Regular);
legend3.ForeColor = Color.White;
cht3.Series[].XValueType = ChartValueType.String; //设置X轴上的值类型
cht3.Series[].Label = "#VAL"; //设置显示X Y的值
cht3.Series[].LabelForeColor = Color.White;
cht3.Series[].ToolTip = "#VALX:#VAL(宗)"; //鼠标移动到对应点显示数值
cht3.Series[].ChartType = SeriesChartType.Bar; //图类型(折线)
cht3.Series[].Color = Color.Lime;
//cht3.Series[0].LegendText = legend3.Name;
cht3.Series[].IsValueShownAsLabel = true;
cht3.Series[].LabelForeColor = Color.White;
cht3.Series[].CustomProperties = "DrawingStyle = Cylinder";
cht3.Series[].CustomProperties = "PieLabelStyle = Outside";
//cht3.Legends.Add(legend3);
//cht3.Legends[0].Position.Auto = true;
//是否显示图例
cht3.Series[].IsVisibleInLegend = true;
cht3.Series[].ShadowOffset = ;
//饼图折线
cht3.Series[]["PieLineColor"] = "White";
//绑定数据
cht3.Series[].Points.DataBindXY(a, b);
//cht3.Series[0].Points[0].Color = Color.White;
//绑定颜色
cht3.Series[].Palette = ChartColorPalette.BrightPastel;
//for (int n = 0; n < x.Length; n++)
//{
// int ptIdx = cht3.Series[0].Points.AddY(Convert.ToDouble(y[n]));
// DataPoint pt = this.cht3.Series[0].Points[ptIdx];
// pt.LegendText = x[n] + " " + "#PERCENT{P2}" + " [ " + "#VAL{D} 次" + " ]";//右边标签列显示的文字
// pt.Label = x[n] + " " + "#PERCENT{P2}" + " [ " + "#VAL{D} 次" + " ]"; //圆饼外显示的信息
// // pt.LabelToolTip = "#PERCENT{P2}";
// //pt.LabelBorderColor = Color.Red;//文字背景色
//}
#endregion
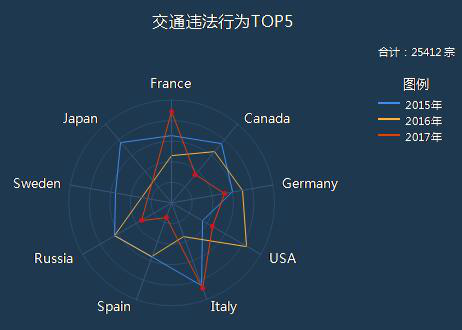
#region 雷达图
// //标题
cht4.Titles.Add("交通违法行为TOP5");
cht4.Titles[].ForeColor = Color.White;
cht4.Titles[].Font = new Font("微软雅黑", 12f, FontStyle.Regular);
cht4.Titles[].Alignment = ContentAlignment.TopCenter;
cht4.Titles.Add("合计:25412 宗 ");
cht4.Titles[].ForeColor = Color.White;
cht4.Titles[].Font = new Font("微软雅黑", 8f, FontStyle.Regular);
cht4.Titles[].Alignment = ContentAlignment.TopRight;
//控件背景
cht4.BackColor = Color.Transparent;
cht4.ChartAreas[].BackColor = Color.Transparent;
cht4.ChartAreas[].BorderColor = Color.Transparent;
//X轴标签间距
cht4.ChartAreas[].AxisX.Interval = ;
cht4.ChartAreas[].AxisX.LabelStyle.IsStaggered = true;
cht4.ChartAreas[].AxisX.LabelStyle.Angle = -;
cht4.ChartAreas[].AxisX.TitleFont = new Font("微软雅黑", 14f, FontStyle.Regular);
cht4.ChartAreas[].AxisX.TitleForeColor = Color.White;
//X坐标轴颜色
cht4.ChartAreas[].AxisX.LineColor = ColorTranslator.FromHtml("#38587a"); ;
cht4.ChartAreas[].AxisX.LabelStyle.ForeColor = Color.White;
cht4.ChartAreas[].AxisX.LabelStyle.Font = new Font("微软雅黑", 10f, FontStyle.Regular);
//X坐标轴标题
//cht4.ChartAreas[0].AxisX.Title = "数量(宗)";
//cht4.ChartAreas[0].AxisX.TitleFont = new Font("微软雅黑", 10f, FontStyle.Regular);
//cht4.ChartAreas[0].AxisX.TitleForeColor = Color.White;
//cht4.ChartAreas[0].AxisX.TextOrientation = TextOrientation.Auto;
//cht4.ChartAreas[0].AxisX.ToolTip = "数量(宗)";
//X轴网络线条
cht4.ChartAreas[].AxisX.MajorGrid.Enabled = true;
cht4.ChartAreas[].AxisX.MajorGrid.LineColor = ColorTranslator.FromHtml("#2c4c6d");
//Y坐标轴颜色
cht4.ChartAreas[].AxisY.LineColor = ColorTranslator.FromHtml("#38587a");
cht4.ChartAreas[].AxisY.LabelStyle.ForeColor = Color.White;
cht4.ChartAreas[].AxisY.LabelStyle.Font = new Font("微软雅黑", 10f, FontStyle.Regular);
//Y坐标轴标题
//cht4.ChartAreas[0].AxisY.Title = "数量(宗)";
//cht4.ChartAreas[0].AxisY.TitleFont = new Font("微软雅黑", 10f, FontStyle.Regular);
//cht4.ChartAreas[0].AxisY.TitleForeColor = Color.White;
//cht4.ChartAreas[0].AxisY.TextOrientation = TextOrientation.Auto;
//cht4.ChartAreas[0].AxisY.ToolTip = "数量(宗)";
//Y轴网格线条
cht4.ChartAreas[].AxisY.MajorGrid.Enabled = true;
cht4.ChartAreas[].AxisY.MajorGrid.LineColor = ColorTranslator.FromHtml("#2c4c6d");
cht4.ChartAreas[].AxisY2.LineColor = Color.Transparent;
cht4.ChartAreas[].AxisX.IsMarginVisible = false;
cht4.ChartAreas[].Area3DStyle.Enable3D = true;
cht4.ChartAreas[].AxisX.IsInterlaced = false;
cht4.ChartAreas[].AxisX.IsMarginVisible = false;
//刻度线
cht4.ChartAreas[].AxisY.MajorTickMark.Enabled = false;
//cht4.ChartAreas[0].AxisX.MajorGrid.Enabled = false;
//cht4.ChartAreas[0].AxisY.MajorGrid.Enabled = false;
//cht4.ChartAreas[0].AxisX.MajorTickMark.Enabled = false;
cht4.ChartAreas[].AxisY.LabelStyle.Enabled = false;
//背景渐变
cht4.ChartAreas[].BackGradientStyle = GradientStyle.None;
//cht4.ChartAreas[0].AxisX2.InterlacedColor = Color.Red;
//cht4.ChartAreas[0].AxisY2.InterlacedColor = Color.Red;
//cht4.ChartAreas[0].BorderWidth = 0;
//cht4.ChartAreas[0].BackSecondaryColor = Color.Red;
//cht4.ChartAreas[0].BackImageTransparentColor = Color.Red;
//cht4.ChartAreas[0].AxisX.InterlacedColor = Color.Red;
//cht4.ChartAreas[0].AxisX.LineColor = Color.Red;
//cht4.ChartAreas[0].AxisX2.LineColor = Color.Red;
//cht4.ChartAreas[0].AxisX2.MajorGrid.LineColor = Color.Red;
//cht4.ChartAreas[0].AxisX2.MajorTickMark.LineColor = Color.Red;
//cht4.ChartAreas[0].AxisX2.MinorTickMark.LineColor = Color.Red;
//cht4.ChartAreas[0].AxisY.InterlacedColor = Color.Red;
//cht4.ChartAreas[0].AxisY.LineColor = Color.Red;
//cht4.ChartAreas[0].AxisY2.InterlacedColor = Color.Red;
//cht4.ChartAreas[0].AxisY2.LineColor = Color.Red;
//cht4.ChartAreas[0].AxisY2.MajorGrid.LineColor = Color.Red;
//cht4.ChartAreas[0].AxisY2.MajorTickMark.LineColor = Color.Red;
//cht4.ChartAreas[0].AxisY2.MinorTickMark.LineColor = Color.Red;
//图例样式
Legend legend4 = new Legend();
legend4.Title = "图例";
legend4.TitleBackColor = Color.Transparent;
legend4.BackColor = Color.Transparent;
legend4.TitleForeColor = Color.White;
legend4.TitleFont = new Font("微软雅黑", 10f, FontStyle.Regular);
legend4.Font = new Font("微软雅黑", 8f, FontStyle.Regular);
legend4.ForeColor = Color.White;
cht4.Legends.Add(legend4);
cht4.Legends[].Position.Auto = true;
//Series1
cht4.Series[].XValueType = ChartValueType.String;
cht4.Series[].Label = "#VAL";
cht4.Series[].LabelForeColor = Color.White;
cht4.Series[].ToolTip = "#LEGENDTEXT:#VAL(宗)";
cht4.Series[].ChartType = SeriesChartType.Radar;
cht4.Series[]["RadarDrawingStyle"] = "Line";
cht4.Series[].LegendText = "2015年";
cht4.Series[].IsValueShownAsLabel = true;
//Series2
cht4.Series.Add(new Series("Series2"));
cht4.Series[].Label = "#VAL";
cht4.Series[].LabelForeColor = Color.White;
cht4.Series[].ToolTip = "#LEGENDTEXT:#VAL(宗)";
cht4.Series[].ChartType = SeriesChartType.Radar;
cht4.Series[]["RadarDrawingStyle"] = "Line";
cht4.Series[].LegendText = "2016年";
cht4.Series[].IsValueShownAsLabel = true;
//Series3
cht4.Series.Add(new Series("Series3"));
cht4.Series[].Label = "#VAL";
cht4.Series[].LabelForeColor = Color.White;
cht4.Series[].ToolTip = "#LEGENDTEXT:#VAL(宗)";
cht4.Series[].ChartType = SeriesChartType.Radar;
cht4.Series[]["RadarDrawingStyle"] = "Line";
cht4.Series[].LegendText = "2017年";
cht4.Series[].IsValueShownAsLabel = true;
double[] yValues = { 65.62, 75.54, 60.45, 34.73, 85.42, 55.9, 63.6, 55.2, 77.1 };
string[] xValues = { "France", "Canada", "Germany", "USA", "Italy", "Spain", "Russia", "Sweden", "Japan" };
//Seris2
double[] y2 = { 45.62, 65.54, 70.45, 84.73, 35.42, 55.9, 63.6 };
double[] y3 = { 88.62, 35.54, 52.45, 45.73, 88.42, 14.9, 33.6 };
this.cht4.Series[].Points.DataBindXY(xValues, yValues);
this.cht4.Series[].Points.DataBindY(y2);
this.cht4.Series[].Points.DataBindY(y3);
//设置X轴显示间隔为1,X轴数据比较多的时候比较有用
cht4.ChartAreas[].AxisX.LabelStyle.Interval = ;
//设置XY轴标题的名称所在位置位远
cht4.ChartAreas[].AxisX.TitleAlignment = StringAlignment.Near;
for (int i = ; i < cht4.Series[].Points.Count; i++)
{
cht4.Series[].Points[i].MarkerStyle = MarkerStyle.Circle;//设置折点的风格
cht4.Series[].Points[i].MarkerColor = Color.Red;//设置seires中折点的颜色
// cht4.Series[1].Points[i].MarkerStyle = MarkerStyle.Square;//设置折点的风格
// cht4.Series[1].Points[i].MarkerColor = Color.Blue;//设置seires中折点的颜色
// cht4.Series[2].Points[i].MarkerStyle = MarkerStyle.Square;//设置折点的风格
// cht4.Series[2].Points[i].MarkerColor = Color.Green;//设置seires中折点的颜色 }
for (int i = ; i < cht4.Series.Count; i++)
{
for (int j = ; j < cht4.Series[i].Points.Count; j++)
{
cht4.Series[i].Points[j].Label = " ";
//cht4.Series[i].Points[j].LabelToolTip = "string.Empty"; }
}
//cht4.ImageType = ChartImageType.Jpeg;
//反锯齿
cht4.AntiAliasing = AntiAliasingStyles.All;
//调色板 磨沙:SemiTransparent
cht4.Palette = ChartColorPalette.BrightPastel;
cht4.Series[].ChartType = SeriesChartType.Radar;
cht4.Series[].ChartType = SeriesChartType.Radar;
cht4.Series[].ChartType = SeriesChartType.Radar;
cht4.Width = ;
cht4.Height = ;
#endregion
/*
#VALX 显示当前图例的X轴的对应文本(或数据)
#VAL, #VALY, 显示当前图例的Y轴的对应文本(或数据)
#VALY2, #VALY3, 显示当前图例的辅助Y轴的对应文本(或数据)
#SER: 显示当前图例的名称
#LABEL 显示当前图例的标签文本
#INDEX 显示当前图例的索引
#PERCENT 显示当前图例的所占的百分比
#TOTAL 总数量
#LEGENDTEXT 图例文本
*/
}
}
九、chart控件的使用(图表数据的展示)的更多相关文章
- 用Chart控件绘制动态图表
进行程序设计时,选用一个合适的ActiveX控件,有时可大大减少编程工作量.ActiveX 控件(又称OCX)基于COM技术,作为独立的软件模块,它可以在任何程序设计语言中插入使用.本文仅以VC++为 ...
- C# Chart控件教程
一.什么是Micosoft.Chart.Controls Micosoft.Chart.Controls是微软自带的一个图形可视化的组件,可以在Web程序和窗体程序中(Windowsform)中使用. ...
- ASP.NET中的chart控件绑定SQL Server数据库
网上很多的chart控件的实例都没有绑定数据库,经过一番摸索后,终于实现了chart控件绑定数据库. 首先,在Visual Studio中建立一个网站,新建一个WebForm项目,名称为ChartTe ...
- C# Chart控件,chart、Series、ChartArea曲线图绘制的重要属性
http://blog.sina.com.cn/s/blog_621e24e20101cp64.html 为避免耽误不喜欢这种曲线图效果的亲们的时间,先看一下小DEMO效果图: 先简单说一下,从图中可 ...
- javascript曲线图和面积图Line & Area chart控件功能及下载
Line & Area chart 控件是一款新型的.可用性极强的曲线图和面积图产品.一个您网站的访问者可以放大他感兴趣的一段区域,打开和关闭数值气球,并可显示和隐藏图表.您能创建简单.堆积. ...
- 使用WinForm Chart控件 制作饼装,柱状,折线图
http://blog.csdn.net/dream2050csdn/article/details/53510340 chart控件的属性很多,主要用到Chart控件图表区域的属性有五个属性 1.A ...
- VS2010 Chart控件(一)Chart控件在ASP.NET网站中的应用示例详解(C#语言)
步骤如下: 1. Chart控件(一)Chart控件在ASP.NET网站中的应用示例详解(C#语言)" title="VS2010 Chart控件(一)Chart控件在ASP.NE ...
- Chart控件,chart、Series、ChartArea曲线图绘制的重要属性介绍
先简单说一下,从图中可以看到一个chart可以绘制多个ChartArea,每个ChartArea都可以绘制多条Series.ChartArea就是就是绘图区域,可以有多个ChartArea叠加在一起, ...
- C# chart控件基础使用
基本介绍:chart(图表) 功能:主要用来绘制折线图,柱状图与饼状图,也可达到动态效果(例如作示波器): 需要说明 一个chart可以包含多个chartArea. chartArea是具体的坐标区域 ...
随机推荐
- DUI-Windows消息机制要点(34篇)
[隐藏] 1窗口过程概念 2消息类型 2.1系统定义消息 2.1.1窗口消息 2.1.2命令消息 2.1.3控件通知消息 2.1.4程序定义消息 3消息队列 3.1系统消息队列 3.2线程消息队列 4 ...
- C# 中使用不安全代码(unsafe、指针)实践
命题 根据指定的字符集合(字典),按排列组合的规则(允许重复),生成指定长度的所有字符串.如下代码: class Program { static void Main(string[] args) { ...
- 爬取虎扑NBA首页主干道推荐贴的一只小爬虫,日常爬不冷笑话解闷
虎扑是广大jrs的家园,步行街是这个家园里最繁华的地段.据称广大jrs平均学历985,步行街街薪30w起步. 大学时经舍友安利,开始了解虎扑,主要是看看NBA的一些资讯. 偶尔也上上这个破街,看看jr ...
- Yolov3代码分析与训练自己数据集
现在要针对我们需求引入检测模型,只检测人物,然后是图像能侧立,这样人物在里面占比更多,也更清晰,也不需要检测人占比小的情况,如下是针对这个需求,用的yolov3-tiny模型训练后的效果. Yolov ...
- Django 你需要掌握的模型层(标签、过滤器、模板的继承与导入)
Django 模型层(标签.过滤器.模板的继承与导入) 好文章来自超哥:https://www.cnblogs.com/guanchao/p/11006062.html 过滤器/自定义过滤器 模板 ...
- Mac安装MySQL-python报错解决
Mac安装MySQL-pyhton报错 今天在Mac上安装MySQL-python报错,搜遍网络都说什么mysql config路径问题,但是都不行. 解决方案 一开始遇到的问题是: Complete ...
- jenkin+Git子模块自动拉取代码
jenkins+Git子模块自动拉取代码 添加Git子模块 先克隆想要添加子模块的仓库git clone ssh://git@ip:port/user/project.git,这个是主目录. 进入仓库 ...
- 另一个ACM之路建议
ACM联系建议 一位高手对我的建议: 一般要做到50行以内的程序不用调试.100行以内的二分钟内调试成功.acm主要是考算法的 ,主要时间是花在思考算法上,不是花在写程序与debug上. 下面给个计划 ...
- Effective Java - 静态方法与构造器
目录 用静态工厂方法替代构造器? 静态工厂有名称 静态工厂不必重新创建一个对象 静态工厂可以返回任何子类型对象 静态工厂返回的类可以动态变化 静态工厂返回的类可以不存在 静态工厂方法的缺点 静态工厂方 ...
- JavaScript 基础知识 变量与数据类型
一.区分大小写 JS中一切(变量/函数名/操作符)都是严格区分大小写的 二.标识符 变量.函数.属性的名字以及函数的参数 命名规则:1.第一个字符可以是字母.下划线.美元符号$ 2.其他的字符可以是字 ...