understanding checkpoint_completion_target
Starting new blog series – explanation of various configuration parameters.
I will of course follow no schedule or order – if I'd had to – it would be my job, and in this way – it's fun.
First configuration parameter to write about is checkpoint_completion_target.
First, let's think about what checkpoint is.
As you perhaps know PostgreSQL keeps cache of pages (8kB (by default) disk blocks) in RAM. To make it available to all backends, it's stored in shared_buffers, and it's (usually) taking most of the shared_buffers.
Whenever Pg needs to do anything with given page, it checks if it is in shared_buffers, and if not – it loads it (doing some logic to make sure it will not exceed size of shared_buffers by adding new page).
This also happens on writes.
Whenever you write anything (think: insert, update, delete) the change is not written to table. Instead it is written to these pages in memory.
Now of course is a question – what happens if there will be server crash? Since the data is in ram will I lose it? No. Because data is also written to “WAL". WAL are those 16MB files in pg_xlog directory. These are (virtually) never read, and just contain list of changes to pages.
So, the flow looks like this: you issue insert. PostgreSQL loads page to memory (if it wasn't there earlier), modifies it, and writes information about the modification to WAL. The change is not applied to real table files.
Now – after some time – there is a lot of modified pages in memory, that are not applied to table. And this is when CHECKPOINT happens. There is some logic when checkpoint is issued (I will write about it in some later blogpost), but for now, the important part is: when checkpoint happens, all modified (so called dirty) pages are written to actual table and index files.
So far so good? Hope so.
Now – size of checkpoint is of course variable, but depends on size of shared_buffers, and how often you have checkpoints, and how write-intensive your application is.
Let's imagine, that you have server with 100GB of shared_buffers (that's a lot, but not unheard-of). And it's write intensive. So, when checkpoint happens, it could need to “dump" 100GB of data to disk. More or less at once. That's a problem. Because this is huge spike in I/O, and will definitely influence concurrent performance of normal queries.
This is where checkpoint_completion_target shows.
Generally it is a parameter that makes PostgreSQL try to write the data slower – to finish in checkpoint_completion_target * checkpoint_timeout time. Usually you have checkpoint_timeout set to 5 minutes (unless you modified it), and default checkpoint_completion_target is 0.5. This means that PostgreSQL will try to make the checkpoint take 2.5 minutes – to make I/O load lower.
Let's come back to our example. We have 100GB of data to be written to files. And my disk can sustain 1GB per second of writes (that's big server with great I/O). When doing normal checkpoint (the way it was before 8.3), it would cause 100 seconds to 100% utilization of bandwidth to write the data.
But – with checkpoint_completion_target set to 0.5 – PostgreSQL will try to write the data in 2.5 minutes – thus effectively using only ~ 700MB/s of bandwidth, and leaving 30% of I/O capacity for other tasks. That's huge benefit.
The problem with this approach is relatively simple – since checkpoint take longer to write, old, obsolete wal segments stay longer in pg_xlog directory, which will grow larger.
At the time of 8.2, number of files in pg_xlog directory was usually going up to 2 * checkpoint_segments + 1.
Now, it can be estimated to be ( 2 + checkpoint_completion_target ) * checkpoint_segments + 1.
If you read above paragraphs with attention to detail you saw that I used word “try". Reason is very simple – effective I/O bandwidth is variable, so there are no guarantees. So, let's see how it really works.
For tests, I use my test machine, with setup that puts data, xlogs and query logs (useful to test for locks/slowdowns) on separate partitions.
While putting these on separate partitions of the same disk will not increase performance, it will let me accurately monitor what happens on each of the partitions while testing.
With these 3 partitions, I arranged them so:
- sda1 – swap, shouldn't be used, so it's not important
- sda2 – root filesystem, and place where query and iostat logs are stored
- sda3 – $PGDATA
- sda4 – pg_xlog – wal segments
To test Pg, I'm using standard pgbench program, with scale 35 (-s 35, which means that the generated database, without any tests done, is ~ 550MB).
I could have used larger database, but since pgbench writes all-over the database, I want to make sure the writes to tables happen only due to checkpoints, and not because some shared_buffer has to be freed to make place for another.
Since my HDD sustains ~ 50MB/s of writes, I can assume that the checkpoint with checkpoint_completion_target = 0 should take ~ 11 seconds.
Used configuration:
- shared_buffers = 1024MB – I need large shared buffers to be able to observe checkpoint times
- log_checkpoints = on – well, I need to know when checkpoints happen
- checkpoint_segments = 30 – just a number of how many WAL segment can be filled before checkpoint will be forced
- checkpoint_timeout = 5min – how often to checkpoint data
- checkpoint_warning = 5min – if checkpoint happens more often than this (which is the same as timeout) – warn about it in logs. This is to see situation when we have too few checkpoint_segments
- log_line_prefix = ‘%m %r %u %d %p ‘ – to have pg query logs nicely prefixed with important information
- log_min_duration_statement = 5 – I don't want to log all queries – as there will be many of them. I just want to log these over 5ms – so I will see if there will be spikes of number of such queries on checkpoints
I did 5 tests, with checkpoint_completion_target being: 0, 0.3, 0.6, 0.9 and 1.
This is IO utilization of PGDATA partition with checkpoint_completion_target = 0:
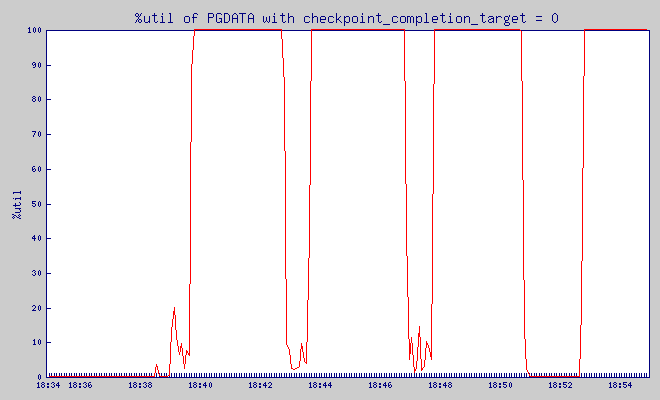
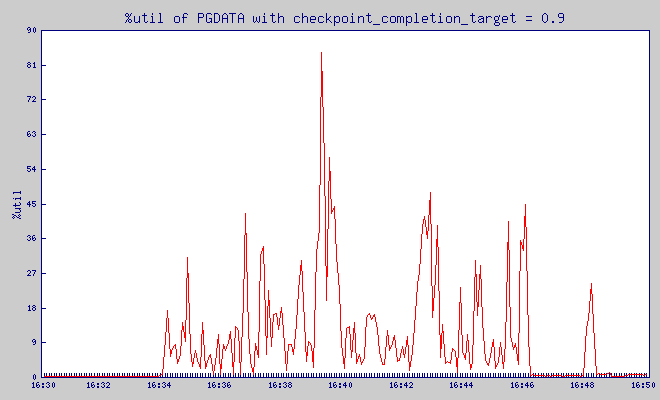
What is %util? From man iostat:
Percentage of CPU time during which I/O requests were issued to the device (bandwidth utilization for the device). Device saturation occurs when this value is close to 100%.
And, based on the graph above, I immediately saw that my test dataset is too large, as the checkpoint took most of the time.
So, I re-did the test, with even smaller dataset – scale 15, size of database – ~ 300MB).
Results
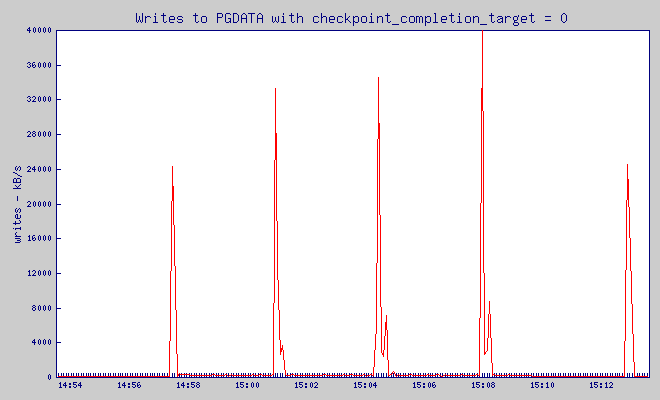
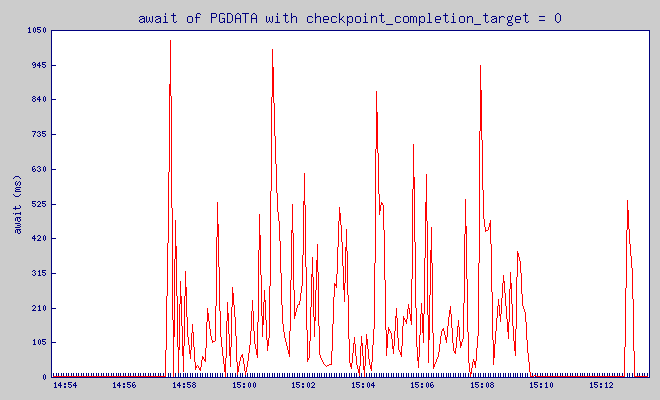
checkpoint_completion_target = 0
Pgbench was putting load on the database between 14:57:34 and 15:09:34. Before it, for 5 minutes – server was not doing anything.
This is IO utilization of PGDATA partition:
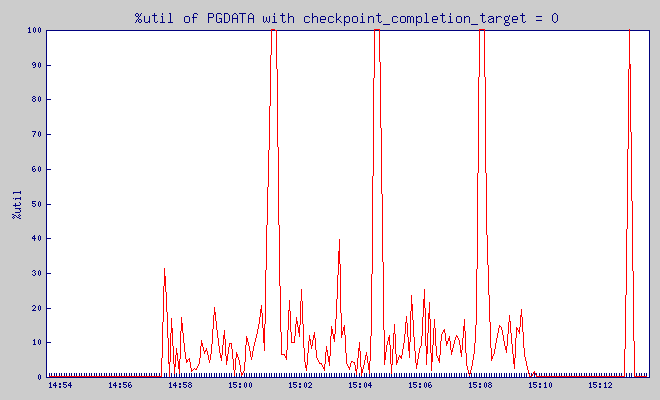
What is %util? From man iostat:
Percentage of CPU time during which I/O requests were issued to the device (bandwidth utilization for the device). Device saturation occurs when this value is close to 100%.
Write throughput:
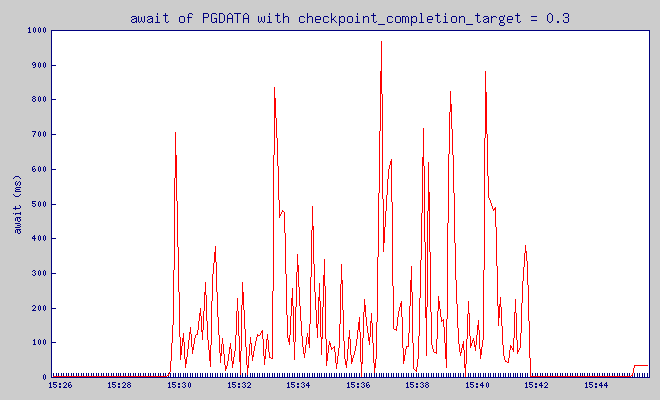
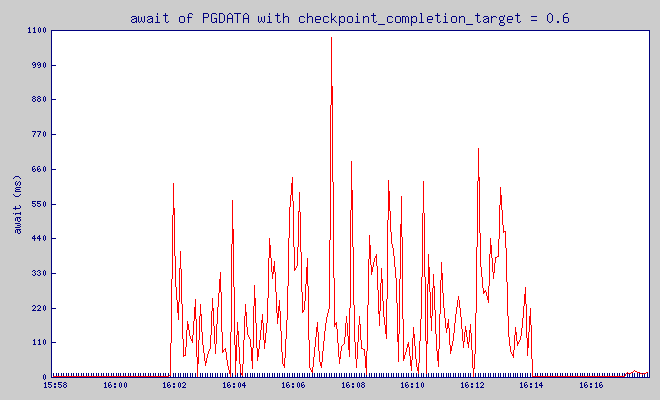
and finally, very important value – await:
The average time (in milliseconds) for I/O requests issued to the device to be served. This includes the time spent by the requests in queue and the time spent servicing them.
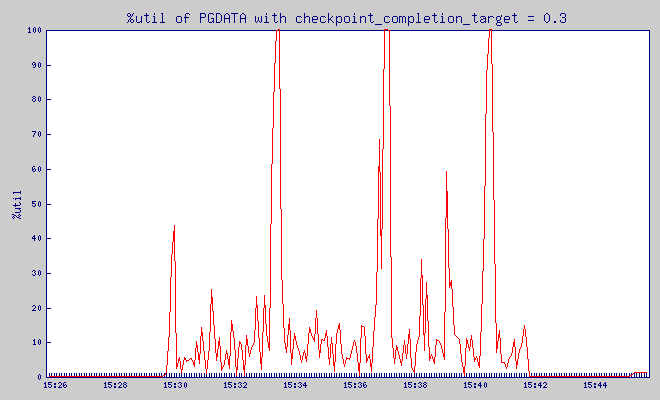
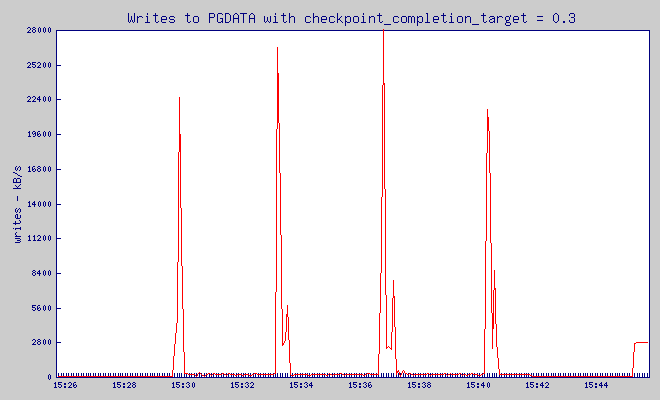
checkpoint_completion_target = 0.3
Pgbench was putting load on the database between 15:29:44 and 15:41:44. Before it, for 5 minutes – server was not doing anything.
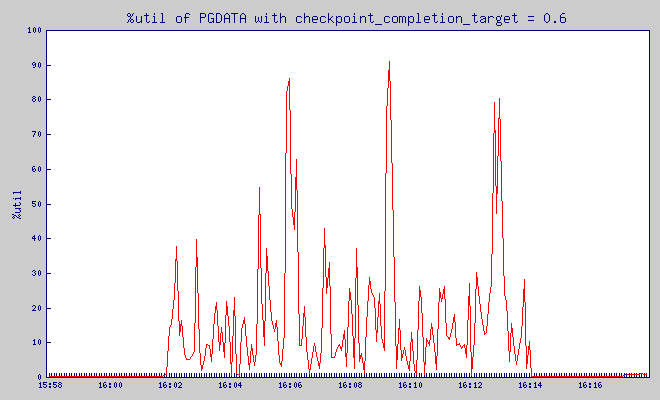
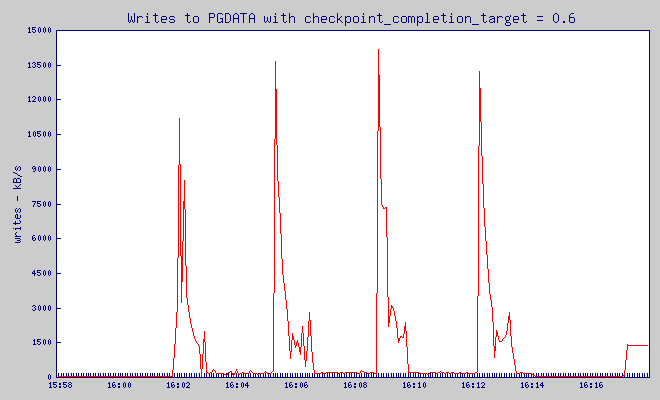
checkpoint_completion_target = 0.6
Pgbench was putting load on the database between 16:01:55 and 16:13:55. Before it, for 5 minutes – server was not doing anything.
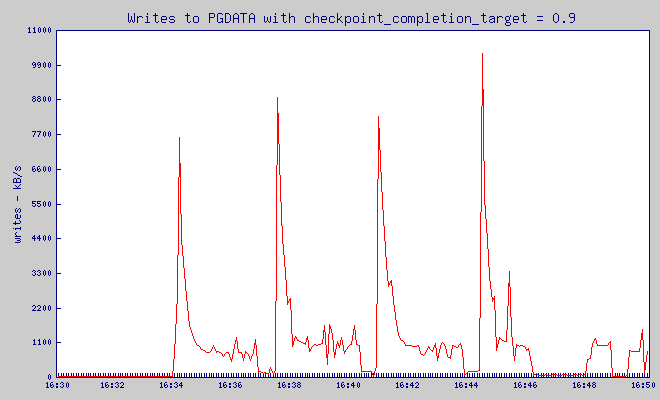
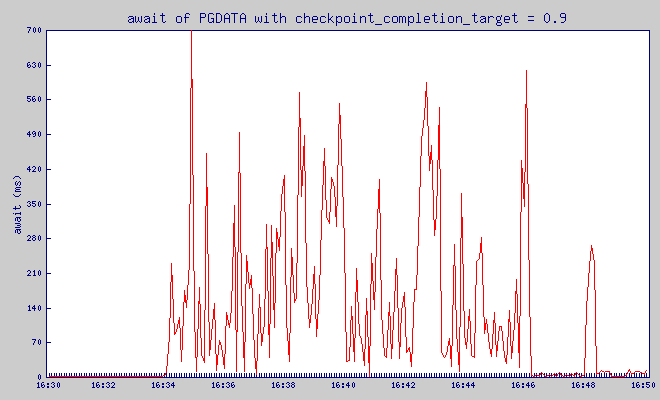
checkpoint_completion_target = 0.9
Pgbench was putting load on the database between 16:34:08 and 16:46:08. Before it, for 5 minutes – server was not doing anything.
checkpoint_completion_target = 1
Pgbench was putting load on the database between 17:06:21 and 17:18:22. Before it, for 5 minutes – server was not doing anything.
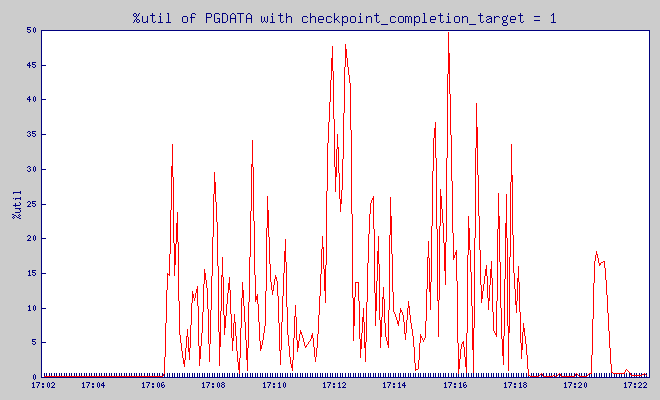
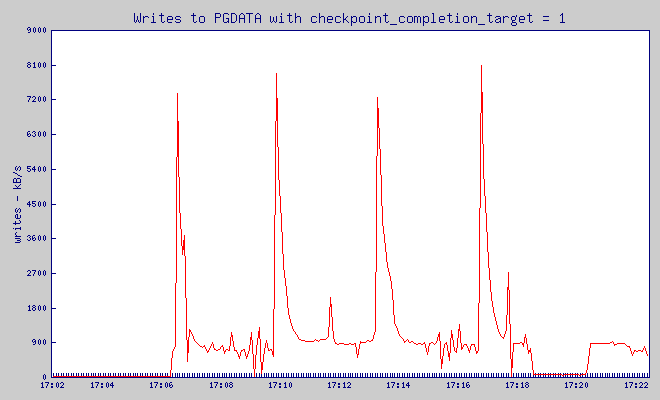
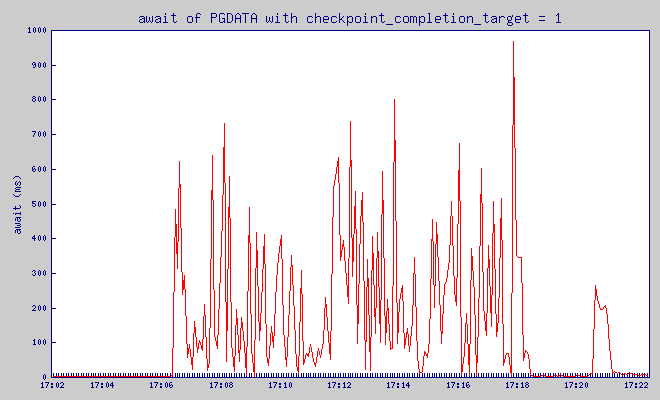
These are graph are pretty jagged, but I hope you can see that while checkpoint_completion_target wrote in one big spike that used 40MB of write traffic, with all the other values of checkpoint_completion_target write spike was much lower.
And how is it relating to number of slow queries? As you perhaps remember – I log every query that took over 5ms. Based on the query log, I can see how often we had slow queries.
| cct | number of queries running more than | ||||
|---|---|---|---|---|---|
| 100ms | 200ms | 300ms | 400ms | 500ms | |
| 0 | 122 | 52 | 51 | 44 | 37 |
| 0.3 | 92 | 41 | 37 | 36 | 31 |
| 0.6 | 122 | 34 | 29 | 28 | 23 |
| 0.9 | 164 | 30 | 18 | 17 | 16 |
| 1 | 173 | 23 | 13 | 13 | 12 |
As you can see increasing checkpoint_completion_target gives visible decrease in number of queries that took over 200ms. Range (100,200)ms is different, but we can see that the longer, and more disrupting queries, are much less likely to happen with larger checkpoint_completion_target.
So, is there any drawback to increasing it?
Well, for starters – it can bloat your pg_xlog directory, according to the formula that I brought at the beginning of the post.
And second – it will not always work – if your shared_buffers are too large, and you write to them too much – pg will have to checkpoint virtually all the time – just like what happened in the first graph that I showed, thus any “slowdown" will simply not work.
Finally – remember that the longer the time from last checkpoint, in case of forced shutdown (think: power outage) – the longer will take recovery. And since larger checkpoint_completion_target means slower checkpoints – it also makes you (on average) further away from last checkpoint – thus making eventual recovery longer.
Aside from this facts – I can't really think of any reason not to make it to 0.9 (I wouldn't go with 1.0, to avoid situation when next checkpoint is postponed, due to previous one not being done yet) as a basic change in tuning PostgreSQL.
checkpoint_completion_target (floating point)
Specifies the target of checkpoint completion, as a fraction of total time between checkpoints. The default is 0.5. This parameter can only be set in the postgresql.conf file or on the server command line.
注:本篇原文的评论中,GREG SMITH提到:
checkpoint_completion_target sets when the write phase of the checkpoint tries to finish. After that, it then executes a sync phase that also takes some time, and the checkpoint isn’t actually over until that is finished, too. On a busy server, the sync phase can take longer than the write one. That’s why the default is 0.5; it leaves some extra time for a slow sync to process, while still not running behind the expected schedule. You can set it to 0.9, and I do that sometimes, but if your sync phase times get too long you can run into trouble with that.
根据字面意思理解,在执行checkpoint时是分为write和sync两步的,而设定的checkpoint_completion_target参数指的是write部分的时间,剩下的时间用于sync操作,而且在IO繁忙的系统中,sync的耗时还要大于write的,sync完成才表示着checkpoint操作的完成。关于这部分明天再扒一下源码看下。
参考:
http://www.depesz.com/2010/11/03/checkpoint_completion_target/
http://www.postgresql.org/docs/current/static/runtime-config-wal.html
understanding checkpoint_completion_target的更多相关文章
- GOOD MEETINGS CREATE SHARED UNDERSTANDING, NOT BRDS!
Deliverables and artifacts were a focal point of BA work during the early part of my career. If I ...
- Understanding delete
简述 我们都知道无法通过delete关键字针对变量和函数进行操作,而对于显示的对象属性声明却可以进行,这个原因需要深究到js的实现层上去,让我们跟随 Understanding delete 来探究一 ...
- Life Cycle of Thread – Understanding Thread States in Java
Life Cycle of Thread – Understanding Thread States in Java 深入理解java线程生命周期. Understanding Life Cycle ...
- [转]Part 3: Understanding !PTE - Non-PAE and X64
http://blogs.msdn.com/b/ntdebugging/archive/2010/06/22/part-3-understanding-pte-non-pae-and-x64.aspx ...
- Understanding the Internal Message Buffers of Storm
Understanding the Internal Message Buffers of Storm Jun 21st, 2013 Table of Contents Internal messag ...
- Understanding theory (1)
Source: verysmartbrothas.com It has been confusing since my first day as a PhD student about theory ...
- Understanding Convolutions
http://colah.github.io/posts/2014-07-Understanding-Convolutions/ Posted on July 13, 2014 neural netw ...
- Understanding, Operating and Monitoring Apache Kafka
Apache Kafka is an attractive service because it's conceptually simple and powerful. It's easy to un ...
- [翻译]Understanding Weak References(理解弱引用)
原文 Understanding Weak References Posted by enicholas on May 4, 2006 at 5:06 PM PDT 译文 我面试的这几个人怎么这么渣啊 ...
随机推荐
- 使用开源工具MonoDevelop开发GTK#图形界面
转自:http://developer.51cto.com/art/201011/235040.htm Mono一直到现在的2.8已经完全可以胜任一些比较小的项目了,但相关的开发文档与教程一直比较匮乏 ...
- BZOJ 3260 跳
YY一下发现答案基本上就是(n+1)+ΣC(n+i,i),其中i=1...m. 然后发现后面每一项可以递推,只要处理1..m的逆元就好了. 这题很容易爆long long,每一步都要取模. #incl ...
- HDOJ-三部曲一(搜索、数学)-1008-Prime Path
Prime Path Time Limit : 2000/1000ms (Java/Other) Memory Limit : 131072/65536K (Java/Other) Total S ...
- PHP版本区别
- Android之Activity与Service通信
一.当Acitivity和Service处于同一个Application和进程时,通过继承Binder类来实现. 当一个Activity绑定到一个Service上时,它负责维护Service实例的引用 ...
- 要学JavaScript!进来看吧,反正不花钱!~
有一段时间没有更新自己的博客了,今天终于可以抽出时间和大家分享一下关于JavaScript了.有很多朋友在问我没有接触过会不会很难,不好理解 其实JavaScript的基本语法和Java的基本语法很相 ...
- Java 集合深入理解(10):Deque 双端队列
点击查看 Java 集合框架深入理解 系列, - ( ゜- ゜)つロ 乾杯~ 什么是 Deque Deque 是 Double ended queue (双端队列) 的缩写,读音和 deck 一样,蛋 ...
- PHP 防范xss攻击
XSS 全称为 Cross Site Scripting,用户在表单中有意或无意输入一些恶意字符,从而破坏页面的表现! 看看常见的恶意字符XSS 输入: 1.XSS 输入通常包含 JavaScript ...
- 微信公众号 SDK
<?php /* 方倍工作室 http://www.fangbei.org/ CopyRight 2015 All Rights Reserved */ define("TOKEN&q ...
- ML2 – Address Population
Why do we need it, whatever it is? VM unicast, multicast and broadcast traffic flow is detailed in m ...