
关于hist
"""

Demo of the histogram (hist) function with a few features.

In addition to the basic histogram, this demo shows a few optional features:

    * Setting the number of data bins

    * The ``normed`` flag, which normalizes bin heights so that the integral of

      the histogram is 1. The resulting histogram is a probability density.

    * Setting the face color of the bars

    * Setting the opacity (alpha value).

x : (n,) array or sequence of (n,) arrays

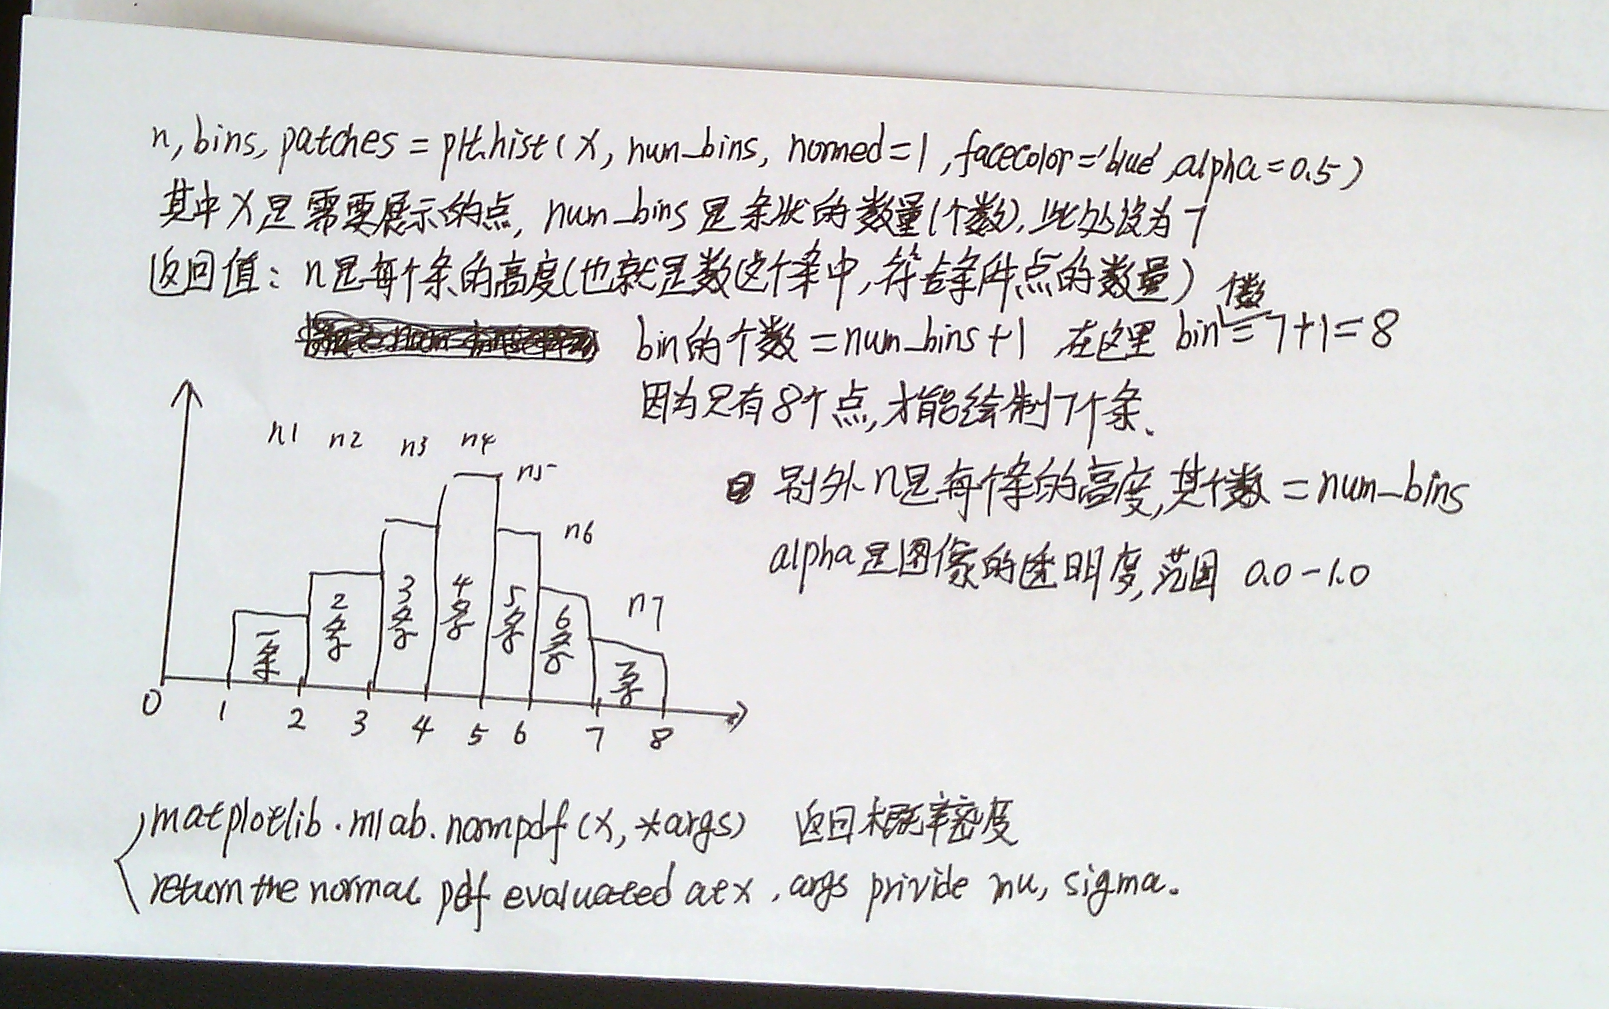
这个参数是指定每个bin(箱子)分布的数据,对应x轴

bins : integer or array_like, optional

这个参数指定bin(箱子)的个数,也就是总共有几条条状图

normed : boolean, optional

If True, the first element of the return tuple will be the counts normalized to form a probability density, i.e.,n/(len(x)`dbin)

这个参数指定密度,也就是每个条状图的占比例比,默认为1

color : color or array_like of colors or None, optional

这个指定条状图的颜色

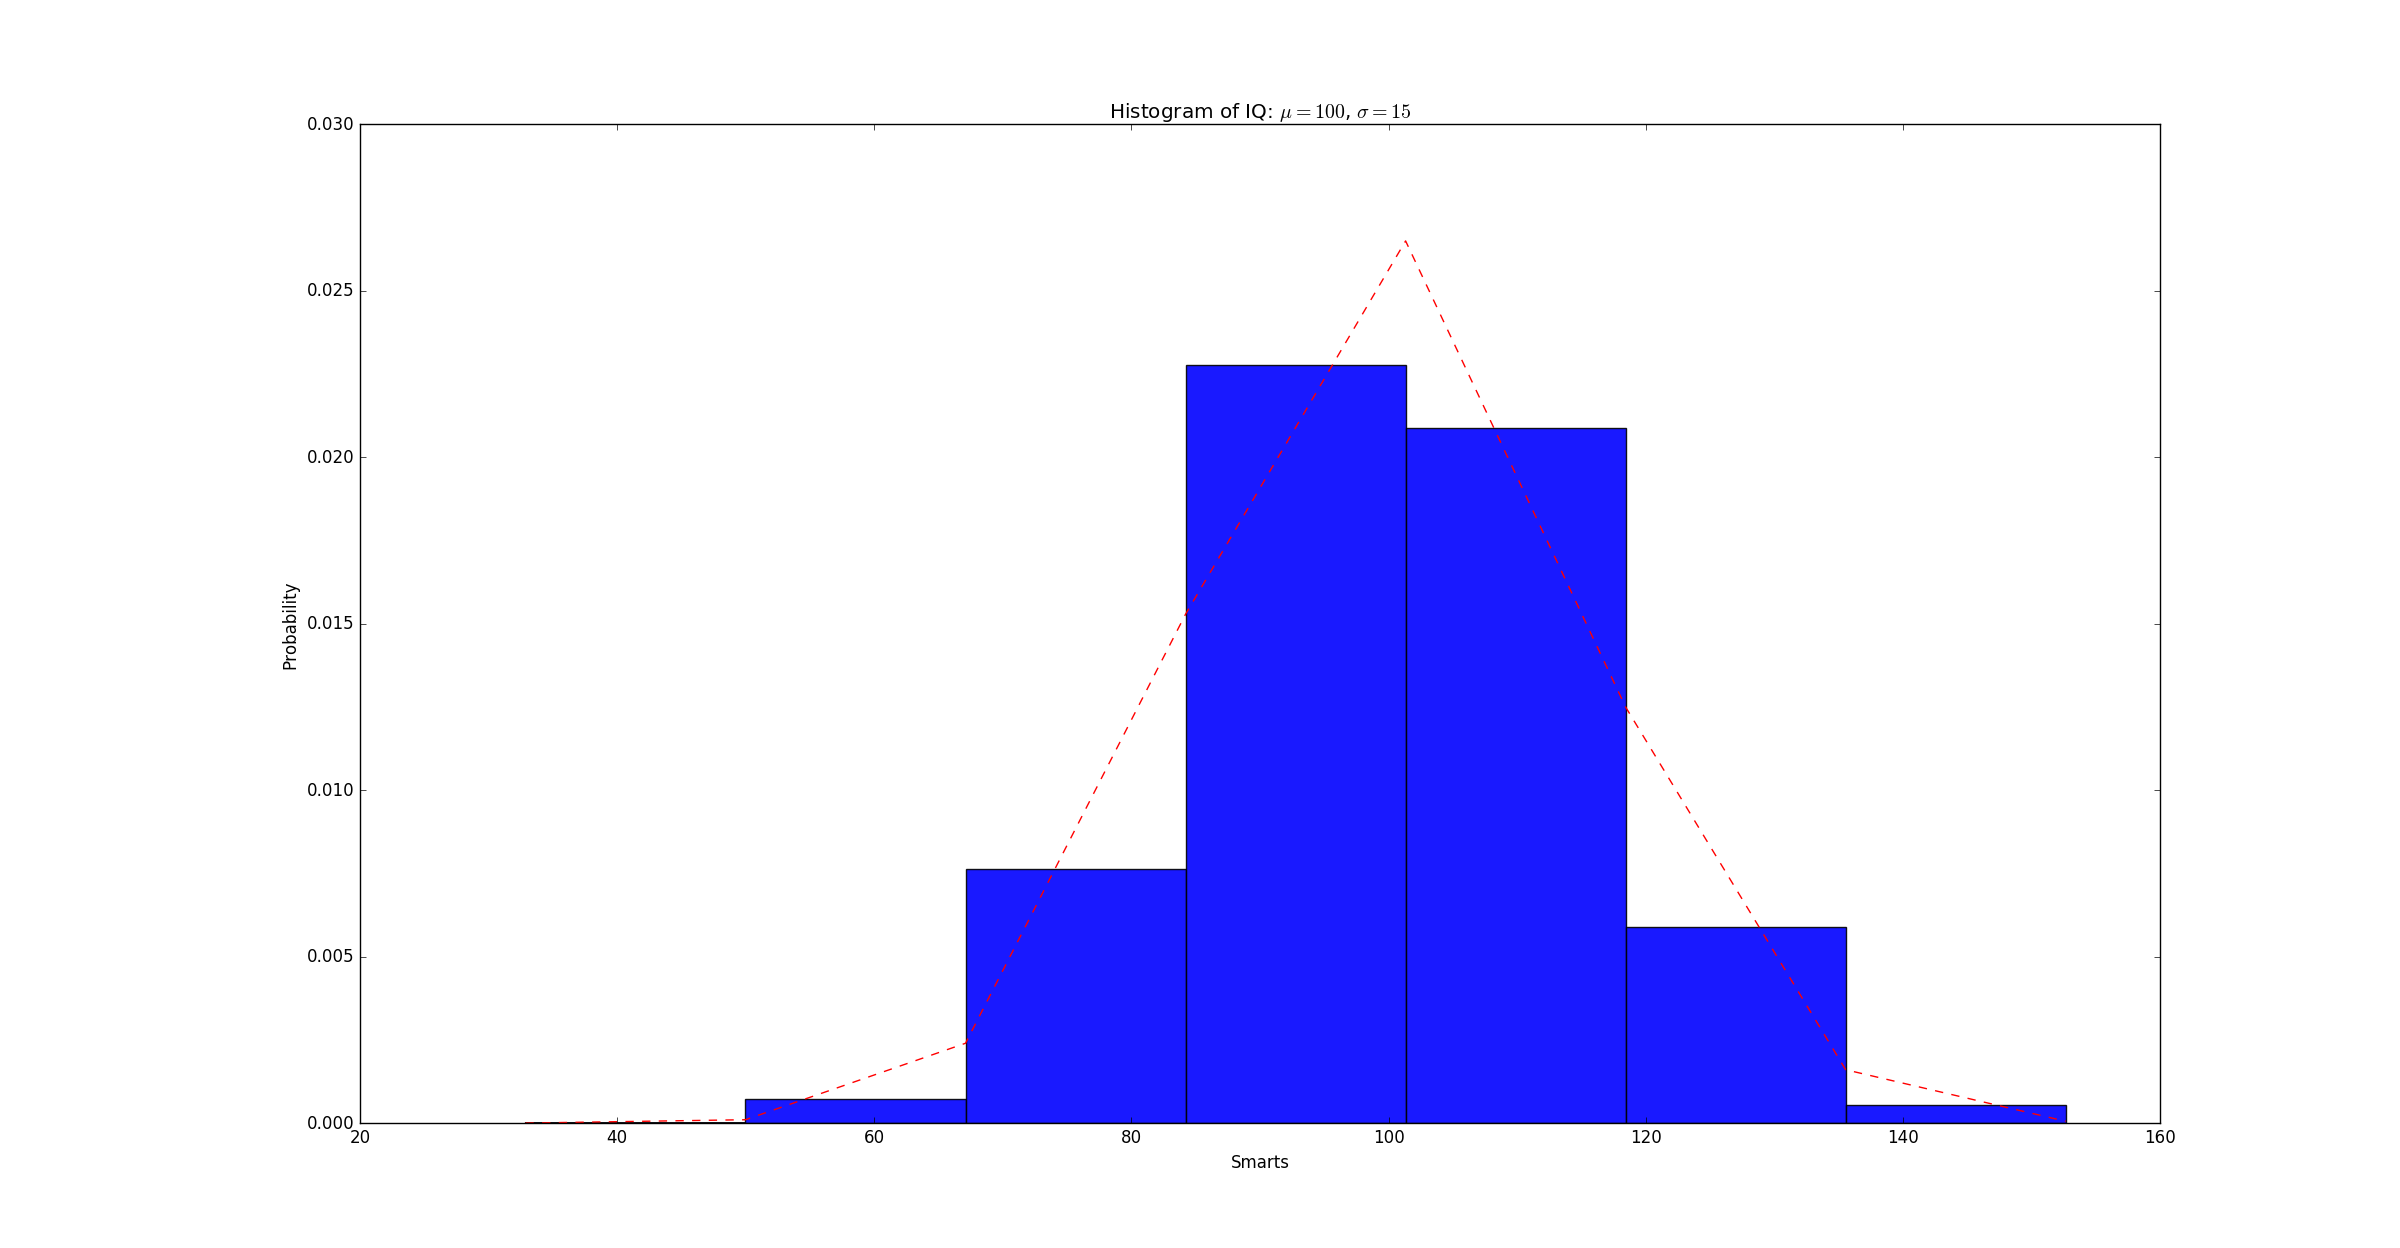
我们绘制一个10000个数据的分布条状图,共50份,以统计10000分的分布情况

"""

import numpy as np

import matplotlib.mlab as mlab

import matplotlib.pyplot as plt

# example data

mu = 100 # mean of distribution

sigma = 15 # standard deviation of distribution

x = mu + sigma * np.random.randn(10000)

num_bins = 7

# the histogram of the data

n, bins, patches = plt.hist(x, num_bins, normed=1, facecolor='blue', alpha=0.9)

# add a 'best fit' line

y = mlab.normpdf(bins, mu, sigma)

plt.plot(bins, y, 'r--')

plt.xlabel('Smarts')

plt.ylabel('Probability')

plt.title(r'Histogram of IQ: $\mu=100$, $\sigma=15$')

# Tweak spacing to prevent clipping of ylabel

plt.subplots_adjust(left=0.15)

plt.show()

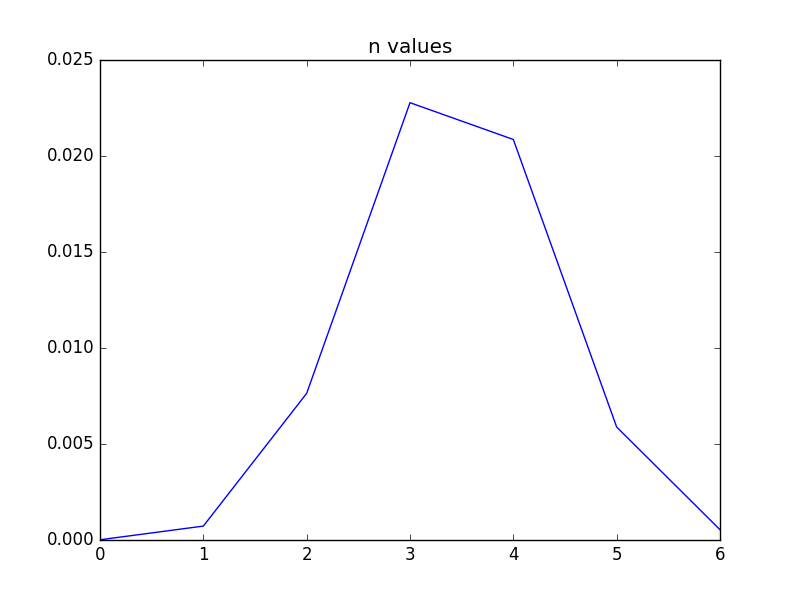
plt.plot(n)

plt.title('n values')

plt.show()

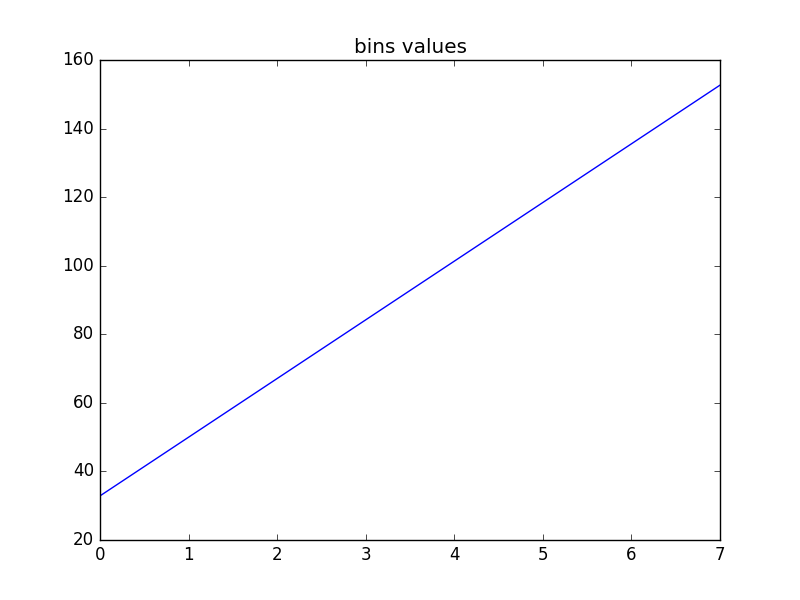
plt.plot(bins)

plt.title('bins values')

plt.show()
关于hist的更多相关文章
- 频率直方图(hist)
频率直方图(frequency histogram)亦称频率分布直方图.统计学中表示频率分布的图形.在直角坐标系中,用横轴表示随机变量的取值,横轴上的每个小区间对应一个组的组距,作为小矩形的底边:纵轴 ...
- MATLAB实现频数直方图——hist的使用
"hist" is short for "Histogram(直方图.柱状图)". 1.N = hist(Y) bins the elements of Y ...
- hist和bar画图关系
1.hist是绘制直方图,直方图显示了数据值的分布情况. 1>n = hist(Y,n) 将向量Y中的元素分到n个等间隔的范围内(默认为10个间隔),并返回每个范围内元素的个数作为一 ...
- matplotlib.pyplot.hist
**n, bins, patches = plt.hist(datasets, bins, normed=False, facecolor=None, alpha=None)** ## 函数说明 用于 ...
- MATLAB绘图hist
刚登上号,已经学了一半了,就从现在开始写吧 以前学过的东西老忘,所以就注册个账号就当做记笔记吧 MATLAB在原来的数组中增加新行 A=[A;B]%B是要增加的行: hist使用方法 y=4*rand ...
- 4.6Python数据处理篇之Matplotlib系列(六)---plt.hist()与plt.hist2d()直方图
目录 目录 前言 (一)直方图 (二)双直方图 目录 前言 今天我们学习的是直方图,导入的函数是: plt.hist(x=x, bins=10) 与plt.hist2D(x=x, y=y) (一)直方 ...
- 【R作图】lattice包,画多个分布柱形图,hist图纵轴转换为百分比
一开始用lattice包,感觉在多元数据的可视化方面,确实做得非常好.各种函数,可以实现任何想要实现的展示. barchart(y ~ x) y对x的直方图 bwplot(y ~ x) 盒形图 den ...
- [Bayes] Point --> Hist: Estimate "π" by R
Verify the Monte Carlo sampling variability of "π". p = π/4 与 所得 0.7854 比较接近,故满足 Central L ...
- [Bayes] Hist & line: Reject Sampling and Importance Sampling
吻合度蛮高,但不光滑. > L= > K=/ > x=runif(L) > *x*(-x)^/K)) > hist(x[ind],probability=T, + xla ...
- 机器学习入门-数值特征-连续数据离散化(进行分段标记处理) 1.hist(Dataframe格式直接画直方图)
函数说明: 1. .hist 对于Dataframe格式的数据,我们可以使用.hist直接画出直方图 对于一些像年龄和工资一样的连续数据,我们可以对其进行分段标记处理,使得这些连续的数据变成离散化 就 ...
随机推荐
- jauery table
$("#tableData tr:gt(0)").each(function() { }//橘色部分是查找id为tableData的DataTable里面除第一行以外的行
- easyui的 一些经验
1. 渲染网络表格时,行操作 <th field="sort_num" width="10" data-options="field:'id', ...
- MyBaits面试题
原文地址 Mybatis技术内幕系列博客,从原理和源码角度,介绍了其内部实现细节,无论是写的好与不好,我确实是用心写了,由于并不是介绍如何使用Mybatis的文章,所以,一些参数使用细节略掉了,我们的 ...
- C#练习DataReader
SQL代码: create database ThreeDb go USE ThreeDb; GO CREATE TABLE classify --分类表 ( id ,), name ) not nu ...
- 读paper:Deep Convolutional Neural Network using Triplets of Faces, Deep Ensemble, andScore-level Fusion for Face Recognition
今天给大家带来一篇来自CVPR 2017关于人脸识别的文章. 文章题目:Deep Convolutional Neural Network using Triplets of Faces, Deep ...
- Java基础教程:多线程基础(1)——基础操作
Java:多线程基础(1) 实现多线程的两种方式 1.继承Thread类 public class myThread extends Thread { /** * 继承Thread类,重写RUN方法. ...
- 3.25课·········JavaScript的DOM操作
1.DOM的基本概念 DOM是文档对象模型,这种模型为树模型:文档是指标签文档:对象是指文档中每个元素:模型是指抽象化的东西. 2.Window对象操作 一.属性和方法: 属性(值或者子对象): op ...
- Data Structure Binary Tree: Lowest Common Ancestor in a Binary Tree
http://www.geeksforgeeks.org/lowest-common-ancestor-binary-tree-set-1/ #include <iostream> #in ...
- POJ3614 贪心+优先队列
题意:m头牛每头牛有minspf和maxspf,n种spf为spf[i]的防晒霜每种l[i]瓶,尽可能给数量多的牛涂防晒霜,每头牛最多涂一瓶. 思路:贪心想法,实现是每次取出minspf<=sp ...
- 使用ksar解析sar监控日志
sar 是属于sysstat包中的一个工具 安装sysstat包后,默认创建一个/etc/cron.d/sysstat文件,其默认内容为: # run system activity accounti ...