Real-time chart using ASP.NET Core and WebSocket
Solution in glance
The following diagram illustrates our solution where IoT device reports readings to web site and users can see readings in real time.
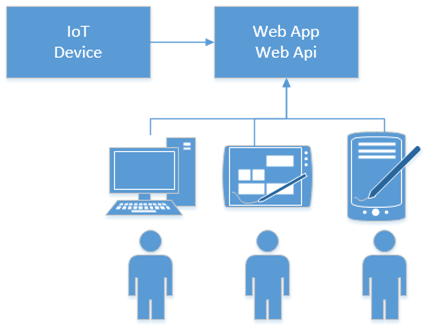
There is IoT device that reports sensors readings to ASP.NET Core application. Users open the site in their browsers and they will see readings in real-time. Readings are shown as table and visualized as a line chart.
NB! Those who are interested in playing with Visual Studio 2017 solution and source code can find it from AspNetCoreRealTimeChart Github repository.
Adding WebSocket support
First we go and visit Radu Matei’s blog and take some code from there. Of course, we give him cookie and credits for his excellent writing Creating a WebSockets middleware for ASP .NET Core. We use a little modified version of his WebSocketManager class.
public class TemperatureSocketManager
{
    private static ConcurrentDictionary<string, WebSocket> _sockets = new ConcurrentDictionary<string, WebSocket>();

    public WebSocket GetSocketById(string id)
    {
        return _sockets.FirstOrDefault(p => p.Key == id).Value;
    }

    public ConcurrentDictionary<string, WebSocket> GetAll()
    {
        return _sockets;
    }

    public string GetId(WebSocket socket)
    {
        return _sockets.FirstOrDefault(p => p.Value == socket).Key;
    }
    public string AddSocket(WebSocket socket)
    {
        var id = CreateConnectionId();
        _sockets.TryAdd(CreateConnectionId(), socket);

        return id;
    }

    public async Task RemoveSocket(string id)
    {
        WebSocket socket;
        _sockets.TryRemove(id, out socket);

        await socket.CloseAsync(closeStatus: WebSocketCloseStatus.NormalClosure,
                                statusDescription: "Closed by the WebSocketManager",
                                cancellationToken: CancellationToken.None);
    }

    private string CreateConnectionId()
    {
        return Guid.NewGuid().ToString();
    }

    public async Task SendMessageToAllAsync(string message)
    {
        foreach (var pair in _sockets)
        {
            if (pair.Value.State == WebSocketState.Open)
                await SendMessageAsync(pair.Value, message);
        }
    }

    private async Task SendMessageAsync(WebSocket socket, string message)
    {
        if (socket.State != WebSocketState.Open)
            return;

        await socket.SendAsync(buffer: new ArraySegment<byte>(array: Encoding.ASCII.GetBytes(message),
                                                                offset: 0,
                                                                count: message.Length),
                                messageType: WebSocketMessageType.Text,
                                endOfMessage: true,
                                cancellationToken: CancellationToken.None);
    }
}
We also need WebSocket middleware to keep internal sockets dictionary fresh. Here we will use a little modified version of Radu Matei’s WebSocket middleware.
public class TemperatureSocketMiddleware
{
    private readonly RequestDelegate _next;
    private readonly TemperatureSocketManager _socketManager;

    public TemperatureSocketMiddleware(RequestDelegate next,
                                        TemperatureSocketManager socketManager)
    {
        _next = next;
        _socketManager = socketManager;
    }

    public async Task Invoke(HttpContext context)
    {
        if (!context.WebSockets.IsWebSocketRequest)
        {
            await _next.Invoke(context);
            return;
        }

        var socket = await context.WebSockets.AcceptWebSocketAsync();
        var id = _socketManager.AddSocket(socket);

        await Receive(socket, async (result, buffer) =>
        {
            if (result.MessageType == WebSocketMessageType.Close)
            {
                await _socketManager.RemoveSocket(id);
                return;
            }
        });
    }

    private async Task Receive(WebSocket socket, Action<WebSocketReceiveResult, byte[]> handleMessage)
    {
        var buffer = new byte[1024 * 4];

        while (socket.State == WebSocketState.Open)
        {
            var result = await socket.ReceiveAsync(buffer: new ArraySegment<byte>(buffer),
                                                    cancellationToken: CancellationToken.None);

            handleMessage(result, buffer);
        }
    }
}
Now let’s add reference to Microsoft.AspNetCore.WebSockets NuGet package and wire WebSocket stuff to application. We use Configure() method of Startup class for this.
app.UseStaticFiles();
app.UseWebSockets();
app.UseMiddleware<TemperatureSocketMiddleware>();

app.UseMvc(routes =>
{
    routes.MapRoute(
        name: "default",
        template: "{controller=Home}/{action=Index}/{id?}");
});
We have to register also WebSocket manager as a service to be able to broadcast data to browsers. Here is the ConfigureServices() method of application Startup class.
public void ConfigureServices(IServiceCollection services)
{
    services.AddMvc();
    services.AddSingleton<TemperatureSocketManager>();
}
Now we have everything we need to support WebSockets in out application.
Web API for IoT device
We need some web end-point where IoT device can send sensor readings.
public class ApiController : Controller
{
    private readonly TemperatureSocketManager _socketManager;

    public ApiController(TemperatureSocketManager socketManager)
    {
        _socketManager = socketManager;
    }

    public async Task Report(double liquidTemp)
    {
        var reading = new
        {
            Date = DateTime.Now,
            LiquidTemp = liquidTemp
        };

        await _socketManager.SendMessageToAllAsync(JsonConvert.SerializeObject(reading));
    }

    public async Task Generate()
    {
        var rnd = new Random();

        for(var i = 0; i < 100; i++)
        {
            await Report(rnd.Next(23, 35));
            await Task.Delay(5000);
        }
    }
}
Report() method accepts one sensor reading per time and broadcasts it to all registered sockets. Generate() method is there to simulate sensor that reports data. We can use this method if we don’t have any IoT device in our network.
Building user interface
Let’s build user interface for our solution to display real-time data to users. We start with simple home controller that just servers some views with no additional work.
public class HomeController : Controller
{
    public IActionResult Index()
    {
        return View();
    }

    public IActionResult Error()
    {
        return View();
    }
}
Home view of Index controller is also simple. There are references to some D3 chart and Knockout related scripts. We will come back to these later. The view has placeholder for D3 chart. There is also table where sensor readings are displayed.
@{
    ViewData["Title"] = "Home Page";
}
<div class="row">
    <div class="col-lg-8 bigChart" data-bind="lineChart: lineChartData"></div>
    <div class="col-lg-4">
        <table class="table">
            <thead>
                <tr>
                    <th>#</th>
                    <th>Time</th>
                    <th>Temperature</th>
                </tr>
            </thead>
            <tbody data-bind="foreach: lineChartData">
                <tr>
                    <td data-bind="text: $index() + 1"></td>
                    <td data-bind="text: Date.toLocaleTimeString()"></td>
                    <td data-bind="text: LiquidTemp"></td>
                </tr>
            </tbody>
        </table>
    </div>
</div>

@section Scripts {
    <script src="~/js/data-view-model.js"></script>
    <script src="~/js/line-chart-binding.js"></script>

    <script>
        var D3KD = this.D3KD || {};

        (function () {
            "use strict";
            var dataViewModel = new D3KD.dataViewModel();

            var protocol = location.protocol === "https:" ? "wss:" : "ws:";
            var wsUri = protocol + "//" + window.location.host;
            var socket = new WebSocket(wsUri);

            socket.onmessage = function (e) {
                var reading = JSON.parse(e.data);
                reading.Date = new Date(reading.Date);

                dataViewModel.addDataPoint(reading);
            };

            ko.applyBindings(dataViewModel);
        }());
    </script>
}
When page is loaded then WebSocket connection is established and script starts listening to WebSocket. When data comes in the script sets Date property to JavaScript date and adds reading to Knockout array of data model.
Before wiring everything together let’s also modify layout view. I removed environment based mess from layout view and made popular scripts to be downloaded from CDN-s.
<!DOCTYPE html>
<html>
<head>
<meta charset="utf-8" />
<meta name="viewport" content="width=device-width, initial-scale=1.0" />
<title>@ViewData["Title"] - AspNetCoreRealTimeChart</title> <link rel="stylesheet" href="https://ajax.aspnetcdn.com/ajax/bootstrap/3.3.7/css/bootstrap.min.css" />
<link rel="stylesheet" href="~/css/site.css" asp-append-version="true" />
</head>
<body>
<nav class="navbar navbar-inverse navbar-fixed-top">
<div class="container">
<div class="navbar-header">
<button type="button" class="navbar-toggle" data-toggle="collapse" data-target=".navbar-collapse">
<span class="sr-only">Toggle navigation</span>
<span class="icon-bar"></span>
<span class="icon-bar"></span>
<span class="icon-bar"></span>
</button>
<a asp-area="" asp-controller="Home" asp-action="Index" class="navbar-brand">AspNetCoreRealTimeChart</a>
</div>
<div class="navbar-collapse collapse">
<ul class="nav navbar-nav">
<li><a asp-area="" asp-controller="Home" asp-action="Index">Home</a></li>
</ul>
</div>
</div>
</nav>
<div class="container body-content">
@RenderBody()
<hr />
<footer>
<p>© 2017 - AspNetCoreRealTimeChart</p>
</footer>
</div> <script src="https://ajax.aspnetcdn.com/ajax/jquery/jquery-2.2.0.min.js"></script>
<script src="https://ajax.aspnetcdn.com/ajax/bootstrap/3.3.7/bootstrap.min.js"></script>
<script src="http://d3js.org/d3.v3.min.js"></script>
<script src="http://knockoutjs.com/downloads/knockout-3.0.0.js"></script>
@RenderSection("Scripts", required: false)
</body>
</html>
With visible part of user interface we are done now and it’s time to stitch all parts together.
Displaying real-time data
As we are using D3 chart and Knockout to display real-time data we need some classes to bind these two together. I found d3-knockout-demo by Teodor Elstad where this problem is solved. It’s simple demo you can download to your machine and run it directly from directory. It doesn’t need any external data services to work. We start with data model class that is simplified to minimum.The code below goes to data-view-model.js file (see Index view of home controller).
/*global ko, setInterval*/

var D3KD = this.D3KD || {};

(function (namespace) {
    "use strict";
    namespace.dataViewModel = function () {
        var self = this;

        self.lineChartData = ko.observableArray();
        self.addDataPoint = function (point) {
            if (self.lineChartData().length >= 10) {
                self.lineChartData.shift();
            }

            self.lineChartData.push(point);
        };
    };
}(D3KD));
The data model class holds Knockout observable array with readings. It also has addDataPoint() method that adds new reading to array. It aslo avoids array to grow over 10 elements. If array already has 10 readings then first reading is removed before new one is added.
To keep chart up to date we need Knockout bindingHandler. This comes also from Teodor’s demo project and it goes to line-chart-binding.js file (see Index view of home controller).
/*global ko, d3*/

ko.bindingHandlers.lineChart = {
    init: function (element) {
        "use strict";

        var margin = { top: 20, right: 20, bottom: 30, left: 50 },
            elementWidth = parseInt(d3.select(element).style("width"), 10),
            elementHeight = parseInt(d3.select(element).style("height"), 10),
            width = elementWidth - margin.left - margin.right,
            height = elementHeight - margin.top - margin.bottom,

            svg = d3.select(element).append("svg")
                .attr("width", width + margin.left + margin.right)
                .attr("height", height + margin.top + margin.bottom)
                .append("g")
                .attr("transform", "translate(" + margin.left + "," + margin.top + ")");

        svg.append("g")
            .attr("class", "x axis")
            .attr("transform", "translate(0," + height + ")");

        svg.append("g")
            .attr("class", "y axis")
            .append("text")
            .attr("transform", "rotate(-90)")
            .attr("y", 6)
            .attr("dy", ".71em")
            .style("text-anchor", "end")
            .text("Temperature");

        svg.append("path")
            .attr("class", "line data");

    },
    update: function (element, valueAccessor) {
        "use strict";

        var margin = { top: 20, right: 20, bottom: 30, left: 50 },
            elementWidth = parseInt(d3.select(element).style("width"), 10),
            elementHeight = parseInt(d3.select(element).style("height"), 10),
            width = elementWidth - margin.left - margin.right,
            height = elementHeight - margin.top - margin.bottom,

            // set the time it takes for the animation to take.
            animationDuration = 750,

            x = d3.time.scale()
                .range([0, width]),

            y = d3.scale.linear()
                .range([height, 0]),

            xAxis = d3.svg.axis()
                .scale(x)
                .orient("bottom"),

            yAxis = d3.svg.axis()
                .scale(y)
                .orient("left"),

            // define the graph line
            line = d3.svg.line()
                .x(function (d) { return x(d.Date); })
                .y(function (d) { return y(d.LiquidTemp); }),

            svg = d3.select(element).select("svg g"),

            // parse data from the data-view-model
            data = ko.unwrap(valueAccessor());

        // define the domain of the graph. max and min of the dimensions
        x.domain(d3.extent(data, function (d) { return d.Date; }));
        y.domain([0, d3.max(data, function (d) { return d.LiquidTemp; })]);

        svg.select("g.x.axis")
            .transition()
            .duration(animationDuration)
            .call(xAxis);

        svg.select("g.y.axis")
            .transition()
            .duration(animationDuration)
            .call(yAxis);

        // add the line to the canvas
        svg.select("path.line.data")
            .datum(data)
            .transition()
            .duration(animationDuration)
            .attr("d", line);
    }
};
No we have all ends connected and it’s time to see the web applicaton in action.
Real-time sensor data in action
To illustrate the end result better I added here screenshot and video. Video demonstrates how call to /api/Generate broadcasts new reading to all registered sensors after every five seconds.
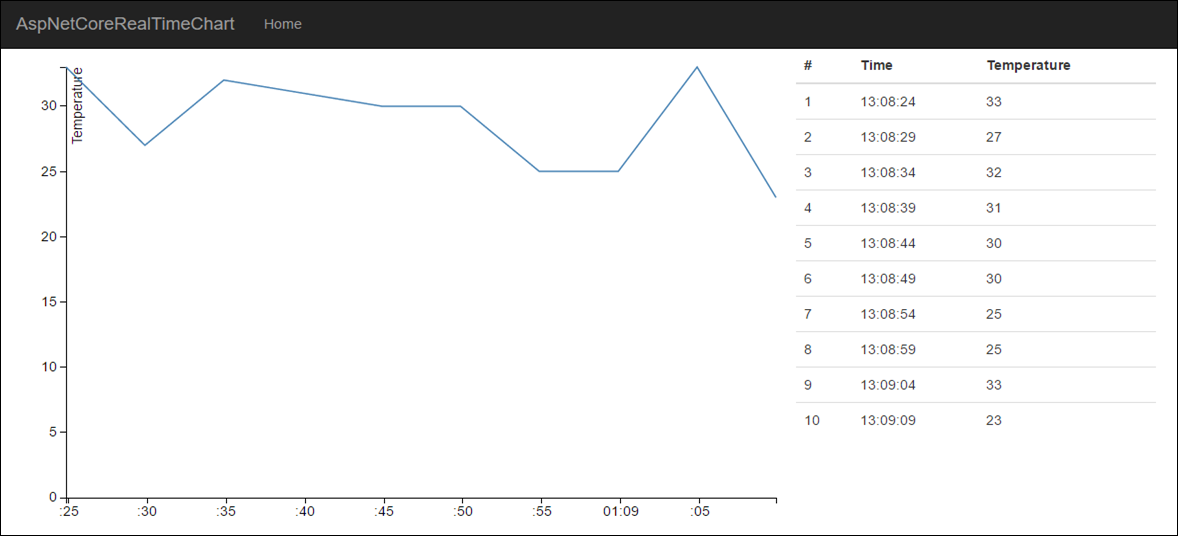
Screenshot of real-time sensor data.
Real-time chart using ASP.NET Core and WebSocket的更多相关文章
- ASP.NET Core 集成 WebSocket
1. 环境 AspNetCore Web 2.0 (MVC) Windows 10 IIS 10 Express/IIS VS 2017 2.如何配置 在已有的或者新创建的 AspNet Core M ...
- 在Asp.net core中使用WebScocket
今天小试了一下在Asp.net core中使用websocket,这里记录一下: 在 Startup 类的 Configure 方法中添加 WebSocket 中间件. app.UseWebSocke ...
- ASP.NET Core 中的 WebSocket 支持(转自MSDN)
本文介绍 ASP.NET Core 中 WebSocket 的入门方法. WebSocket (RFC 6455) 是一个协议,支持通过 TCP 连接建立持久的双向信道. 它用于从快速实时通信中获益的 ...
- 关于ASP.NET Core WebSocket实现集群的思考
前言 提到WebSocket相信大家都听说过,它的初衷是为了解决客户端浏览器与服务端进行双向通信,是在单个TCP连接上进行全双工通讯的协议.在没有WebSocket之前只能通过浏览器到服务端的请求应答 ...
- .NET Core 基于Websocket的在线聊天室
什么是Websocket 我们在传统的客户端程序要实现实时双工通讯第一想到的技术就是socket通讯,但是在web体系是用不了socket通讯技术的,因为http被设计成无状态,每次跟服务器通讯完成后 ...
- ASP.NET Core MVC TagHelper实践HighchartsNET快速图表控件-开源
ASP.NET Core MVC TagHelper最佳实践HighchartsNET快速图表控件支持ASP.NET Core. 曾经在WebForms上写过 HighchartsNET快速图表控件- ...
- Displaying Data in a Chart with ASP.NET Web Pages (Razor)
This article explains how to use a chart to display data in an ASP.NET Web Pages (Razor) website by ...
- [翻译] 使用ElasticSearch,Kibana,ASP.NET Core和Docker可视化数据
原文地址:http://www.dotnetcurry.com/aspnet/1354/elastic-search-kibana-in-docker-dotnet-core-app 想要轻松地通过许 ...
- 如何使用vs将asp.net core项目添加容器支持并发布docker镜像到私有dockerhub和添加k8s/helm管理
这篇文章介绍一下,如何使用VS2017给asp.net core添加容器支持,并发布镜像到私有docker hub,然后用chart管理容器镜像的操作流程. 话不多说,just do it. 新建项目 ...
随机推荐
- Java NIO2:NIO概述
一.概述 从JDK1.4开始,Java提供了一系列改进的输入/输出处理的新特性,被统称为NIO(即New I/O).新增了许多用于处理输入输出的类,这些类都被放在java.nio包及子包下,并且对原j ...
- vi十六进制编辑
指定行:n 光标行之前或之后的n个字符nl 之后 2l 光标位置两个字符后nh 之前 2h 光标位置两个字符前 光标行之上或之下的n个字符nk 之上 1k 光标位置1个字符之上nj 之下 1j 光标位 ...
- Linux系统文件和目录管理
Linux系统文件和目录管理 相关命令的解析 1.pwd:显示用户当前的工作目录 2.ls: -a:显示所有文件,包括隐藏文件 -l:显示文件的详细信息 3.设备文件统一存放在/dev 设备文件 块设 ...
- Docker入门 第一课 --.Net Core 使用Docker全程记录
微服务架构无疑是当前最火热的开发架构,而Docker作为微服务架构的首选工具,是我们必须要了解掌握的. 我通过一天的时间,网上查文档,了解基础概念,安装Docker,试验Docker命令,通过Dock ...
- 数据库(mysql)基本使用命令大全
1.查看数据库及表属性: 1)查看所有数据库 SHOW DATABASES; 2)选择使用的数据库 USE <DATABASE_NAME> 3)查看当前数据库下面的表 SHOW TABLE ...
- Linux 下RPM打包制作流程
原文地址:https://www.cnblogs.com/postgres/p/5726339.html 开始前的准备 安装rpmbuild软件包 yum -y install rpm-build 生 ...
- 三、临时弹出一个QQ对话窗口
第一种:需要添加好友才可以访问 <a href="http://wpa.qq.com/msgrd?v=3&uin=317985559&site=qq&menu= ...
- Is-a
在知识表示.面向对象程序设计与面向对象设计的领域里, is-a(英语:subsumption,包含架构)指的是类的父子继承关系, 例如类D是另一个类B的子类(类B是类D的父类). 换句话说,通常&qu ...
- 【学习总结】 小白CS成长之路
2017-9-3:入坑. 理想:敲着代码唱着歌. 现实:骨感. Step 1: 认识CS: CS大体可以分成以下几个大领域:硬件.系统.软件.网络.计算理论.计算方法. 硬 件 ---- 数字电路.集 ...
- HDU 2459 Maximum repetition substring
题目:Maximum repetition substring 链接:http://acm.hdu.edu.cn/showproblem.php?pid=2459 题意:给你一个字符串,求连续重复出现 ...