Python爬虫 抓肺炎疫情实时数据
数据下载
网上一搜,首先搜到的是腾讯的疫情实时追踪,那就用这个数据源吧。
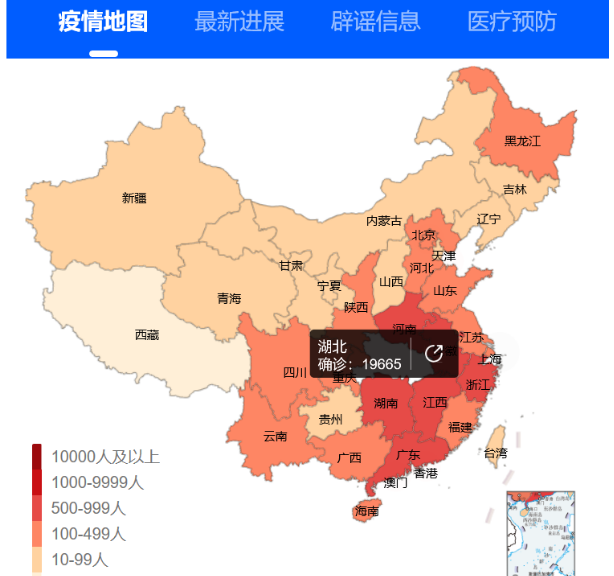
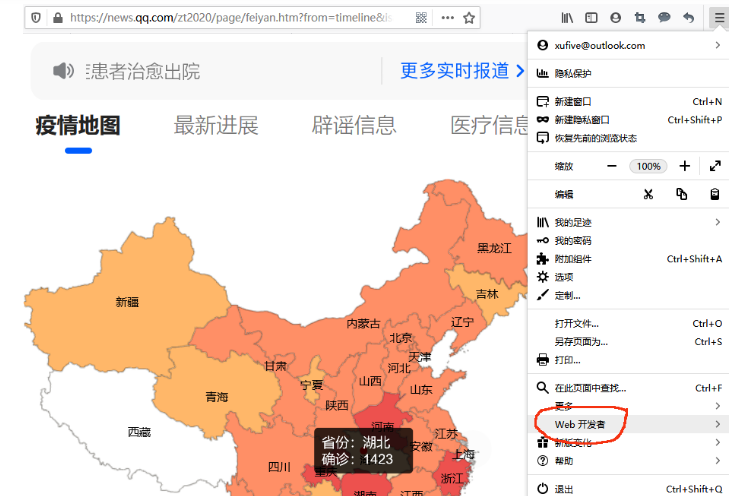
有了网址怎么抓数据呢?这里,可以从纷乱中找到最靠谱的下载方式。我习惯用FireFox浏览器,下面的讲解就以FireFox为例(其他浏览器基本类似)。
- 打开菜单,点击“Web开发者”,在递进菜单中选择"网络":

- 刷新页面,我们很快就能发现,应答类型为json格式的这个请求,最有可能包含我们需要的数据了:
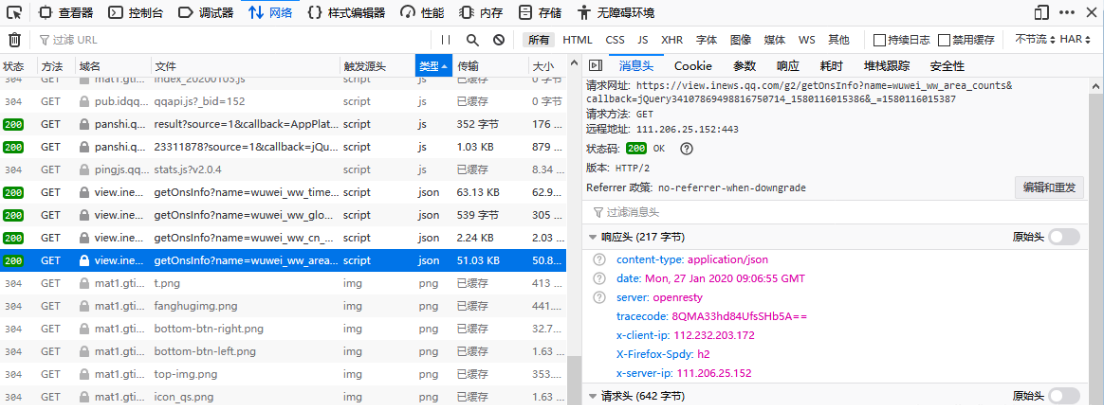


- 深入分析,我们就得到了url地址、请求方法、参数、应答格式等信息。查询参数中,callback是回调函数名,我们可以尝试置空,_应该是以毫秒为单位的当前时间戳。有了这些信息,分分钟就可以抓到数据了。我们先在IDLE中以交互方式抓一下看看效果:
>> import time, json, requests

>> url = 'https://view.inews.qq.com/g2/getOnsInfo?name=disease_h5&callback=&_=%d'%int(time.time()*1000)

>> data = json.loads(requests.get(url=url).json()['data'])
- 只要两行代码,就可以抓到数据了。怎么样,是不是超级简单?我们在来看看数据结构:
>>> data.keys()

dict_keys(['chinaTotal', 'chinaAdd', 'lastUpdateTime', 'areaTree', 'chinaDayList', 'chinaDayAddList', 'isShowAdd'])

>>> d = data['areaTree'][0]['children']

>>> len(d)

34

>>> [item['name'] for item in d]

['湖北', '浙江', '广东', '河南', '湖南', '江西', '安徽', '重庆', '山东', '江苏', '四川', '上海', '北京', '福建', '黑龙江', '广西', '陕西', '河北', '云南', '海南', '山西', '辽宁', '天津', '贵州', '甘肃', '吉林', '内蒙古', '宁夏', '新疆', '香港', '青海', '台湾', '澳门', '西藏']

>>> d[0]['children']

[{'name': '武汉', 'total': {'confirm': 10117, 'suspect': 0, 'dead': 414, 'heal': 431}, 'today': {'confirm': 1766, 'suspect': 0, 'dead': 52, 'heal': 58}}, {'name': '孝感', 'total': {'confirm': 1886, 'suspect': 0, 'dead': 25, 'heal': 9}, 'today': {'confirm': 424, 'suspect': 0, 'dead': 7, 'heal': 3}}, {'name': '黄冈', 'total': {'confirm': 1807, 'suspect': 0, 'dead': 29, 'heal': 60}, 'today': {'confirm': 162, 'suspect': 0, 'dead': 4, 'heal': 8}}, {'name': '随州', 'total': {'confirm': 834, 'suspect': 0, 'dead': 9, 'heal': 9}, 'today': {'confirm': 128, 'suspect': 0, 'dead': 1, 'heal': 0}}, {'name': '荆州', 'total': {'confirm': 801, 'suspect': 0, 'dead': 10, 'heal': 18}, 'today': {'confirm': 88, 'suspect': 0, 'dead': 1, 'heal': 6}}, {'name': '襄阳', 'total': {'confirm': 787, 'suspect': 0, 'dead': 2, 'heal': 10}, 'today': {'confirm': 52, 'suspect': 0, 'dead': 0, 'heal': 3}}, {'name': '黄石', 'total': {'confirm': 566, 'suspect': 0, 'dead': 2, 'heal': 25}, 'today': {'confirm': 57, 'suspect': 0, 'dead': 0, 'heal': 7}}, {'name': '宜昌', 'total': {'confirm': 563, 'suspect': 0, 'dead': 6, 'heal': 9}, 'today': {'confirm': 67, 'suspect': 0, 'dead': 2, 'heal': 0}}, {'name': '荆门', 'total': {'confirm': 508, 'suspect': 0, 'dead': 17, 'heal': 21}, 'today': {'confirm': 86, 'suspect': 0, 'dead': 1, 'heal': 5}}, {'name': '鄂州', 'total': {'confirm': 423, 'suspect': 0, 'dead': 18, 'heal': 8}, 'today': {'confirm': 41, 'suspect': 0, 'dead': 0, 'heal': 2}}, {'name': '咸宁', 'total': {'confirm': 399, 'suspect': 0, 'dead': 1, 'heal': 3}, 'today': {'confirm': 15, 'suspect': 0, 'dead': 1, 'heal': 1}}, {'name': '十堰', 'total': {'confirm': 353, 'suspect': 0, 'dead': 0, 'heal': 14}, 'today': {'confirm': 35, 'suspect': 0, 'dead': 0, 'heal': 5}}, {'name': '仙桃', 'total': {'confirm': 265, 'suspect': 0, 'dead': 5, 'heal': 0}, 'today': {'confirm': 40, 'suspect': 0, 'dead': 1, 'heal': 0}}, {'name': '恩施州', 'total': {'confirm': 144, 'suspect': 0, 'dead': 0, 'heal': 10}, 'today': {'confirm': 6, 'suspect': 0, 'dead': 0, 'heal': 4}}, {'name': '天门', 'total': {'confirm': 138, 'suspect': 0, 'dead': 10, 'heal': 1}, 'today': {'confirm': 10, 'suspect': 0, 'dead': 0, 'heal': 1}}, {'name': '潜江', 'total': {'confirm': 64, 'suspect': 0, 'dead': 1, 'heal': 0}, 'today': {'confirm': 10, 'suspect': 0, 'dead': 0, 'heal': 0}}, {'name': '神农架', 'total': {'confirm': 10, 'suspect': 0, 'dead': 0, 'heal': 2}, 'today': {'confirm': 0, 'suspect': 0, 'dead': 0, 'heal': 0}}, {'name': '地区待确认', 'total': {'confirm': 0, 'suspect': 0, 'dead': 0, 'heal': 3}, 'today': {'confirm': 0, 'suspect': 0, 'dead': 0, 'heal': 0}}]
数据处理
- 以省为单位画疫情图,我们只需要统计同属一个省的所有地市的确诊数据即可。最终的数据抓取代码如下:
import time, json, requests

def catch_distribution():

"""抓取行政区域确诊分布数据"""

data = {}

url = 'https://view.inews.qq.com/g2/getOnsInfo?name=disease_h5&callback=&_=%d'%int(time.time()*1000)

for item in json.loads(requests.get(url=url).json()['data'])['areaTree'][0]['children']:

if item['name'] not in data:

data.update({item['name']:0})

for city_data in item['children']:

data[item['name']] += int(city_data['total']['confirm'])

return data
数据可视化
数据可视化,我习惯使用matplotlib模块。matplotlib有很多扩展工具包(toolkits),比如,画3D需要mplot3d工具包,画地图的话,则需要basemap工具包,以及处理地图投影的pyproj模块。另外画海陆分界线、国界线、行政分界线等还需要shape数据。所需模块请自行安装,shape文件可以从这里下载,绘图用到的矢量字库可以从自己的电脑上随便找一个(我用的是simsun.ttf)。我的主程序是2019nCoV.py,shape文件下载下来之后,是这样保存的:


- 以下为全部代码,除了疫情地图,还包括了全国每日武汉肺炎确诊数据的下载和可视化。
# -*- coding: utf-8 -*-

import time

import json

import requests

from datetime import datetime

import numpy as np

import matplotlib

import matplotlib.figure

from matplotlib.font_manager import FontProperties

from matplotlib.backends.backend_agg import FigureCanvasAgg

from matplotlib.patches import Polygon

from matplotlib.collections import PatchCollection

from mpl_toolkits.basemap import Basemap

import matplotlib.pyplot as plt

import matplotlib.dates as mdates

plt.rcParams['font.sans-serif'] = ['FangSong'] # 设置默认字体

plt.rcParams['axes.unicode_minus'] = False # 解决保存图像时'-'显示为方块的问题

def catch_daily():

"""抓取每日确诊和死亡数据"""

url = 'https://view.inews.qq.com/g2/getOnsInfo?name=wuwei_ww_cn_day_counts&callback=&_=%d'%int(time.time()*1000)

data = json.loads(requests.get(url=url).json()['data'])

data.sort(key=lambda x:x['date'])

date_list = list() # 日期

confirm_list = list() # 确诊

suspect_list = list() # 疑似

dead_list = list() # 死亡

heal_list = list() # 治愈

for item in data:

month, day = item['date'].split('/')

date_list.append(datetime.strptime('2020-%s-%s'%(month, day), '%Y-%m-%d'))

confirm_list.append(int(item['confirm']))

suspect_list.append(int(item['suspect']))

dead_list.append(int(item['dead']))

heal_list.append(int(item['heal']))

return date_list, confirm_list, suspect_list, dead_list, heal_list

def catch_distribution():

"""抓取行政区域确诊分布数据"""

data = {}

url = 'https://view.inews.qq.com/g2/getOnsInfo?name=disease_h5&callback=&_=%d'%int(time.time()*1000)

for item in json.loads(requests.get(url=url).json()['data'])['areaTree'][0]['children']:

if item['name'] not in data:

data.update({item['name']:0})

for city_data in item['children']:

data[item['name']] += int(city_data['total']['confirm'])

return data

def plot_daily():

"""绘制每日确诊和死亡数据"""

date_list, confirm_list, suspect_list, dead_list, heal_list = catch_daily() # 获取数据

plt.figure('2019-nCoV疫情统计图表', facecolor='#f4f4f4', figsize=(10, 8))

plt.title('2019-nCoV疫情曲线', fontsize=20)

plt.plot(date_list, confirm_list, label='确诊')

plt.plot(date_list, suspect_list, label='疑似')

plt.plot(date_list, dead_list, label='死亡')

plt.plot(date_list, heal_list, label='治愈')

plt.gca().xaxis.set_major_formatter(mdates.DateFormatter('%m-%d')) # 格式化时间轴标注

plt.gcf().autofmt_xdate() # 优化标注(自动倾斜)

plt.grid(linestyle=':') # 显示网格

plt.legend(loc='best') # 显示图例

plt.savefig('2019-nCoV疫情曲线.png') # 保存为文件

#plt.show()

def plot_distribution():

"""绘制行政区域确诊分布数据"""

data = catch_distribution()

font_14 = FontProperties(fname='res/simsun.ttf', size=14)

font_11 = FontProperties(fname='res/simsun.ttf', size=11)

width = 1600

height = 800

rect = [0.1, 0.12, 0.8, 0.8]

lat_min = 0

lat_max = 60

lon_min = 77

lon_max = 140

'''全球等经纬投影模式使用以下设置,否则使用上面的对应设置

width = 3000

height = 1500

rect = [0, 0, 1, 1]

lat_min = -90

lat_max = 90

lon_min = 0

lon_max = 360

'''

handles = [

matplotlib.patches.Patch(color='#ffaa85', alpha=1, linewidth=0),

matplotlib.patches.Patch(color='#ff7b69', alpha=1, linewidth=0),

matplotlib.patches.Patch(color='#bf2121', alpha=1, linewidth=0),

matplotlib.patches.Patch(color='#7f1818', alpha=1, linewidth=0),

]

labels = [ '1-9人', '10-99人', '100-999人', '>1000人']

provincePos = {

"辽宁省":[121.7,40.9],

"吉林省":[124.5,43.5],

"黑龙江省":[125.6,46.5],

"北京市":[116.0,39.9],

"天津市":[117.0,38.7],

"内蒙古自治区":[110.0,41.5],

"宁夏回族自治区":[105.2,37.0],

"山西省":[111.0,37.0],

"河北省":[114.0,37.8],

"山东省":[116.5,36.0],

"河南省":[111.8,33.5],

"陕西省":[107.5,33.5],

"湖北省":[111.0,30.5],

"江苏省":[119.2,32.5],

"安徽省":[115.5,31.8],

"上海市":[121.0,31.0],

"湖南省":[110.3,27.0],

"江西省":[114.0,27.0],

"浙江省":[118.8,28.5],

"福建省":[116.2,25.5],

"广东省":[113.2,23.1],

"台湾省":[120.5,23.5],

"海南省":[108.0,19.0],

"广西壮族自治区":[107.3,23.0],

"重庆市":[106.5,29.5],

"云南省":[101.0,24.0],

"贵州省":[106.0,26.5],

"四川省":[102.0,30.5],

"甘肃省":[103.0,35.0],

"青海省":[95.0,35.0],

"新疆维吾尔自治区":[85.5,42.5],

"西藏自治区":[85.0,31.5],

"香港特别行政区":[115.1,21.2],

"澳门特别行政区":[112.5,21.2]

}

fig = matplotlib.figure.Figure()

fig.set_size_inches(width/100, height/100) # 设置绘图板尺寸

axes = fig.add_axes(rect)

# 兰博托投影模式,局部

m = Basemap(projection='lcc', llcrnrlon=77, llcrnrlat=14, urcrnrlon=140, urcrnrlat=51, lat_1=33, lat_2=45, lon_0=100, ax=axes)

# 兰博托投影模式,全图

#m = Basemap(projection='lcc', llcrnrlon=80, llcrnrlat=0, urcrnrlon=140, urcrnrlat=51, lat_1=33, lat_2=45, lon_0=100, ax=axes)

# 圆柱投影模式,局部

#m = Basemap(llcrnrlon=lon_min, urcrnrlon=lon_max, llcrnrlat=lat_min, urcrnrlat=lat_max, resolution='l', ax=axes)

# 正射投影模式

#m = Basemap(projection='ortho', lat_0=36, lon_0=102, resolution='l', ax=axes)

# 全球等经纬投影模式,

#m = Basemap(llcrnrlon=lon_min, urcrnrlon=lon_max, llcrnrlat=lat_min, urcrnrlat=lat_max, resolution='l', ax=axes)

#m.etopo()

m.readshapefile('res/china-shapefiles-master/china', 'province', drawbounds=True)

m.readshapefile('res/china-shapefiles-master/china_nine_dotted_line', 'section', drawbounds=True)

m.drawcoastlines(color='black') # 洲际线

m.drawcountries(color='black') # 国界线

m.drawparallels(np.arange(lat_min,lat_max,10), labels=[1,0,0,0]) #画经度线

m.drawmeridians(np.arange(lon_min,lon_max,10), labels=[0,0,0,1]) #画纬度线

pset = set()

for info, shape in zip(m.province_info, m.province):

pname = info['OWNER'].strip('\x00')

fcname = info['FCNAME'].strip('\x00')

if pname != fcname: # 不绘制海岛

continue

for key in data.keys():

if key in pname:

if data[key] == 0:

color = '#f0f0f0'

elif data[key] < 10:

color = '#ffaa85'

elif data[key] <100:

color = '#ff7b69'

elif data[key] < 1000:

color = '#bf2121'

else:

color = '#7f1818'

break

poly = Polygon(shape, facecolor=color, edgecolor=color)

axes.add_patch(poly)

pos = provincePos[pname]

text = pname.replace("自治区", "").replace("特别行政区", "").replace("壮族", "").replace("维吾尔", "").replace("回族", "").replace("省", "").replace("市", "")

if text not in pset:

x, y = m(pos[0], pos[1])

axes.text(x, y, text, fontproperties=font_11, color='#00FFFF')

pset.add(text)

axes.legend(handles, labels, bbox_to_anchor=(0.5, -0.11), loc='lower center', ncol=4, prop=font_14)

axes.set_title("2019-nCoV疫情地图", fontproperties=font_14)

FigureCanvasAgg(fig)

fig.savefig('2019-nCoV疫情地图.png')

if __name__ == '__main__':

plot_daily()

plot_distribution()
nCoV图表
2019-nCoV疫情曲线:

2019-nCoV疫情地图(兰勃托投影):

2019-nCoV疫情地图(圆柱投影):

2019-nCoV疫情地图(正射投影):

2019-nCoV疫情地图(全球等经纬投影模式):

Python爬虫 抓肺炎疫情实时数据的更多相关文章
- Python爬虫抓取东方财富网股票数据并实现MySQL数据库存储
Python爬虫可以说是好玩又好用了.现想利用Python爬取网页股票数据保存到本地csv数据文件中,同时想把股票数据保存到MySQL数据库中.需求有了,剩下的就是实现了. 在开始之前,保证已经安装好 ...
- Python爬虫工程师必学——App数据抓取实战 ✌✌
Python爬虫工程师必学——App数据抓取实战 (一个人学习或许会很枯燥,但是寻找更多志同道合的朋友一起,学习将会变得更加有意义✌✌) 爬虫分为几大方向,WEB网页数据抓取.APP数据抓取.软件系统 ...
- Python爬虫工程师必学APP数据抓取实战✍✍✍
Python爬虫工程师必学APP数据抓取实战 整个课程都看完了,这个课程的分享可以往下看,下面有链接,之前做java开发也做了一些年头,也分享下自己看这个视频的感受,单论单个知识点课程本身没问题,大 ...
- Python爬虫工程师必学——App数据抓取实战
Python爬虫工程师必学 App数据抓取实战 整个课程都看完了,这个课程的分享可以往下看,下面有链接,之前做java开发也做了一些年头,也分享下自己看这个视频的感受,单论单个知识点课程本身没问题,大 ...
- python爬虫抓网页的总结
python爬虫抓网页的总结 更多 python 爬虫 学用python也有3个多月了,用得最多的还是各类爬虫脚本:写过抓代理本机验证的脚本,写过在discuz论坛中自动登录自动发贴的脚本,写过自 ...
- python 爬虫抓取心得
quanwei9958 转自 python 爬虫抓取心得分享 urllib.quote('要编码的字符串') 如果你要在url请求里面放入中文,对相应的中文进行编码的话,可以用: urllib.quo ...
- python爬虫抓站的一些技巧总结
使用python爬虫抓站的一些技巧总结:进阶篇 一.gzip/deflate支持现在的网页普遍支持gzip压缩,这往往可以解决大量传输时间,以VeryCD的主页为例,未压缩版本247K,压缩了以后45 ...
- Python爬虫----抓取豆瓣电影Top250
有了上次利用python爬虫抓取糗事百科的经验,这次自己动手写了个爬虫抓取豆瓣电影Top250的简要信息. 1.观察url 首先观察一下网址的结构 http://movie.douban.com/to ...
- 转载:用python爬虫抓站的一些技巧总结
原文链接:http://www.pythonclub.org/python-network-application/observer-spider 原文的名称虽然用了<用python爬虫抓站的一 ...
随机推荐
- logback日志大量写磁盘导致微服务不能正常响应的解决方案
最近几天,遇到一个莫名其妙的问题,每天几乎同一时段微服务自己跑着跑着就假死了,过几个小时就又自动恢复了. 通过对定时任务.网卡.内存.磁盘.业务日志的排查分析,只有磁盘的IO在假死前一段时间偏高,经查 ...
- T-shirt
题目描述 JSZKC is going to spend his vacation! His vacation has N days. Each day, he can choose a T-shi ...
- webpack4的迁移
引用于https://www.jianshu.com/p/7ae252f27f09 感觉是突然之间,webpack4的消息就满天飞了,听说打包速度提高了很多,还有最大的噱头是实现了零配置,leader ...
- iOS运营级B2B服务平台App、自定义图标库、个人中心页面、识别身份证Demo、瀑布流等源码
iOS精选源码 简单的个人中心页面-自定义导航栏并予以渐变动画 一个近乎完整的可识别中国身份证信息的Demo 可自动快速... iOS可自定义图表库 - PNChart 开源一款曾是运营级的B2B服务 ...
- Java IO: Buffered和Data
作者:Jakob Jenkov 译者: 李璟(jlee381344197@gmail.com) 本小节会简要概括Java IO中Buffered和data的输入输出流,主要涉及以下4个类型的流:Bu ...
- 关于后端下载后端返回的blob类型文件的下载
关于后端返回blob类型的文件下载记录,在请求的时候前端设置响应类型 responseType: 'blob', const blob = new Blob([r], {type: r.type}); ...
- 3DSMAX安装未完成,某些产品无法安装的解决方法
3DSMAX提示安装未完成,某些产品无法安装该怎样解决呢?,一些朋友在win7或者win10系统下安装3DSMAX失败提示3DSMAX安装未完成,某些产品无法安装,也有时候想重新安装3DSMAX的时候 ...
- Windows下使用swoole的环境搭建
Cygwin 官方地址:http://www.cygwin.com/ swoole 官方下载地址:https://github.com/swoole/swoole-src/releases 方法/步骤 ...
- 由生到死10个月!做App中的“二”有多难
十月,原本是怀胎过程的喜悦时光,但这段个时光,如今却是绝大多数App从生到死的所有时间.在App市场表面形式一片大好,彻底主宰我们生活.工作.娱乐的当下,绝大多数用户只是在App海洋中只取一瓢饮,其他 ...
- R (Ani Katchova) · Eric
首先介绍一下Ani Katchova的R教程,然后再继续总结Advanced R. R introduction setwd("path")设置工作路径 mydata<-re ...