
matplotlib实例笔记
下面的图型是在一幅画布上建立的四个球员相关数据的极坐标图
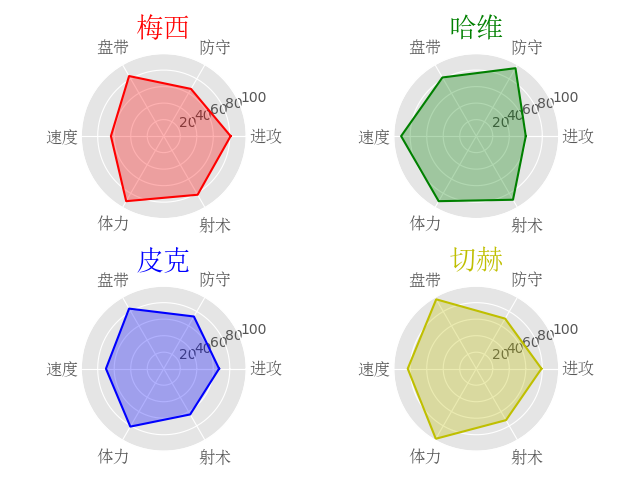
关于这个图的代码如下:
 #_*_coding:utf-8_*_

 import numpy as np

 import matplotlib.pyplot as plt

 from matplotlib.font_manager import FontProperties

 plt.style.use('ggplot')

 font=FontProperties(fname=r'c:\windows\fonts\simsun.ttc',size=12)

 # 本行是为了有效显示中文的字体与大小

 ability_size=6

 ability_label=['进攻','防守','盘带','速度','体力','射术']

 # 创建每个极坐标的位置

 ax1=plt.subplot(221,projection='polar')

 ax2=plt.subplot(222,projection='polar')

 ax3=plt.subplot(223,projection='polar')

 ax4=plt.subplot(224,projection='polar')

 player={

     'M': np.random.randint(size=ability_size, low=60, high=99),

     'H': np.random.randint(size=ability_size, low=60, high=99),

     'P': np.random.randint(size=ability_size, low=60, high=99),

     'Q': np.random.randint(size=ability_size, low=60, high=99),

 }

 theta=np.linspace(0,2*np.pi,6,endpoint=False)

 theta=np.append(theta,theta[0])

 #下面分别画四个球员的能力极坐标图

 player['M']=np.append(player['M'],player['M'][0])

 ax1.plot(theta,player['M'],'r')

 ax1.fill(theta,player['M'],'r',alpha=0.3)

 ax1.set_xticks(theta)

 ax1.set_xticklabels(ability_label,fontproperties=font)

 ax1.set_title('梅西',fontproperties=font,color='r',size=20)

 ax1.set_yticks([20,40,60,80,100])

 player['H']=np.append(player['H'],player['H'][0])

 ax2.plot(theta,player['H'],'g')

 ax2.fill(theta,player['H'],'g',alpha=0.3)

 ax2.set_xticks(theta)

 ax2.set_xticklabels(ability_label,fontproperties=font)

 ax2.set_title('哈维',fontproperties=font,color='g',size=20)

 ax2.set_yticks([20,40,60,80,100])

 player['P']=np.append(player['P'],player['P'][0])

 ax3.plot(theta,player['P'],'b')

 ax3.fill(theta,player['P'],'b',alpha=0.3)

 ax3.set_xticks(theta)

 ax3.set_xticklabels(ability_label,fontproperties=font)

 ax3.set_title('皮克',fontproperties=font,color='b',size=20)

 ax3.set_yticks([20,40,60,80,100])

 player['Q']=np.append(player['Q'],player['Q'][0])

 ax4.plot(theta,player['Q'],'y')

 ax4.fill(theta,player['Q'],'y',alpha=0.3)

 ax4.set_xticks(theta)

 ax4.set_xticklabels(ability_label,fontproperties=font)

 ax4.set_title('切赫',fontproperties=font,color='y',size=20)

 ax4.set_yticks([20,40,60,80,100])

 plt.show()
上述代码也可以利用for循环简化一下
 #_*_coding:utf-8_*_

 import numpy as np

 import matplotlib.pyplot as plt

 from matplotlib.font_manager import FontProperties

 plt.style.use('ggplot')

 font=FontProperties(fname=r'c:\windows\fonts\simsun.ttc',size=12)

 ability_size=6

 ability_label=['进攻','防守','盘带','速度','体力','射术']

 ax1=plt.subplot(221,projection='polar')

 ax2=plt.subplot(222,projection='polar')

 ax3=plt.subplot(223,projection='polar')

 ax4=plt.subplot(224,projection='polar')

 player={

     'M': np.random.randint(size=ability_size, low=60, high=99),

     'H': np.random.randint(size=ability_size, low=60, high=99),

     'P': np.random.randint(size=ability_size, low=60, high=99),

     'Q': np.random.randint(size=ability_size, low=60, high=99),

 }

 theta=np.linspace(0,2*np.pi,6,endpoint=False)

 theta=np.append(theta,theta[0])

 color4=['r','b','g','y']

 player4=['M','H','P','Q']

 ax=[ax1,ax2,ax3,ax4]

 name=['梅西','哈维','皮克','切赫']

 for i in range(4):

     player[player4[i]]=np.append(player[player4[i]],player[player4[i]][0])

     ax[i].plot(theta,player[player4[i]],color4[i])

     ax[i].fill(theta,player[player4[i]],color4[i],alpha=0.3)

     ax[i].set_xticks(theta)

     ax[i].set_xticklabels(ability_label,fontproperties=font)

     ax[i].set_title(name[i],fontproperties=font,color=color4[i],size=20)

     ax[i].set_yticks([20,40,60,80,100])

 plt.show()
matplotlib实例笔记的更多相关文章
- SVN版本库(访问权限)配置实例笔记
http://blog.csdn.net/zjianbo/article/details/8578297 SVN版本库(访问权限)配置实例笔记 本系列文章由ex_net(张建波)编写,转载请注明出处. ...
- Matplotlib学习笔记(二)
原 Matplotlib学习笔记 参考:Python数据科学入门教程 Python3.6.1 jupyter notebook .caret, .dropup > .btn > .car ...
- Matplotlib学习笔记(一)
原 matplotlib学习笔记 参考:Python数据科学入门教程 Python3.6.1 jupyter notebook .caret, .dropup > .btn > .ca ...
- matplotlib学习笔记.CookBook
matplotlib 是Python下的一个高质量的画图库,可以简单的类似于MATLAB方法构建高质量的图表. 原始文章地址:http://zanyongli.i.sohu.com/blog/view ...
- Matplotlib 学习笔记
注:该文是上了开智学堂数据科学基础班的课后做的笔记,主讲人是肖凯老师. 数据绘图 数据可视化的原则 为什么要做数据可视化? 为什么要做数据可视化?因为可视化后获取信息的效率高.为什么可视化后获取信息的 ...
- matplotlib学习笔记
1.简介 matplotlib是python的一个2D绘图库,它可以在不同平台上地使用多种通用的绘图格式(hardcopy formats)和交互环境绘制出出版物质量级别的图片.matplotlib可 ...
- 科学计算和可视化(numpy及matplotlib学习笔记)
网上学习资料:https://2d.hep.com.cn/1865445/9 numpy库内容: 函数 描述 np.array([x,y,z],dtype=int) 从Python列表和元组创造数组 ...
- SQL经典实例笔记
目录 前言 第一章:检索记录 在Where字句中使用别名 前言 本文是根据我阅读的书籍SQL经典实例而写的笔记,只记载我觉得有价值的内容 第一章:检索记录 在Where字句中使用别名 --错误实例 s ...
- python画图matplotlib基础笔记
numpy~~基础计算库,多维数组处理 scipy~~基于numpy,用于数值计算等等,默认调用intel mkl(高度优化的数学库) pandas~~强大的数据框,基于numpy matplotli ...
随机推荐
- JAVA基础之访问控制权限
包:库单元 1.当编写一个Java源代码文件时,此文件通常被称为编译单元(有时也被称为转译单元). 2.每个编译单元都必须有一个后缀名.java,而在编译单元内则可以有一个public类,该类名称必须 ...
- 枚举(Enum)
enum是一个全新的“类”. 枚举(Enum): 我们所定义的每个枚举类型都继承自java.lang.Enum类.枚举中的每个成员都是public static final的. 当您使用“enum”定 ...
- 微信小程序网络通信(一)
本文链接:https://blog.csdn.net/melovemingming/article/details/82831749微信小程序网络服务器网络配置支持request 普通网络请求.支持套 ...
- MQTT 客户端应用及常见问题(C#)
https://blog.csdn.net/dengyaan/article/details/51752327 最近因为工作需要,需要使用C# 语言编写一个通过MQTT协议 ,上传数据到云端的工具.因 ...
- Docs-.NET-C#-指南-语言参考-关键字-值类型:内置数值转换
ylbtech-Docs-.NET-C#-指南-语言参考-关键字-值类型:内置数值转换 1.返回顶部 1. 内置数值转换(C# 参考) 2019/10/22 C# 提供了一组整型和浮点数值类型. 任何 ...
- pytorch nn.Sequential()动态添加方法
之前我们使用nn.Sequential()都是直接写死的,就如下所示: # Example of using Sequential model = nn.Sequential( nn.Conv2d(, ...
- Oracle insert大量数据经验之谈
在很多时候,我们会需要对一个表进行插入大量的数据,并且希望在尽可能短的时间内完成该工作,这里,和大家分享下我平时在做大量数据insert的一些经验. 前提:在做insert数据之前,如果是非生产环境, ...
- Linux记录-shell自动化批量部署sql脚本并记录日志信息(转载)
#!/bin/bash #script_version=v110 db_host=127.0.0.1 db_port=3306 db_username=db_test_inst db_passwd=` ...
- maven 引入的jar有出现两种图标
两种同样都引入到maven项目中,但是第二种在打包的过程中会显示找不到jar,无法调用!
- jQuery 属性操作 - toggleClass() 方法
实例 对设置和移除所有 元素的 "main" 类进行切换: $("button").click(function(){ $("p").tog ...