Valgrind.Callgrind使用
Callgrind介绍
- 用来对统计程序的函数调用之间的关系, 并统计每个函数的耗时
- Callgrind之所以能够发现函数调用的关系, 依赖于平台的明确返回和调用指令. 在x86和amd64平台上works best, 但在PowerPC ARM Thumb以及MIPS上无法运行
- 可以使用gprof2dot来把profile结果生成图片
- SOF上一个关于C++ profile的很好的问题
对整个程序进行profile
- 先执行
valgrind --tool=callgrind ./prog_name, 跑完之后会生成一个callgrind.out.X的profile文件, X为线程号 - 使用KCachegrind分析结果文件:
kcachegrind callgrind.out.X. KCachegrind文档
只对程序某个片段进行profile
使用上面的方式的一大缺点就是会对整个程序都进行profile, 这样会导致过程很慢. 如果我们只想对程序的某个部分进行profile, 那么可以如下使用:
- 在一个shell中输入命令
valgrind --tool=callgrind --dump-instr=yes -v --instr-atstart=no ./prog_name > log.txt, 其中,--dump-instr=yes表示生成汇编指令注释,--instr-atstart=no表示不是程序启动时就启动profile, 方便控制节点. - 当程序运行到我们想要profile的片段时, 在另一个shell中输入
callgrind_control -i on - 当想要profile部分结束之后, 输入
callgrind_control -k - 使用KCachegrind分析Callgrind.out文件
更先进做法
上面的做法也就只能大概控制profile片段, 实操性不强. 根据文档说明, 可以使用指令来控制具体的Callgrind进行profile起止时间:
#include <valgrind/callgrind.h>

//codes...

//request callgrind to start full profile

CALLGRIND_START_INSTRUMENTATION;

//codes...

//request callgrind to stop full profile

CALLGRIND_STOP_INSTRUMENTATION;
callgrind.h头文件见这里. 上面的两个请求命令其实是在头文件里面定义两个宏.
/* Start full callgrind instrumentation if not already switched on.

   When cache simulation is done, it will flush the simulated cache;

   this will lead to an artifical cache warmup phase afterwards with

   cache misses which would not have happened in reality. */

#define CALLGRIND_START_INSTRUMENTATION                              \

  VALGRIND_DO_CLIENT_REQUEST_STMT(VG_USERREQ__START_INSTRUMENTATION, \

                                  0, 0, 0, 0, 0)

/* Stop full callgrind instrumentation if not already switched off.

   This flushes Valgrinds translation cache, and does no additional

   instrumentation afterwards, which effectivly will run at the same

   speed as the "none" tool (ie. at minimal slowdown).

   Use this to bypass Callgrind aggregation for uninteresting code parts.

   To start Callgrind in this mode to ignore the setup phase, use

   the option "--instr-atstart=no". */

#define CALLGRIND_STOP_INSTRUMENTATION                               \

  VALGRIND_DO_CLIENT_REQUEST_STMT(VG_USERREQ__STOP_INSTRUMENTATION,  \

                                  0, 0, 0, 0, 0)
在一次程序运行中dump多次
使用命令CALLGRIND_DUMP_STATS;可以让Callgrind立即生成一个dump. 每次遇到这个命令都会生成一个dump, 即使在比如for循环里面, 那么就会生成循环次数相等的dump. 注意,对于CALLGRIND_START_INSTRUMENTATION和CALLGRIND_STOP_INSTRUMENTATION这对组合控制的是让Callgrind只统计命令区间内的代码, 即使这对组合放在比如for循环中, 如果没有CALLGRIND_DUMP_STATS;, 那么也只会生成一个dump.
使用CALLGRIND_ZERO_STATS;可以清除Callgrind当前的数据状态.
使用KCachegrind打开的profile dump界面:
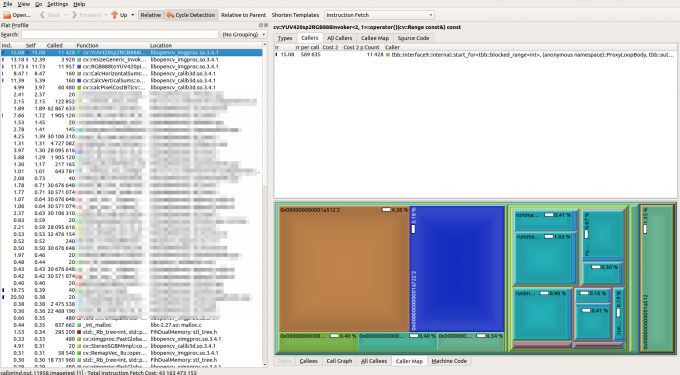
通过按Sl排列, 就可以很容易的看出哪个函数耗时占比最大, 从而针对性的优化

Valgrind.Callgrind使用的更多相关文章
- valgrind的memchk和callgrind
一.安装valgrind 安装valgrind,正常的三部曲configure/make/make install就行. 二.memchk使用 1.执行命令 [root@10g-host4 tools ...
- valgrind的callgrind工具进行多线程性能分析
1.http://valgrind.org/downloads/old.html 2.yum install valgrind Valgrind的主要作者Julian Seward刚获得了今年的Goo ...
- 使用valgrind检查内存
Valgrind是运行在Linux上一套基于仿真技术的程序调试和分析工具,是公认的最接近Purify的产品,它包含一个内核——一个软件合成的CPU,和一系列的小工具,每个工具都可以完成一项任务——调试 ...
- 【转】 如何使用Valgrind memcheck工具进行C/C++的内存泄漏检测
系统编程中一个重要的方面就是有效地处理与内存相关的问题.你的工作越接近系统,你就需要面对越多的内存问题.有时这些问题非常琐碎,而更多时候它会演变成一个调试内存问题的恶梦.所以,在实践中会用到很多工具来 ...
- linux下内存泄露检测工具Valgrind介绍
目前在linux开发一个分析实时路况的应用程序,在联合测试中发现程序存在内存泄露的情况. 这下着急了,马上就要上线了,还好发现了一款Valgrind工具,完美的解决了内存泄露的问题. 推荐大家可以使用 ...
- Valgrind简单用法
Valgrind的主要作者Julian Seward刚获得了今年的Google-O'Reilly开源大奖之一──Best Tool Maker.让我们一起来看一下他的作品.Valgrind是运行在Li ...
- VALGRIND
系统编程中一个重要的方面就是有效地处理与内存相关的问题.你的工作越接近系统,你就需要面对越多的内存问题.有时这些问题非常琐碎,而更多时候它会演变成一个调试内存问题的恶梦.所以,在实践中会用到很多工具来 ...
- 内存泄漏检测工具Valgrind
1概述 1.1 介绍 Valgrind是一套Linux下,开放源代码(GPL V2)的仿真调试工具的集合.Valgrind由内核(core)以及基于内核的其他调试工具组成.内核类似于一个框架(fram ...
- [转]Valgrind简单用法
[转]Valgrind简单用法 http://www.cnblogs.com/sunyubo/archive/2010/05/05/2282170.html Valgrind的主要作者Julian S ...
随机推荐
- jQuery ajax如何传多个值到后台页面,举例:
一.js代码 <script type="text/JavaScript">$("#save_change_<{$aff.Id}>"). ...
- [Swift]LeetCode863. 二叉树中所有距离为 K 的结点 | All Nodes Distance K in Binary Tree
We are given a binary tree (with root node root), a targetnode, and an integer value K. Return a lis ...
- C/C++数据在内存中的存储方式
目录 1 内存地址 2 内存空间 在学习C/C++编程语言时,免不了和内存打交道,在计算机中,我们存储有电影,文档,音乐等数据,这些数据在内存中是以什么形式存储的呢?下面做一下简单介绍. 本文是学 ...
- 原有vue项目接入typescript
原有vue项目接入typescript 为什么要接入typescript javascript由于自身的弱类型,使用起来非常灵活. 这也就为大型项目.多人协作开发埋下了很多隐患.如果是自己的私有业务倒 ...
- 【Redis篇】Redis集群安装与初始
一.前述 本文将单台节点不同端口模拟集群方式. 二.具体搭建 前提是安装好redis具体可参考http://www.cnblogs.com/LHWorldBlog/p/8463269.html 1 ...
- .net core使用EasyNetQ做EventBus
随着SOA.微服务.CQRS的盛行,EventBus越来越流行,上GitHub搜了一下,还是有蛮多的这类实现,老牌的有NServiceBus(收费).MassTransit,最近的有CAP(国人写的, ...
- asp.net core 系列 6 MVC框架路由(下)
一.URL 生成 接着上篇讲MVC的路由,MVC 应用程序可以使用路由的 URL 生成功能,生成指向操作的 URL 链接. 生成 URL 可消除硬编码 URL,使代码更稳定.更易维护. 此部分重点介绍 ...
- C++、Java语法差异对照表
C++.Java语法差异对照表 C++ and Java Syntax Differences Cheat Sheet First, two big things--the main function ...
- Nginx+Tomcat搭建集群,Spring Session+Redis实现Session共享
小伙伴们好久不见!最近略忙,博客写的有点少,嗯,要加把劲.OK,今天给大家带来一个JavaWeb中常用的架构搭建,即Nginx+Tomcat搭建服务集群,然后通过Spring Session+Redi ...
- 使用RESTful风格开发Java Web
什么是RESTful风格? REST是REpresentational State Transfer的缩写(一般中文翻译为表述性状态转移),REST 是一种体系结构,而 HTTP 是一种包含了 RES ...