《DSP using MATLAB》示例Example4.13


代码:
b = [1, 0, -1]; a = [1, 0, -0.81]; % [R, p, C] = residuez(b,a); Mp = (abs(p))'
Ap = (angle(p))'/pi %% ----------------------------------------------
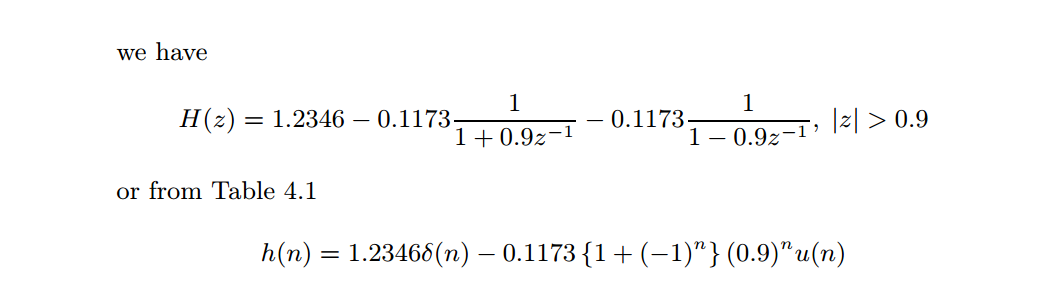
%% START a determine H(z) and sketch
%% ----------------------------------------------
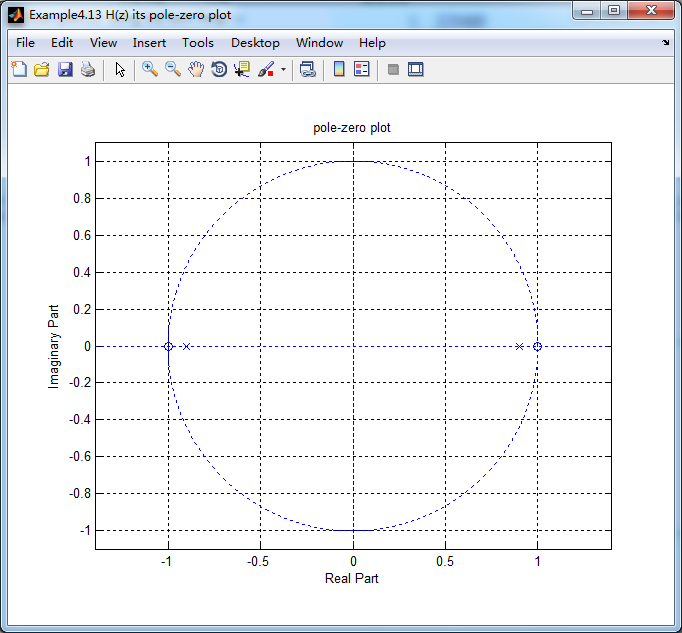
figure('NumberTitle', 'off', 'Name', 'Example4.13 H(z) its pole-zero plot')
set(gcf,'Color','white');
zplane(b,a);
title('pole-zero plot'); grid on; %% ----------------------------------------------
%% END
%% ---------------------------------------------- %% --------------------------------------------------------------
%% START b |H| <H
%% 1st form of freqz
%% --------------------------------------------------------------
[H,w] = freqz(b,a,500); % 1st form of freqz magH = abs(H); angH = angle(H); realH = real(H); imagH = imag(H); %% ================================================
%% START H's mag ang real imag
%% ================================================
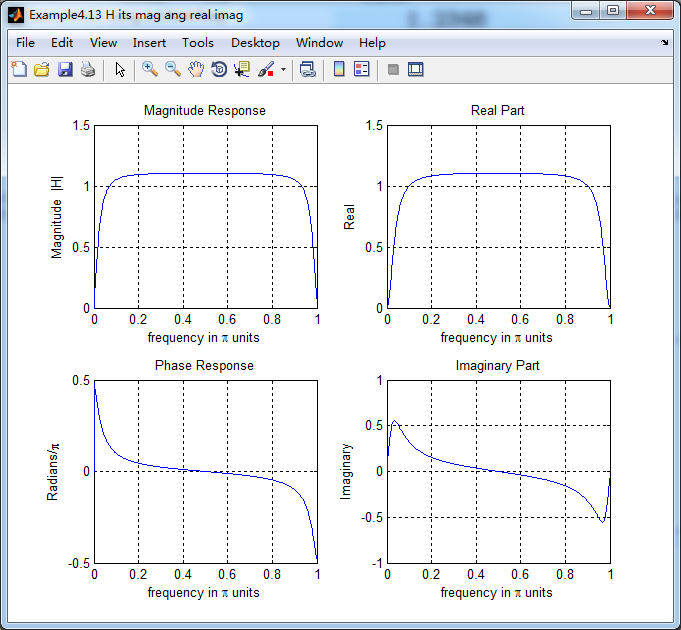
figure('NumberTitle', 'off', 'Name', 'Example4.13 H its mag ang real imag');
set(gcf,'Color','white');
subplot(2,2,1); plot(w/pi,magH); grid on; %axis([0,1,0,1.5]);
title('Magnitude Response');
xlabel('frequency in \pi units'); ylabel('Magnitude |H|');
subplot(2,2,3); plot(w/pi, angH/pi); grid on; % axis([-1,1,-1,1]);
title('Phase Response');
xlabel('frequency in \pi units'); ylabel('Radians/\pi'); subplot('2,2,2'); plot(w/pi, realH); grid on;
title('Real Part');
xlabel('frequency in \pi units'); ylabel('Real');
subplot('2,2,4'); plot(w/pi, imagH); grid on;
title('Imaginary Part');
xlabel('frequency in \pi units'); ylabel('Imaginary');
%% ==================================================
%% END H's mag ang real imag
%% ================================================== %% ---------------------------------------------------------------
%% END b |H| <H
%% --------------------------------------------------------------- %% --------------------------------------------------------------
%% START b |H| <H
%% 3rd form of freqz
%% --------------------------------------------------------------
w = [0:1:500]*pi/500; H = freqz(b,a,w);
%[H,w] = freqz(b,a,200,'whole'); % 3rd form of freqz magH = abs(H); angH = angle(H); realH = real(H); imagH = imag(H); %% ================================================
%% START H's mag ang real imag
%% ================================================
figure('NumberTitle', 'off', 'Name', 'Example4.13 using 3rd form freqz ');
set(gcf,'Color','white');
subplot(2,2,1); plot(w/pi,magH); grid on; %axis([0,1,0,1.5]);
title('Magnitude Response');
xlabel('frequency in \pi units'); ylabel('Magnitude |H|');
subplot(2,2,3); plot(w/pi, angH/pi); grid on; % axis([-1,1,-1,1]);
title('Phase Response');
xlabel('frequency in \pi units'); ylabel('Radians/\pi'); subplot('2,2,2'); plot(w/pi, realH); grid on;
title('Real Part');
xlabel('frequency in \pi units'); ylabel('Real');
subplot('2,2,4'); plot(w/pi, imagH); grid on;
title('Imaginary Part');
xlabel('frequency in \pi units'); ylabel('Imaginary');
%% ==================================================
%% END H's mag ang real imag
%% ================================================== %% ---------------------------------------------------------------
%% END b |H| <H
%% ---------------------------------------------------------------
结果:


《DSP using MATLAB》示例Example4.13的更多相关文章
- DSP using MATLAB 示例 Example3.13
上代码: w = [0:1:500]*pi/500; % freqency between 0 and +pi, [0,pi] axis divided into 501 points. H = ex ...
- DSP using MATLAB 示例Example3.21
代码: % Discrete-time Signal x1(n) % Ts = 0.0002; n = -25:1:25; nTs = n*Ts; Fs = 1/Ts; x = exp(-1000*a ...
- DSP using MATLAB 示例 Example3.19
代码: % Analog Signal Dt = 0.00005; t = -0.005:Dt:0.005; xa = exp(-1000*abs(t)); % Discrete-time Signa ...
- DSP using MATLAB示例Example3.18
代码: % Analog Signal Dt = 0.00005; t = -0.005:Dt:0.005; xa = exp(-1000*abs(t)); % Continuous-time Fou ...
- DSP using MATLAB 示例Example3.23
代码: % Discrete-time Signal x1(n) : Ts = 0.0002 Ts = 0.0002; n = -25:1:25; nTs = n*Ts; x1 = exp(-1000 ...
- DSP using MATLAB 示例Example3.22
代码: % Discrete-time Signal x2(n) Ts = 0.001; n = -5:1:5; nTs = n*Ts; Fs = 1/Ts; x = exp(-1000*abs(nT ...
- DSP using MATLAB 示例Example3.17
- DSP using MATLAB示例Example3.16
代码: b = [0.0181, 0.0543, 0.0543, 0.0181]; % filter coefficient array b a = [1.0000, -1.7600, 1.1829, ...
- DSP using MATLAB 示例 Example3.15
上代码: subplot(1,1,1); b = 1; a = [1, -0.8]; n = [0:100]; x = cos(0.05*pi*n); y = filter(b,a,x); figur ...
随机推荐
- 微信video标签全屏无法退出bug 本文系转载
安卓(android)微信里面video播放视频,会被强制全屏,播放完毕后还有腾讯推荐的视频,非常讨厌..强制被全屏无法解决,但是视频播放完毕后退出播放器可以解决.方法就是视频播放完毕后,用音频aud ...
- EF没有同步更新(转)
不知道这算不算一个bug,当你新建一个从数据库生成的edmx时,他能正确的生成所有的tt文件,但是当你从数据库更新表结构时,他不能正确的更新tt文件,以建立Model1.edmx为例,在解决方案中展开 ...
- ajax加载模块实时刷新的原理
var loadMenu = function(data) { var trs = template.render('menu-list-temp', {'list': data}); ...
- Hibernate单向一对多对象关系模型映射
1 hibernate 的对象关系映射 Orm: 类-----表 属性------字段 对象------记录 表:在数据库中存在主外键的关系,反向工厂类是由表生成,在由表生成类的时候,类和类之间存在者 ...
- app上传到app Store常见问题
一.首先看一下提交界面出现的问题(能成功打包成.ipa) 产生问题的原因如下:由于工程中含有sub project,而sub project中有private或public的文件导致的.这样的应用往往 ...
- ios 横竖屏通知
屏幕切换时,会发送一个通知.只要注册一个通知: [[NSNotificationCenter defaultCenter] addObserver:self selector:@selector(do ...
- 项目差异class文件提取-->上线用
package fileReader; import java.io.BufferedReader; import java.io.File; import java.io.FileInputStre ...
- cf378C(模拟)
题目链接:http://codeforces.com/contest/733/problem/C 思路:模拟 因为数组b里的元素是顺序对应a数组元素的和,可以开个c数组储存b数组元素对应的a数组元素区 ...
- Java——Cookie与Session
Cookie通过客户端记录信息确定用户身份,Session通过在服务器端记录信息确定用户身份. 1.Cookie 1.1概念及使用方法 Cookie实际上是一小段文本信息.客户端请求服务器,如果服务 ...
- Swift - UIViewController
UIViewController类详解: 通过Nib文件初始化 init(nibName nibName: String?, bundle nibBundle: NSBundle?) println( ...