Echarts横坐标倾斜,顶部显示数字
最近项目使用到Echarts,所以学习了下
根据API,实现Echarts很简单,在这就不多说了,下面就说说项目中碰到的一些需求
1.由于横坐标很多,导致数据不能展示完整,所以需要设置横坐标样式倾斜展示
2.每个数据列(比如柱形图),顶部需要显示具体数值
- <!DOCTYPE html>
- <html lang="en">
- <head>
- <meta charset="utf-8">
- <meta http-equiv="X-UA-Compatible" content="IE=edge">
- <meta name="viewport" content="width=device-width, initial-scale=1.0">
- <meta name="description" content="ECharts">
- <title>Echarts横坐标倾斜,顶部文字显示实现</title>
- <script type="text/javascript" src="http://apps.bdimg.com/libs/jquery/2.1.4/jquery.min.js"></script>
- </head>
- <script type="text/javascript">
- var width;
- var height;
- var myChart;
- $(function(){
- //自适应设置
- width = $(window).width();
- height = $(window).height();
- $("#mainBar").css("width",width-40);
- $("#mainBar").css("height",height-40);
- console.log(height);
- setEcharts();
- });
- $(window).resize(function() {
- width = $(window).width();
- height = $(window).height();
- $("#mainBar").css("width",width-40);
- $("#mainBar").css("height",height-40);
- });
- function setEcharts(){
- myChart = echarts.init(document.getElementById('mainBar'));
- //自适应
- window.onresize = myChart.resize;
- myChart.setOption({
- tooltip : {
- trigger: 'axis'
- },
- legend: {
- data:['蒸发量','降水量']
- },
- toolbox: {
- show : true,
- feature : {
- mark : {show: true},
- dataView : {show: true, readOnly: false},
- magicType : {show: true, type: ['line', 'bar']},
- restore : {show: true},
- saveAsImage : {show: true}
- }
- },
- calculable : true,
- xAxis : [
- {
- type : 'category',
- data : ['1月','2月','3月','4月','5月','6月','7月','8月','9月','10月','11月','12月'],
- //设置字体倾斜
- axisLabel:{
- interval:0,
- rotate:45,//倾斜度 -90 至 90 默认为0
- margin:2,
- textStyle:{
- fontWeight:"bolder",
- color:"#000000"
- }
- },
- }
- ],
- yAxis : [
- {
- type : 'value',
- splitArea : {show : true}
- }
- ],
- series : [
- {
- name:'蒸发量',
- type:'bar',
- data:[2.0, 4.9, 7.0, 23.2, 25.6, 76.7, 135.6, 162.2, 32.6, 20.0, 6.4, 3.3]
- },
- {
- name:'降水量',
- type:'bar',
- data:[2.6, 5.9, 9.0, 26.4, 28.7, 70.7, 175.6, 182.2, 48.7, 18.8, 6.0, 2.3],
- //顶部数字展示pzr
- itemStyle: {
- normal: {
- label: {
- show: true,//是否展示
- textStyle: {
- fontWeight:'bolder',
- fontSize : '12',
- fontFamily : '微软雅黑',
- }
- }
- }
- },
- }
- ]
- });
- }
- </script>
- <body>
- <div id="mainBar" style="border:1px solid #ccc;padding:10px;"></div>
- <!-- 标签式引入Eharts 如果你把引用echarts的script标签放置head内在IE8-的浏览器中会出现报错,解决的办法就是把标签移动到body内(后)。 -->
- <script type="text/javascript" src="http://apps.bdimg.com/libs/echarts/2.1.9/source/echarts-all.js"></script>
- <script>
- </script>
- </body>
- </html>
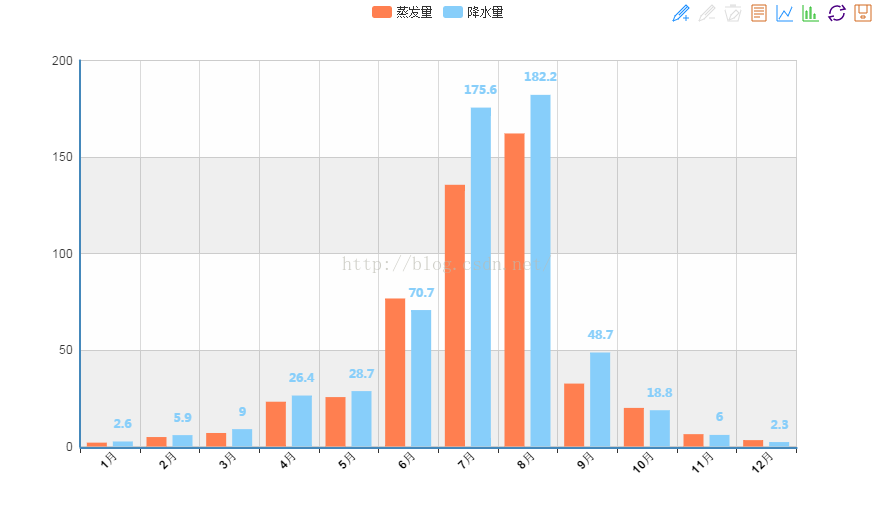
效果图如下:
还有一个地方可以看到效果图,很不错的一个网站
Echarts横坐标倾斜,顶部显示数字的更多相关文章
- [置顶]
echarts x轴文字显示不全(xAxis文字倾斜比较全面的3种做法值得推荐)
echarts x轴标签文字过多导致显示不全 如图: 解决办法1:xAxis.axisLabel 属性 axisLabel的类型是object ,主要作用是:坐标轴刻度标签的相关设置.(当然yAxis ...
- echarts x轴文字显示不全解决办法
标题:echarts x轴文字显示不全(xAxis文字倾斜比较全面的3种做法值得推荐):http://blog.csdn.net/kebi007/article/details/68488694
- [收集]在iPhone桌面的应用程序图标右上角显示数字
能够在ios桌面的程序icon右上角显示数字(badge number)的方法 在ViewController中的viewDidLoad方法中添加如下代码即可 - (void)viewDidLoad ...
- HTML5效果:Canvas 实现圆形进度条并显示数字百分比
实现效果 1.首先创建html代码 <canvas id="canvas" width="500" height="500" styl ...
- flex学习笔记 显示数字步进
<?xml version="1.0" encoding="utf-8"?> <s:Application xmlns:fx="ht ...
- echarts隐藏之后的显示问题
好久没有更新博客了,今天搞了快一天的网页自适应,头晕...因为最近开始做项目,项目中需要用到图表方面的知识,于是乎接触到了echarts,所以其实我也算是新手了.只是近几天弄了很久的关于图表隐藏之后再 ...
- 【jQuery】页面顶部显示的进度条效果
<!Doctype html> <html> <head> <title>页面顶部显示的进度条效果</title> <meta htt ...
- 快速创建显示数字数据的动画——CountUp.js
由于项目需求,需要写一个数字增/减量的动画特效,最后找到了CountUp.js CountUp.js是一个无依赖,轻量级的JavaScript“类”,可用于快速创建以更有趣的方式显示数字数据的动画. ...
- 【Excle数据透视表】如何在组的顶部显示分类汇总
调整前 调整后 例 ...
随机推荐
- 采用MQTT协议实现android消息推送(2)MQTT服务端与客户端软件对比、android客户端示列表
1.服务端软件对比 https://github.com/mqtt/mqtt.github.io/wiki/servers 名称(点名进官网) 特性 简介 收费 支持的客户端语言 IBM MQ 完整的 ...
- java se系列(二) 关键字、注释、常量、进制转换、变量、数据类型转换、运算符
1 关键字 1.1 关键字的概述 Java的关键字对java的编译器有特殊的意义,他们用来表示一种数据类型,或者表示程序的结构等,关键字不能用作变量名.方法名.类名.包名. 1.2 常见的关键字 备注 ...
- 踩坑--http返回码之302状态码
项目介绍:springboot+shiro+maven 业务需求:拦截一切不登录的盗链URL,除了问卷调查,可以给任意用户填写和提交意外. 问题重现:表单提交过程中返回302状态码,我就觉得很奇怪.在 ...
- SpringBoot | 第二十八章:监控管理之Spring Boot Admin使用
前言 上一章节,我们介绍了Actuator的使用,知道了可通过访问不同的端点路径,获取相应的监控信息.但使用后也能发现,返回的监控数据都是以JSON串的形式进行返回的,对于实施或者其他人员来说,不是很 ...
- 【VMware&Vritualbox】虚拟机安装windows server2016
一.下载镜像 参考链接:https://blog.csdn.net/yenange/article/details/52981769 http://blog.sina.com.cn/s/blog_10 ...
- 简单springboot及springboot cloud环境搭建
springboot使用特定的方式,简化了spring的各种xml配置文件,并通过maven或者gradle,完成所需依赖,使用springboot maven插件,可直接输出可运行的jar包,省去了 ...
- bootstrap fileinput+MVC 上传多文件,保存
新增用户资料,需要用户上传多笔附件,所以就尝试用了fileinput控件,显示效果如图: 首先,先在model中定义数据模型: public partial class create { [Requi ...
- SSO单点登录三种情况的实现方式详解(转)
https://blog.csdn.net/ainuser/article/details/65631713
- scss-@extend
@extend指令用于共享规则和选择器之间的关系.它可以扩展所有其他类的样式在一个类中,也可应用于自己特定的样式. 查看如下scss@extend示例: .style{ font-size: 30px ...
- 如何修改Vue打包后文件的接口地址配置
1.背景 常规的vue项目分为本地环境和生产环境,我们只要对 config 文件夹下的 dev.env.js 和 prod.env.js 做相应的配置即可.但是最近在做的项目中,涉及到私有化部署,就是 ...