Investigating issues with Unmanaged Memory. First steps. (转载)
原文:http://kate-butenko.blogspot.tw/2012/07/investigating-issues-with-unmanaged.html
I want to write this blogpost really fast, until I forget everything, despite I have absolutely no time and need to work on other cases :( Let's count this as part of my work, okay?
Prologue.
You can scroll it down to scene 1, if you want to concentrate on concrete steps.
This case had a long story - starting from OOM troubles on 32-bit process, when process 32-bit mode was considered as main boundary for a large solution. BTW, my troubles with opening dumps at that point resulted in this blog post, if you remember it.
After switching to 64bit solution was running smoothly for some time, we even closed the support case. Suddenly (oh, I love this word!) our poor process had eaten 66Gb of memory, which is unbelievably huge. Actually, it was all of the memory available - 16Gb of RAM and 50Gb of page file.
Customer managed to gather a dump when process memory usage was at something like 6Gb. I was almost sure, that issue solution is struggling because of was this bad guy - Lucene analyzer. Luckily, we have script that counts all related to this issue data structures (and also counts cache sizes), so I thought that I will just run this script on the dump and confirm my assumptions.
I was a bit shocked when script has shown only 140Mb of Lucene-related things in memory. Cache sizes were in healthy range. So this is something new. I loaded our good old friend WinDBG and started analyzing memory as usually.
Scene 1.
1. !dumpheap -stat. One suspicious thing that I noticed in the dumpheap was that largest memory eater was not that large:

Approximate size of strings is ~775mb, and a lot of Free objects were telling me that a lot of memory is not compacted. Other objects are related to different Sitecore caches.
But what even 1.7Gb means against having a ~5.8Gb dump? That was a question.
2.!address -summary. This command will output all memory usage for the process. Managed, unmanaged, commited, available virtual memory - whatever you can imagine:

Ok, that's a bit better. At least I can see that there is ~5.5Gb of committed memory (MEM_COMMIT), which corresponds approximately to process' Private Bytes, so size of dump is not coming from nowhere. But from somewhere.
3. !eeheap -gc. This nice command shows us all our managed heaps one by one, and for each heap shows its Small object heap and Large object heap addresses and sizes.

That's what I was interested in - total size of managed memory heap. Sadly, it says that GC heap is only 2Gb it size - the same that we may assume from !dumpheap results. If it was not this case, we can take more from output of !eeheap -gc, for example search for largest LOH, take a look at sizes of generations in GC and possibly derive something useful.
But commited memory 5.5Gb against 2Gb of GC managed memory shows us that we face this scary unmanaged memory thing. Oh no :(
I searched through ton of sites looking for concrete steps of debugging such issues in WinDBG. Steps below are currently the one and only scenario, that worked for me. I'm sure that there are much more possible ways of solving, but we are not able to know everything in this world, aren't we?
Scene 2.
So later in this article we are investigating our native heaps. Native means unmanaged - our GC has nothing to do with native memory, it will never be collected or compacted until application is closed and everything that belongs to it is freed.
4. !heap -s

Let's look at the native heaps. One of the heaps takes ~3Gb. So this is the place where most part of our lost memory goes! Remember this heap number 12240000. We'll see it again later.
Now let's take a closer look at the structure of native heaps, using following command:
5. !heap -stat -h 0

Among all allocation statistic information for all heaps find the ones that are the most exhausted. It means that most of total busy bytes is close to 100. In my dump I had several such heaps, but most of them aren't causing problems, according to results of step 4. This 12240000 is under big question now.
From the output above we can also see that all this heap is filled with blocks of equal size - 7c10. Next command will allow us filter heaps to find blocks of this only size.
6. !heap -flt s 7c10

Good explanation of each of the columns: http://stackoverflow.com/questions/6687414/what-do-the-different-columns-in-the-heap-flt-s-xxxx-windbg-command-represe
Now be careful. Most of the sites and guides on the Internet will now offer you to go through UserPtrs and look at the stacks that are pointing to this UserPtrs. For example, this one: http://windbg.info/doc/1-common-cmds.html#20_memory_heap, scroll down to "Finding memory leaks", steps 5-8. I recognize that this scenario may be useful sometimes, but nobody says that in 90% of cases stacks are not present there :)
First my thought was that I have nothing else to admit except of the fact that I'm stuck here. Searching for anything related leaded me to the steps like in article above, but this scenario was of no use. I even asked my other experienced colleagues and US support about any ideas, but seems that nobody have ever seen this before.
Occasionaly, while hopelessly searching for just general information on native memory leaks, I bumped into a simple blog post http://www.manicai.net/comp/debugging/oom/. Man, I should give you all the credit for this post, as you saved my head from explosion.
Frankly saying, I wasn't able to repeat all the steps from the blog above, but even the beginning has given me a chance to find out what is wrong.
7. dc 00000000122412e0 L 2000
Address is taken as the first HEAP_ENTRY from previous screenshot - address of first block of that size. "dc" command display us raw memory in double word bytes and ASCII characters corresponding to them. L 2000 means that we will take 2000 of these double words.
We will get a large output, scroll over it and find interesting places, if you have them:
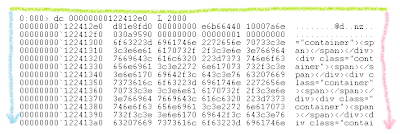 |
| beginning of the "dc" output |
Cool. There is definitely some repeating string, like <div class="container"><span></span></div>... and this string is being repeated forever.
 |
| somewhere in the middle of the "dc" output |
Another eye-catching place. Among all these repeating spans some piece of the content is jumping into: Fredagsklumme-Faellesskab-og-ho... and some styling before this content.
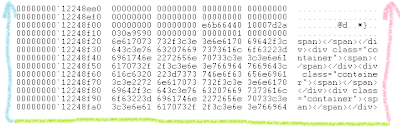 |
| end of dots-range in "dc"-output |
Then our content piece is followed by a lot of dots and ends up with all this div-span thing again.
Actually, it was the brilliant moment - find some meaningful strings in all this garbage-looking native heap.
My next step was just to ask customer about nature of this string, and he has successfully found something similar in their XSLT files and found related content in one of the Sitecore fields. Most of all, this memory leak was caused by incorrect parsing some content markup by this xslt.
Epilogue.
...and the moral of this story:
Guys, please keep posting! Especially about the things that are not that obvious and that you spent a lot of time on.

Investigating issues with Unmanaged Memory. First steps. (转载)的更多相关文章
- Investigating Your RAM Usage
转载自:http://developer.android.com/intl/zh-cn/tools/debugging/debugging-memory.html Because Android is ...
- [转]Passing Managed Structures With Strings To Unmanaged Code Part 1
1. Introduction. 1.1 Managed structures that contain strings are a common sight. The trouble is that ...
- SAP NOTE 1999997 - FAQ: SAP HANA Memory
Symptom You have questions related to the SAP HANA memory. You experience a high memory utilization ...
- NET Memory Profiler 跟踪.net 应用内存
NET Memory Profiler 跟踪.net 应用内存 用 .NET Memory Profiler 跟踪.net 应用内存使用情况--基本应用篇 作者:肖波 .net 框架号称永远 ...
- 还是说Memory Model,gcc的__sync_synchronize真是太坑爹了
还是说Memory Model,gcc的__sync_synchronize真是太坑爹了! 时间 2012-01-29 03:18:35 IT牛人博客聚合网站 原文 http://www.udpw ...
- 用 .NET Memory Profiler 跟踪.net 应用内存使用情况--基本应用篇(转)
.net 框架号称永远不会发生内存泄漏,原因是其引入了内存回收的机制.但实际应用中,往往我们分配了对象但没有释放指向该对象的引用,导致对象永远无法释放.最 常见的情况就是给对象添加了事件处理函数,但当 ...
- The Dangers of the Large Object Heap(转载,LOH内存碎片情景重现)
原文地址:https://www.simple-talk.com/dotnet/.net-framework/the-dangers-of-the-large-object-heap/ You'd h ...
- [转]Passing Managed Structures With Strings To Unmanaged Code Part 3
1. Introduction. 1.1 In part 1 of this series of blogs we studied how to pass a managed structure (w ...
- [转]Passing Managed Structures With Strings To Unmanaged Code Part 2
1. Introduction. 1.1 In part 1 of this series of blogs we studied how to pass a managed structure (w ...
随机推荐
- Multimap的初使用
之前不知道这个类型使用,在朋友的推荐下进行了个实际操作. 类似这种查询,我需要将他们归类拿出来,如果招以前那么拿的话可能要套挺多个循环的. 首先根据查询得到一个 List<Map<Stri ...
- 190310HTML&CSS&JS
一.HTML 1.web server import socket def handle_request(client): buf = client.recv(1024) client.send(by ...
- SDUT OJ 图结构练习——最短路径 ( Floyed 算法 AND Dijkstra算法)
图结构练习——最短路径 Time Limit: 1000 ms Memory Limit: 65536 KiB Submit Statistic Discuss Problem ...
- HTML中title前面小图标的实现
做一个比较正规的网站,需要在标题栏前面加上相应的小图标,会好看的多.效果大致如下: 其实实现起来很简单,只要在html文件中的<head></head>标签中加上: <l ...
- c语言和c++的相互调用
1.c与c++编译方式 (1)gcc和g++都可以编译.c文件,也都可以编译.cpp文件.g++和gcc是通过后缀名来辨别是c程序还是c++程序的(这一点与Linux辨别文件的方式不同,Linux是通 ...
- 洛谷 P1546 最短网络 Agri-Net(最小生成树)
嗯... 题目链接:https://www.luogu.org/problemnew/show/P1546 首先不难看出这道题的思想是用了最小生成树,但是这道题有难点: 1.读题读不明白 2.不会读入 ...
- 说说Cookie和Session(会话)的区别?
1.Cookie 通俗讲,是访问某些网站后在本地存储的一些网站相关信息,下次访问时减少一些步骤.更准确的说法是:Cookies是服务器在本地机器上存储的小段文本并随每一个请求发送至同一服务器,是在客户 ...
- python-继承,父类,子类
class Spell(object): def __init__(self, incantation, name): self.name = name self.incantation = inca ...
- hdu3068 最长回文 马拉车模板题
题目传送门 马拉车算法模板题. 学习博客 #include<bits/stdc++.h> #define clr(a,b) memset(a,b,sizeof(a)) using name ...
- BZOJ - 3489 KD树 范围计数 空间思维转换
题意:给定数列\(a[1...n]\),\(Q\)次查询\([L,R]\)中只出现一次的最大值 这道题的做法比较劲.. 对每个元素构造三维空间的点\((i,pre[i],next[i])\),查询\( ...