
Open Sourcing Kafka Monitor
https://engineering.linkedin.com/blog/2016/05/open-sourcing-kafka-monitor
https://github.com/linkedin/kafka-monitor
https://github.com/Microsoft/Availability-Monitor-for-Kafka
Design Overview
Kafka Monitor makes it easy to develop and execute long-running Kafka-specific system tests in real clusters and to monitor existing Kafka deployment's SLAs provided by users.
Developers can create new tests by composing reusable modules to emulate various scenarios (e.g. GC pauses, broker hard-kills, rolling bounces, disk failures, etc.) and collect metrics; users can run Kafka Monitor tests that execute these scenarios at a user-defined schedule on a test cluster or production cluster and validate that Kafka still functions as expected in these scenarios. Kafka Monitor is modeled as manager for a collection of tests and services in order to achieve these goals.
A given Kafka Monitor instance runs in a single Java process and can spawn multiple tests/services in the same process. The diagram below demonstrates the relations between service, test and Kafka Monitor instance, as well as how Kafka Monitor interacts with a Kafka cluster and user.
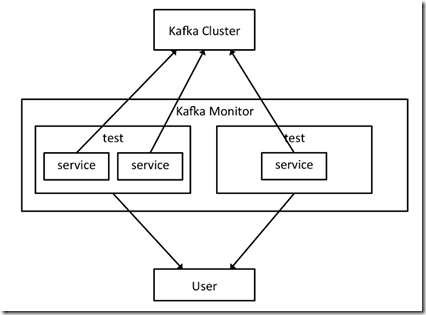
这个平台比较有意思在于,不光是监控那么简单,
还包含完整的test框架,可以定义任意test,test由各种service,即组件,组合而成
- Produce service, which produces messages to Kafka and measures metrics such as produce rate and availability.
- Consume service, which consumes messages from Kafka and measures metrics including message loss rate, message duplicate rate and end-to-end latency. This service depends on the produce service to provide messages that embed a message sequence number and timestamp.
- Broker bounce service, which bounces a given broker at some pre-defined schedule.
用上面的3个services,就可以组合出一个测试broker bounce的test
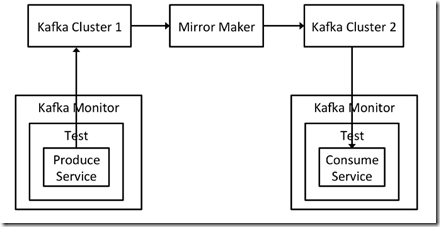
或者上面的case,通过两个kafka monitor,可以测试多datacenter之间的同步
Kafka Monitor Usage at LinkedIn
Monitoring Kafka Cluster Deployments
In early 2016 we deployed Kafka Monitor to monitor availability and end-to-end latency of every Kafka cluster at LinkedIn. This project wiki goes into the details of how these metrics are measured. These basic but critical metrics have been extremely useful to actively monitor the SLAs provided by our Kafka cluster deployment.
Validate Client Libraries Using End-to-End Workflows
As an earlier blog post explains, we have a client library that wraps around the vanilla Apache Kafka producer and consumer to provide various features that are not available in Apache Kafka such as Avro encoding, auditing and support for large messages. We also have a REST client that allows non-Java application to produce and consume from Kafka. It is important to validate the functionality of these client libraries with each new Kafka release. Kafka Monitor allows users to plug in custom client libraries to be used in its end-to-end workflow. We have deployed Kafka Monitor instances that use our wrapper client and REST client in tests, to validate that their performance and functionality meet the requirement for every new release of these client libraries and Apache Kafka.
Certify New Internal Releases of Apache Kafka
We generally run off Apache Kafka trunk and cut a new internal release every quarter or so to pick up new features from Apache Kafka. A significant benefit of running off trunk is that deploying Kafka in LinkedIn’s production cluster has often detected problems in Apache Kafka trunk that can be fixed before official Apache Kafka releases.
Given the risk of running off Apache Kafka trunk, we take extra care to certify every internal release in a test cluster—which accepts traffic mirrored from production cluster(s)—for a few weeks before deploying the new release in production. For example, we do rolling bounces or hard kill brokers, while checking JMX metrics to verify that there is exactly one controller and no offline partitions, in order to validate Kafka’s availability under failover scenarios. In the past, these steps were manual, which is very time-consuming and doesn’t scale well with the number of events and types of scenarios we want to test. We are switching to Kafka Monitor to automate this process and cover more failover scenarios on a continual basis.
Open Sourcing Kafka Monitor的更多相关文章
- 消息中间件选型分析——从Kafka与RabbitMQ的对比来看全局
一.前言 消息队列中间件(简称消息中间件)是指利用高效可靠的消息传递机制进行与平台无关的数据交流,并基于数据通信来进行分布式系统的集成.通过提供消息传递和消息排队模型,它可以在分布式环境下提供应用解耦 ...
- 关于Kafka监控方案的讨论
之前在知乎上尝试过回答这个问题,后来问的人挺多,干脆在博客里面保存一下. 目前Kafka监控方案看似很多,然而并没有一个"大而全"的通用解决方案.各家框架也是各有千秋,以下是我了解 ...
- DataPipeline |《Apache Kafka实战》作者胡夕:Apache Kafka监控与调优
胡夕 <Apache Kafka实战>作者,北航计算机硕士毕业,现任某互金公司计算平台总监,曾就职于IBM.搜狗.微博等公司.国内活跃的Kafka代码贡献者. 前言 虽然目前Apache ...
- Kafka监控工具kafka-monitor v0.1简要介绍
Kafka Monitor为Kafka的可视化管理与监控工具,为Kafka的稳定运维提供高效.可靠.稳定的保障,这里主要简单介绍Kafka Monitor的相关功能与页面的介绍: Kafka Moni ...
- Kafka(3)--kafka消息的存储及Partition副本原理
消息的存储原理: 消息的文件存储机制: 前面我们知道了一个 topic 的多个 partition 在物理磁盘上的保存路径,那么我们再来分析日志的存储方式.通过 [root@localhost ~]# ...
- IM系统的MQ消息中间件选型:Kafka还是RabbitMQ?
1.前言 在IM这种讲究高并发.高消息吞吐的互联网场景下,MQ消息中间件是个很重要的基础设施,它在IM系统的服务端架构中担当消息中转.消息削峰.消息交换异步化等等角色,当然MQ消息中间件的作用远不止于 ...
- 《Apache kafka实战》读书笔记-kafka集群监控工具
<Apache kafka实战>读书笔记-kafka集群监控工具 作者:尹正杰 版权声明:原创作品,谢绝转载!否则将追究法律责任. 如官网所述,Kafka使用基于yammer metric ...
- Kafka监控框架介绍
前段时间在想Kafka怎么监控.怎么知道生产的消息或消费的消费是否有丢失,目前有几个开源的Kafka监控框架这里整理了下,不过这几个框架都有各自的问题侧重点不一样: 1.Kafka Monitor 2 ...
- Kafka设计解析(二十三)关于Kafka监控方案的讨论
转载自 huxihx,原文链接 关于Kafka监控方案的讨论 目前Kafka监控方案看似很多,然而并没有一个“大而全”的通用解决方案.各家框架也是各有千秋,以下是我了解到的一些内容: 一.Kafka ...
随机推荐
- Android API中常用的包(转)
在Android应用开发中,我们一般都是用java语言.所以Android很好的继承了java的功能,不过为了满足手机系统的需要和实现一些新的功能,Android还提供了一些特有的扩展的java功能. ...
- NDK的Paths and Symbols设定
开发NDK的时候,如果JNI文件找不到C和C++的支持类,然后报很多很多红叉号, 是因为没有设定“Paths and Symbol”.
- zookeeper中client命令实践
Welcome to ZooKeeper! 2016-09-14 16:06:04,528 [myid:] - INFO [main-SendThread(master:2181):ClientCnx ...
- 2016.6.23 PHP实现新闻发布系统主体部分
1.新闻发布系统的列表: <html><meta http-equiv="Content-Type" content="text/html; chars ...
- 最短路(Dijkstra) POJ 1062 昂贵的聘礼
题目传送门 /* 最短路:Dijkstra算法,首先依照等级差距枚举“删除”某些点,即used,然后分别从该点出发生成最短路 更新每个点的最短路的最小值 注意:国王的等级不一定是最高的:) */ #i ...
- android 进程什么时候被销毁
http://wear.techbrood.com/guide/components/processes-and-threads.html 每一个 android 应用默认会起一个进程,除非你用 an ...
- Drainage Ditches
Drainage Ditches Time Limit: 2000/1000 MS (Java/Others) Memory Limit: 65536/32768 K (Java/Others) ...
- codevs 1060
题目大意: 有2n张票,分别有A,B两类,求最后两个人拿到同种票的概率.n<=1250; 想想这题应该是组合啊..但是到底是组合还是排列..如果是组合, 概率为:1-两种票都取了n-1张的情况, ...
- C# 使用 GetOleDbSchemaTable 检索架构信息(表、列、主键等)
本文演示如何用 ADO.NET 中 OleDbConnection 对象的 GetOleDbSchemaTable 方法检索数据库架构信息.数据源中的架构信息包括数据库或可通过数据库中的数据源.表和视 ...
- MasterPage 变化了的 ClientID ctl00_
在母版页的服务器端控件 其客户端ID 有时候是多变的 会对javascript jquery的内容获取 造成困扰 比如一个控件: <asp:ContentPlaceHolder ID=" ...