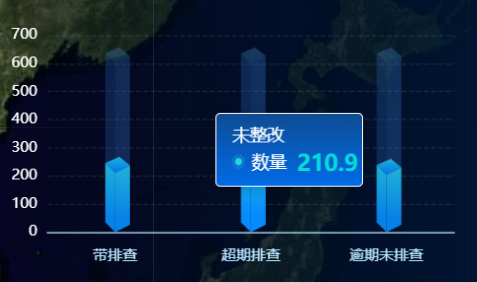
Eharts立体柱状图
一下这三个div大小不一样 为了保证每次柱状图渲染正确 添加key
initEchart(index) {
this.myChart = this.createEchartsInstance(`dangerChart${index}`); // var myChart = echarts.init(chartDom);
this.myChart.clear();
let option;
// 绘制左侧面
const CubeLeft = echarts.graphic.extendShape({
shape: {
x: 0,
y: 0
},
buildPath: function (ctx, shape) {
// 会canvas的应该都能看得懂,shape是从custom传入的
const xAxisPoint = shape.xAxisPoint;
const c0 = [shape.x, shape.y];
const c1 = [shape.x - 8, shape.y - 8];
const c2 = [xAxisPoint[0] - 8, xAxisPoint[1] - 8];
const c3 = [xAxisPoint[0], xAxisPoint[1]];
ctx.moveTo(c0[0], c0[1]).lineTo(c1[0], c1[1]).lineTo(c2[0], c2[1]).lineTo(c3[0], c3[1]).closePath();
}
});
// 绘制右侧面
const CubeRight = echarts.graphic.extendShape({
shape: {
x: 0,
y: 0
},
buildPath: function (ctx, shape) {
const xAxisPoint = shape.xAxisPoint;
const c1 = [shape.x, shape.y];
const c2 = [xAxisPoint[0], xAxisPoint[1]];
const c3 = [xAxisPoint[0] + 12, xAxisPoint[1] - 6];
const c4 = [shape.x + 12, shape.y - 6];
ctx.moveTo(c1[0], c1[1]).lineTo(c2[0], c2[1]).lineTo(c3[0], c3[1]).lineTo(c4[0], c4[1]).closePath();
}
});
// 绘制顶面
const CubeTop = echarts.graphic.extendShape({
shape: {
x: 0,
y: 0
},
buildPath: function (ctx, shape) {
const c1 = [shape.x, shape.y];
const c2 = [shape.x + 12, shape.y - 6];
const c3 = [shape.x + 3.5, shape.y - 13];
const c4 = [shape.x - 8, shape.y - 8];
ctx.moveTo(c1[0], c1[1]).lineTo(c2[0], c2[1]).lineTo(c3[0], c3[1]).lineTo(c4[0], c4[1]).closePath();
}
});
// 注册三个面图形
echarts.graphic.registerShape('CubeLeft', CubeLeft);
echarts.graphic.registerShape('CubeRight', CubeRight);
echarts.graphic.registerShape('CubeTop', CubeTop); const MAX = [600, 600, 600, 600, 600, 600, 600];
const VALUE = [210.9, 260.8, 204.2, 504.9, 440.5, 400.3, 119.0];
option = {
backgroundColor: 'transparent',
tooltip: {
trigger: 'axis',
axisPointer: {
type: 'none'
},
className: 'chartClass',
// eslint-disable-next-line no-unused-vars
formatter: function (params, ticket, callback) {
const item = params[1];
return `<div class="text">未整改 </div>
<div class="fixCount">
<div class="circle"></div>
<div class="count">数量</div>
<div class="num">${item.value}</div>
</div>`;
}
},
grid: {
left: 10,
right: 10,
bottom: 10,
top: 10,
containLabel: true
},
xAxis: {
type: 'category',
data: ['带排查', '超期排查', '逾期未排查'],
axisLine: {
show: true,
lineStyle: {
color: '#BAE7FF'
}
},
offset: 6,
axisTick: {
show: false,
length: 9,
alignWithLabel: true,
lineStyle: {
color: '#7DFFFD'
}
},
axisLabel: {
show: true,
fontSize: 12
}
},
yAxis: {
// min: 0,
// max: 600,
// interval: 200,
type: 'value',
axisLine: {
show: false,
lineStyle: {
color: 'white'
}
},
splitLine: {
show: true,
lineStyle: {
type: 'dashed',
color: 'rgba(255,255,255,0.1)'
}
},
axisTick: {
show: false
},
axisLabel: {
show: true,
fontSize: 12
},
boundaryGap: ['20%', '20%']
},
series: [
{
type: 'custom',
renderItem: function (params, api) {
const location = api.coord([api.value(0), api.value(1)]);
return {
type: 'group',
children: [
{
type: 'CubeLeft',
shape: {
api,
x: location[0],
y: location[1],
xAxisPoint: api.coord([api.value(0), 0])
},
style: {
fill: 'rgba(47,102,192,.27)'
}
},
{
type: 'CubeRight',
shape: {
api,
x: location[0],
y: location[1],
xAxisPoint: api.coord([api.value(0), 0])
},
style: {
fill: 'rgba(59,128,226,.27)'
}
},
{
type: 'CubeTop',
shape: {
api,
x: location[0],
y: location[1],
xAxisPoint: api.coord([api.value(0), 0])
},
style: {
fill: 'rgba(72,156,221,.27)'
}
}
]
};
},
data: MAX
},
{
type: 'custom',
renderItem: (params, api) => {
const location = api.coord([api.value(0), api.value(1)]);
var color =
api.value(1) > 600
? 'red'
: new echarts.graphic.LinearGradient(0, 0, 0, 1, [
{
offset: 0,
color: '#20B0D6'
},
{
offset: 0.8,
color: '#0681E7'
}
]);
return {
type: 'group',
children: [
{
type: 'CubeLeft',
shape: {
api,
xValue: api.value(0),
yValue: api.value(1),
x: location[0],
y: location[1],
xAxisPoint: api.coord([api.value(0), 0])
},
style: {
fill: color
}
},
{
type: 'CubeRight',
shape: {
api,
xValue: api.value(0),
yValue: api.value(1),
x: location[0],
y: location[1],
xAxisPoint: api.coord([api.value(0), 0])
},
style: {
fill: color
}
},
{
type: 'CubeTop',
shape: {
api,
xValue: api.value(0),
yValue: api.value(1),
x: location[0],
y: location[1],
xAxisPoint: api.coord([api.value(0), 0])
},
style: {
fill: color
}
}
]
};
}, data: VALUE
},
{
type: 'bar',
label: {
normal: {
show: false,
position: 'top',
fontSize: 12,
color: '#fff',
offset: [2, -20]
}
},
itemStyle: {
color: 'transparent'
},
tooltip: {},
data: MAX
}
]
};
option && this.myChart.setOption(option, true);
}
Eharts立体柱状图的更多相关文章
- eccharts-gl 3D立体柱状图
echarts-gl继承于echarts echarts-gl官方实例https://echarts.baidu.com/examples/index.html#chart-type-globe 代码 ...
- Echarts 圆形立体柱状图
先放个效果图 const resData = [ { label: "上海", value: 66 }, { label: "北京", value: 26 }, ...
- MATLAB之折线图、柱状图、饼图以及常用绘图技巧
MATLAB之折线图.柱状图.饼图以及常用绘图技巧 一.折线图 参考代码: %图1:各模式直接成本预测 %table0-table1为1*9的数组,记录关键数据 table0 = data_modol ...
- echarts-gl 3D柱状图保存为图片,打印
echarts-gl生成的立体柱状图生成图片是平面的,但是需求是3D图并且可以打印,我们的思路是先转成图片,然后再打印,代码如下: 生成3D图 <td>图表分析</td> &l ...
- 【Java EE 学习 74 下】【数据采集系统第六天】【使用Jfreechart的统计图实现】【将JFreechart整合到项目中】
之前说了JFreechart的基本使用方法,包括生成饼图.柱状统计图和折线统计图的方法.现在需要将其整合到数据采集系统中根据调查结果生成三种不同的统计图. 一.统计模型的分析和设计 实现统计图显示的流 ...
- 一秒钟教会你如何 使用jfreechart制作图表,扇形图,柱形图,线型图,时序图,附上详细代码,直接看效果
今天有小伙伴问到我怎么使用jfreeChat生成图标,去年就有一个这方便的的总结,今天再遇到,就总结出来,供大家参考: 第一个: 创建柱状图,效果图如下: 柱状图代码如下: package cn.xf ...
- Baidu图表插件--Eharts使用(柱状图)
官网链接:http://echarts.baidu.com/index.html 官网的demo,api都很详细:我就分享下我的学习步骤 首先定义一个显示图标的区域: <div id=" ...
- PHP实现动态生成饼状图、柱状图和折线图(转载)
PHP在图像操作方面的表现非常出色,我们只需借助可以免费得到的GD库便可以轻松实现图.表勾画.下面将分别介绍PHP实现的饼状图.折线图和柱状图以 及他们的使用方法,这几段代码的特点就是不需要再把它们复 ...
- WPF用SkewTransform画3D柱状图
WPF用SkewTransform画3D柱状图 SkewTransform主要是对控件实现一种2-D扭曲,具体内容可以查看以下链接: http://msdn.microsoft.com/zh-cn/l ...
- 空间数据可视化:1. 3D_Bar图表| 空间柱状图
1.Sublime的使用 中文版的配置 https://jingyan.baidu.com/article/ca2d939d1e83feeb6c31cefc.html (百度经验) sublime里边 ...
随机推荐
- [转帖]Redis核心技术与实战
https://www.cnblogs.com/strick/p/14851429.html 最近在读一篇关于Redis的专栏,叫做<Redis核心技术与实战>,作者在Redis方面研究颇 ...
- [转帖]Python基础之函数(四)
https://www.jianshu.com/p/168e341fb81c 一.函数定义 函数是组织好的,可重复使用的,用来实现单一,或相关联功能的代码段:比如常用的print(),就是内建函数:通 ...
- [转帖]ubuntu下配置iptables、ufw端口转发
iptables 端口转发(CentOS) 注意:一来一去 在中转服务器操作 iptables -t nat -A PREROUTING -p tcp --dport [端口号] -j DNAT -- ...
- PMC相关RAID卡信息查看方法
PMC相关RAID卡信息查看方法 摘要 昨天简单整理了LSI相关设备的信息 今天计划学习下PMC相关的RAID卡信息. 也就是偶昨天storcli 查看 controller为0 的情况. 感觉部分服 ...
- 【JS 逆向百例】网洛者反爬练习平台第二题:JJEncode 加密
关注微信公众号:K哥爬虫,持续分享爬虫进阶.JS/安卓逆向等技术干货! 声明 本文章中所有内容仅供学习交流,抓包内容.敏感网址.数据接口均已做脱敏处理,严禁用于商业用途和非法用途,否则由此产生的一切后 ...
- 爬虫逆向基础,认识 SM1-SM9、ZUC 国密算法
关注微信公众号:K哥爬虫,QQ交流群:808574309,持续分享爬虫进阶.JS/安卓逆向等技术干货! [01x00] 简介 国密即国家密码局认定的国产加密算法,爬虫工程师在做 JS 逆向的时候,会遇 ...
- 用户 'NT Service\SSISScaleOutMaster140' 登录失败
用户 'NT Service\SSISScaleOutMaster140' 登录失败. 原因: 找不到与提供的名称匹配的登录名. 项目情况: 用户 'NT Service\SSISScaleOutMa ...
- LeetCode贪心算法习题讲解
实验室的算法课程,今天轮到我给师弟师妹们讲贪心算法,顺便也复习一下. 贪心算法这个名字听起来唬人,其实通常是比较简单的.虽然通常贪心算法的实现非常容易,但是,一个问题是否能够使用贪心算法,是一定要小心 ...
- 领域知识图谱-中式菜谱知识图谱:实现知识图谱可视化和知识库智能问答系统(KBQA)
领域知识图谱-中式菜谱知识图谱:实现知识图谱可视化和知识库智能问答系统(KBQA) A knowledge graph for Chinese cookbook(中式菜谱知识图谱),可以实现知识图谱可 ...
- LeetCode刷题日记 2020/8/23
题目描述 给定范围 [m, n],其中 0 <= m <= n <= 2147483647,返回此范围内所有数字的按位与(包含 m, n 两端点). 示例 1: 输入: [5,7] ...