Filebeat快速入门
Filebeat快速入门
本笔记整理于https://www.elastic.co/guide/en/beats/filebeat/current/filebeat-installation.html,仅做个人学习总结使用。
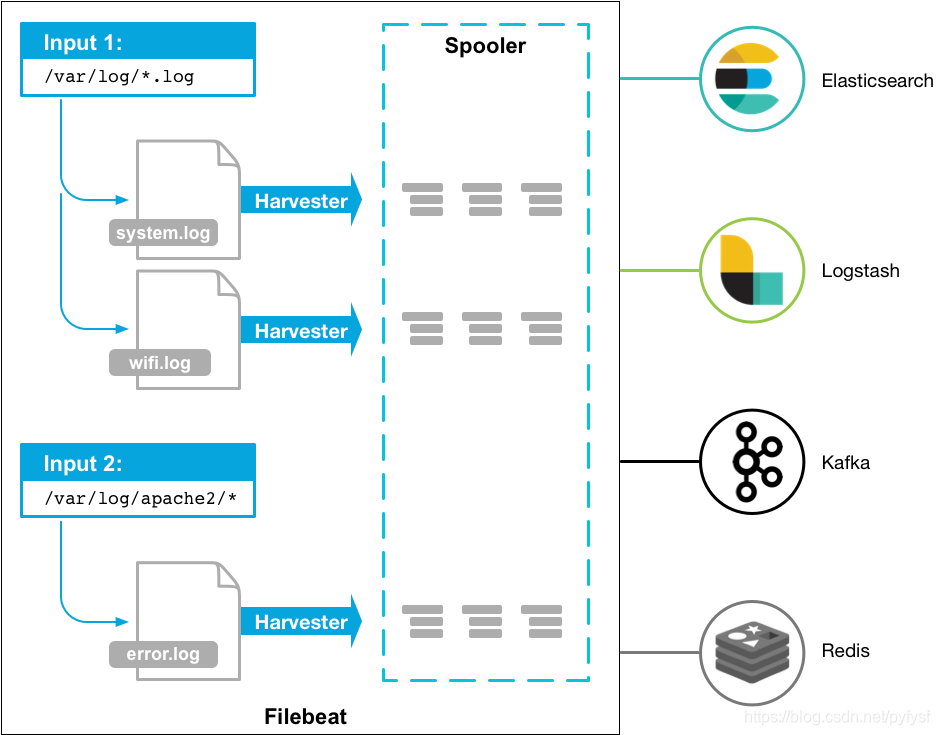
Filebeat是轻量级日志采集工具,经常与ELK搭配使用,作为数据采集源头使用。
filebeat使用示意图
安装部署
Centos7(作者使用)
由于下载太慢了,所以我这里保存了一个下载好的版本(filebeat-6.3.2-linux-x86_64.tar),如果使用请自取:https://quqi.gblhgk.com/s/1727102/vafFOSOsw5AXKP3d
上传到服务器,解压即可
deb(未尝试):
    curl -L -O https://artifacts.elastic.co/downloads/beats/filebeat/filebeat-7.6.1-amd64.deb

    sudo dpkg -i filebeat-7.6.1-amd64.deb
rpm(未尝试):
curl -L -O https://artifacts.elastic.co/downloads/beats/filebeat/filebeat-7.6.1-x86_64.rpm

sudo rpm -vi filebeat-7.6.1-x86_64.rpm
mac(未尝试):
curl -L -O https://artifacts.elastic.co/downloads/beats/filebeat/filebeat-7.6.1-darwin-x86_64.tar.gz

tar xzvf filebeat-7.6.1-darwin-x86_64.tar.gz
linux(未尝试):
curl -L -O https://artifacts.elastic.co/downloads/beats/filebeat/filebeat-7.6.1-linux-x86_64.tar.gz

tar xzvf filebeat-7.6.1-linux-x86_64.tar.gz
Windows(未尝试):
下载 https://download.elastic.co/beats/filebeat/filebeat-5.0.0-windows.zip
解压到 C:\Program Files
重命名 filebeat-5.0.0-windows 目录为 Filebeat
右键点击 PowerSHell 图标,选择『以管理员身份运行』
运行下列命令,将 Filebeat 安装成 windows 服务:
    PS > cd 'C:\Program Files\Filebeat'

    PS C:\Program Files\Filebeat> .\install-service-filebeat.ps1
注意
可能需要额外授予执行权限。命令为:PowerShell.exe -ExecutionPolicy RemoteSigned -File .\install-service-filebeat.ps1
快速使用
作者环境:centos7、JDK8、filebeat-6.3.2、logstash-6.5.1
filebeat.yml配置
修改filebeat.yml配置文件,主要修改节点【filebeat.inputs、 paths、 include_lines、name、(output.logstash)】
按需修改,我这里配置filebeat需要监听【 /shaofei/logs】文件夹下后缀为[.log]的文件,监听的关键字是【'Exception','用户登录异常'】,
注意: 如果需要监听中文,需要保证文件编码为UTF-8。或者使用【encoding】指定所监听的文件编码
我配置了name: 为"study128",我这里使用Logstash作为它的输出端【 Logstash output 】,即使没有接收端来接收filebeat输出的日志也不会影响filebeat的启动
修改配置文件的时候一定要注意yml的格式
###################### Filebeat Configuration Example #########################

# This file is an example configuration file highlighting only the most common

# options. The filebeat.reference.yml file from the same directory contains all the

# supported options with more comments. You can use it as a reference.

#

# You can find the full configuration reference here:

# https://www.elastic.co/guide/en/beats/filebeat/index.html

# For more available modules and options, please see the filebeat.reference.yml sample

# configuration file.

#=========================== Filebeat inputs =============================

filebeat.inputs:

# Each - is an input. Most options can be set at the input level, so

# you can use different inputs for various configurations.

# Below are the input specific configurations.

- type: log

  # Change to true to enable this input configuration.

  enabled: true

  # Paths that should be crawled and fetched. Glob based paths.

  paths:

    - /filebeat/testlogs/input/*.log

  include_lines: ['Exception','用户登录异常']

    #- c:\programdata\elasticsearch\logs\*

  #encoding: gbk

  # Exclude lines. A list of regular expressions to match. It drops the lines that are

  # matching any regular expression from the list.

  #exclude_lines: ['^DBG']

  # Include lines. A list of regular expressions to match. It exports the lines that are

  # matching any regular expression from the list.

  #include_lines: ['^ERR', '^WARN']

  # Exclude files. A list of regular expressions to match. Filebeat drops the files that

  # are matching any regular expression from the list. By default, no files are dropped.

  #exclude_files: ['.gz$']

  # Optional additional fields. These fields can be freely picked

  # to add additional information to the crawled log files for filtering

  #fields:

  #  level: debug

  #  review: 1

  ### Multiline options

  # Mutiline can be used for log messages spanning multiple lines. This is common

  # for Java Stack Traces or C-Line Continuation

  # The regexp Pattern that has to be matched. The example pattern matches all lines starting with [

  #multiline.pattern: ^\[

  # Defines if the pattern set under pattern should be negated or not. Default is false.

  #multiline.negate: false

  # Match can be set to "after" or "before". It is used to define if lines should be append to a pattern

  # that was (not) matched before or after or as long as a pattern is not matched based on negate.

  # Note: After is the equivalent to previous and before is the equivalent to to next in Logstash

  #multiline.match: after

multiline:

 tail_files: true

#============================= Filebeat modules ===============================

filebeat.config.modules:

  # Glob pattern for configuration loading

  path: ${path.config}/modules.d/*.yml

  # Set to true to enable config reloading

  reload.enabled: false

  # Period on which files under path should be checked for changes

  #reload.period: 10s

#==================== Elasticsearch template setting ==========================

#setup.template.settings:

  #index.number_of_shards: 3

  #index.codec: best_compression

  #_source.enabled: false

#================================ General =====================================

# The name of the shipper that publishes the network data. It can be used to group

# all the transactions sent by a single shipper in the web interface.

name: "study128"

# The tags of the shipper are included in their own field with each

# transaction published.

#tags: ["service-X", "web-tier"]

# Optional fields that you can specify to add additional information to the

# output.

#fields:

#  env: staging

#============================== Dashboards =====================================

# These settings control loading the sample dashboards to the Kibana index. Loading

# the dashboards is disabled by default and can be enabled either by setting the

# options here, or by using the `-setup` CLI flag or the `setup` command.

#setup.dashboards.enabled: false

# The URL from where to download the dashboards archive. By default this URL

# has a value which is computed based on the Beat name and version. For released

# versions, this URL points to the dashboard archive on the artifacts.elastic.co

# website.

#setup.dashboards.url:

#============================== Kibana =====================================

# Starting with Beats version 6.0.0, the dashboards are loaded via the Kibana API.

# This requires a Kibana endpoint configuration.

#setup.kibana:

  # Kibana Host

  # Scheme and port can be left out and will be set to the default (http and 5601)

  # In case you specify and additional path, the scheme is required: http://localhost:5601/path

  # IPv6 addresses should always be defined as: https://[2001:db8::1]:5601

  #host: "localhost:5601"

#============================= Elastic Cloud ==================================

# These settings simplify using filebeat with the Elastic Cloud (https://cloud.elastic.co/).

# The cloud.id setting overwrites the `output.elasticsearch.hosts` and

# `setup.kibana.host` options.

# You can find the `cloud.id` in the Elastic Cloud web UI.

#cloud.id:

# The cloud.auth setting overwrites the `output.elasticsearch.username` and

# `output.elasticsearch.password` settings. The format is `<user>:<pass>`.

#cloud.auth:

#================================ Outputs =====================================

# Configure what output to use when sending the data collected by the beat.

#-------------------------- Elasticsearch output ------------------------------

#output.elasticsearch:

  # Array of hosts to connect to.

  #hosts: ["localhost:9200"]

  # Optional protocol and basic auth credentials.

  #protocol: "https"

  #username: "elastic"

  #password: "changeme"

#----------------------------- Logstash output --------------------------------

output.logstash:

  # The Logstash hosts

  hosts: ["127.0.0.1:10515"]

  # Optional SSL. By default is off.

  # List of root certificates for HTTPS server verifications

  #ssl.certificate_authorities: ["/etc/pki/root/ca.pem"]

  # Certificate for SSL client authentication

  #ssl.certificate: "/etc/pki/client/cert.pem"

  # Client Certificate Key

  #ssl.key: "/etc/pki/client/cert.key"

#================================ Logging =====================================

# Sets log level. The default log level is info.

# Available log levels are: error, warning, info, debug

#logging.level: debug

# At debug level, you can selectively enable logging only for some components.

# To enable all selectors use ["*"]. Examples of other selectors are "beat",

# "publish", "service".

#logging.selectors: ["*"]

#============================== Xpack Monitoring ===============================

# filebeat can export internal metrics to a central Elasticsearch monitoring

# cluster.  This requires xpack monitoring to be enabled in Elasticsearch.  The

# reporting is disabled by default.

# Set to true to enable the monitoring reporter.

#xpack.monitoring.enabled: false

# Uncomment to send the metrics to Elasticsearch. Most settings from the

# Elasticsearch output are accepted here as well. Any setting that is not set is

# automatically inherited from the Elasticsearch output configuration, so if you

# have the Elasticsearch output configured, you can simply uncomment the

# following line.

#xpack.monitoring.elasticsearch:

#scan_frequency: 30s

#----------------------------- kafka output --------------------------------

#output.kafka:

#  enabled: true

#  hosts: ["132.228.248.201:9092","132.228.248.202:9092","132.228.248.203:9092"]

#  topic: ETE_CBA_ZZQS_LOG_ERROR

#  version: 0.10.0.1
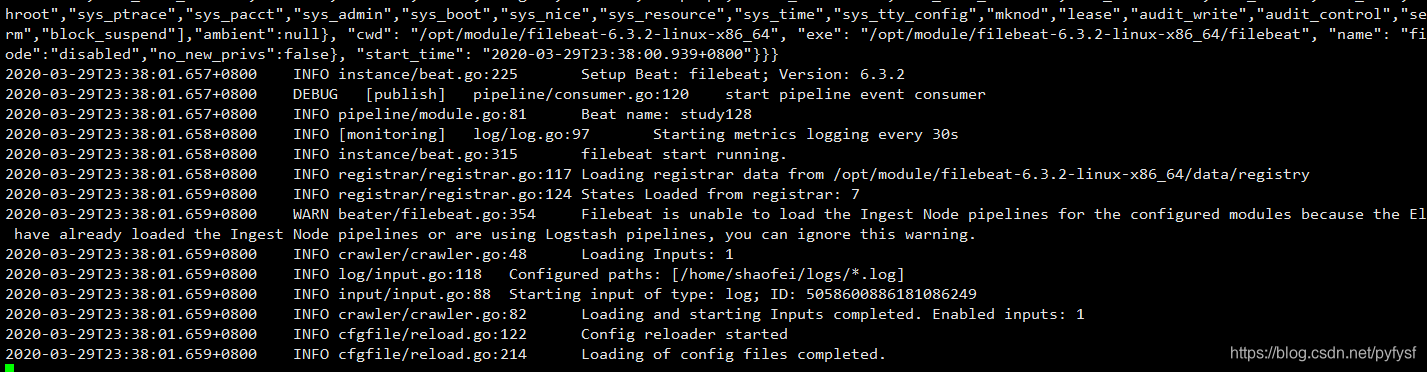
启动filebeat
./filebeat -e -c filebeat.yml -d "publish"
由于filebeat.yml启动会报错,执行修改filebeat.yml的权限(使用其建议的命令即可)

启动成功
注意: 要保证filebeat.yml配置的采集路径是有读取权限的!
测试采集是否成功
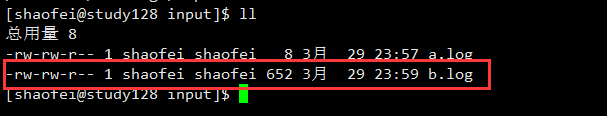
- 在指定目录下创建测试日志
echo "

    2020-03-27 16:51:25,422 ERROR com.quxuecx.Start ->net.sf.json.JSONException: JSONObject["matchID"] not found.

    2020-03-27 16:51:25,422 ERROR com.quxuecx.Start ->net.sf.json.JSONException: JSONObject["matchID"] not found.

    2020-03-27 16:51:25,422 ERROR com.quxuecx.Start ->net.sf.json.JSONException: JSONObject["matchID"] not found.

">>b.log
- 成功
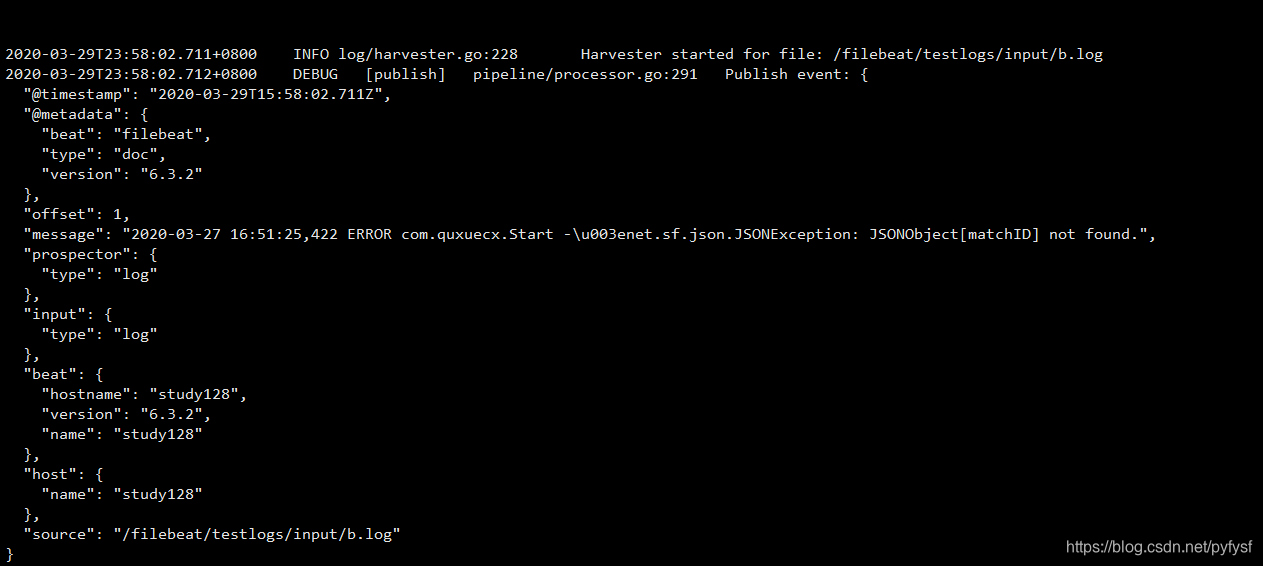
注意: 如果没有看到上述采集成功的图片,请仔细检查filebeat.yml配置文件以及所监听路径和文件的权限是否可以读取。
注意: 文件的内容,必须为log日志格式以及包括你所监听的关键字,请注意。
对接logstash测试
特别注意: filebeat.yml中配置的output.logstash: hosts: ["127.0.0.1:10515"]其中10515这个端口要和logstash配置文件中input filebeat的端口一致。
logstash的概述请查看>> https://blog.csdn.net/pyfysf/article/details/100942174
logstash的配置文件log_error.conf
input {

    # 配置filebeat

    beats {

        port => 10515

    }

}

filter {

}

output {

    # 配置输出到文件中

    file{

       path=>"/home/shaofei/output.log"

    }

    #配置输出到控制台

	stdout{

		codec=>rubydebug

	}

}
启动logstash
./bin/logstash -rf ./config/log_error.conf
配置文件log_error.conf
input {

    # 配置filebeat

    beats {

        port => 10515

    }

}

filter {

}

output {

    # 配置输出到文件中

    file{

       path=>"/home/shaofei/output.log"

    }

    #配置输出到控制台

	stdout{

		codec=>rubydebug

	}

}
启动logstash
./bin/logstash -rf ./config/log_error.conf
Filebeat快速入门的更多相关文章
- ElasticSearch实战系列八: Filebeat快速入门和使用---图文详解
前言 本文主要介绍的是ELK日志系统中的Filebeat快速入门教程. ELK介绍 ELK是三个开源软件的缩写,分别表示:Elasticsearch , Logstash, Kibana , 它们都是 ...
- Elastic FileBeat 快速入门
背景 用过ELK(Elasticsearch, Logstash, Kibana)的人应该都面临过同样的问题,Logstash虽然功能强大:支持许多的input/output plugin.强大的fi ...
- ELK快速入门(四)filebeat替代logstash收集日志
ELK快速入门四-filebeat替代logstash收集日志 filebeat简介 Filebeat是轻量级单用途的日志收集工具,用于在没有安装java的服务器上专门收集日志,可以将日志转发到log ...
- logstash快速入门实战指南-Logstash简介
作者其他ELK快速入门系列文章 Elasticsearch从入门到精通 Kibana从入门到精通 Logstash是一个具有实时流水线功能的开源数据收集引擎.Logstash可以动态统一来自不同来源的 ...
- Kubernetes快速入门
二.Kubernetes快速入门 (1)Kubernetes集群的部署方法及部署要点 (2)部署Kubernetes分布式集群 (3)kubectl使用基础 1.简介 kubectl就是API ser ...
- EFK教程 - EFK快速入门指南
通过部署elasticsearch(三节点)+filebeat+kibana快速入门EFK,并搭建起可用的demo环境测试效果 作者:"发颠的小狼",欢迎转载与投稿 目录 ▪ 用途 ...
- ElasticSearch实战系列六: Logstash快速入门和实战
前言 本文主要介绍的是ELK日志系统中的Logstash快速入门和实战 ELK介绍 ELK是三个开源软件的缩写,分别表示:Elasticsearch , Logstash, Kibana , 它们都是 ...
- Web Api 入门实战 (快速入门+工具使用+不依赖IIS)
平台之大势何人能挡? 带着你的Net飞奔吧!:http://www.cnblogs.com/dunitian/p/4822808.html 屁话我也就不多说了,什么简介的也省了,直接简单概括+demo ...
- SignalR快速入门 ~ 仿QQ即时聊天,消息推送,单聊,群聊,多群公聊(基础=》提升)
SignalR快速入门 ~ 仿QQ即时聊天,消息推送,单聊,群聊,多群公聊(基础=>提升,5个Demo贯彻全篇,感兴趣的玩才是真的学) 官方demo:http://www.asp.net/si ...
随机推荐
- 查漏补缺:Vector中去重
对于STL去重,可以使用<algorithm>中提供的unique()函数. unique()函数用于去除相邻元素中的重复元素(所以去重前需要对vector进行排序),只留下一个.返回去重 ...
- 产品需求说明书PRD模版
<软件自动化测试开发>出版了 XXX产品需求说明书 [版本号:V+数字] 编 制: 日 期: 评 审: 日 期: 批 准: 日 期: ...
- ES6中Map数据结构学习笔记
很多东西就是要细细的品读然后做点读书笔记,心理才会踏实- Javascript对象本质上就是键值对的集合(Hash结构),但是键只能是字符串,这有一定的限制. 1234 var d = {}var e ...
- PHP的ArrayAccess接口介绍
在 PHP5 中多了一系列新接口.在 HaoHappy 翻译的你可以了解到他们的应用.同时这些接口和一些实现的 Class 被归为 Standard PHP Library(SPL).在 PHP5 中 ...
- 会员VS广告:陷入两难抉择的视频网站该如何自救
互联网实在是非常奇妙,其在让一个行业兴起时,却又对传统行业造成严重冲击.比如电商不断创造销售神话,由此成为线下实体店严重萎靡,客流量和销售额直线下降的重要原因之一.但与此同时,因互联网而狂奔的新兴 ...
- 笔记: SpringBoot + VUE实现数据字典展示功能
最近一直在写前端,写得我贼难受,从能看懂一些基础的代码到整个前端框架撸下来鬼知道我经历了啥(:´д`)ゞ 项目中所用到的下拉菜单的值全部都是有数据库中的数据字典表来提供的,显示给用户的是的清晰的意思, ...
- 远程终端协议 TELNET
远程终端协议 TELNET 1.1.概述 TELNET 是一个简单的远程终端协议,也是因特网的正式标准. 用户用 TELNET 就可在其所在地通过 TCP 连接的23端口,使用主机名或 IP 地址登录 ...
- PKI详解
预备: 一.密码基元 二.密钥管理 三.PKI本质是把非对称密钥管理标准化 PKI 是 Public Key Infrastructure 的缩写,其主要功能是绑定证书持有者的身份和相关的密钥对(通过 ...
- 从头认识js-HTML中使用JavaScript
<script>元素 在HTML页面中插入Javascript的主要办法就是使用<script>元素,HTML4.01为<script>定义了下列6个属性. 1.a ...
- 7-34 jmu-python-是否偶数 (10 分)
输入一个整数,判断是否偶数 输入样例: 7 输出样例: 7不是偶数 输入样例: 8 输出样例: 8是偶数 a = int(input()) if (a % 2 == 0): print('%d是偶数' ...