matplotlib命令与格式:标题(title),标注(annotate),文字说明(text)
1.title设置图像标题
- boxstyle方框外形
- facecolor(简写fc)背景颜色
- edgecolor(简写ec)边框线条颜色
- edgewidth边框线条大小
(2)title例子:
面向对象api例子:
- import matplotlib.pyplot as plt
- x=[1,2,3,4,5]
- y=[3,6,7,9,2]
- fig,ax=plt.subplots(1,1)
- ax.plot(x,y,label='trend')
- ax.set_title('title test',fontsize=12,color='r')
- plt.show()
2.annotate标注文字
(1)annotate语法说明 :annotate(s='str' ,xy=(x,y) ,xytext=(l1,l2) ,..)
s 为注释文本内容
xy 为被注释的坐标点
xytext 为注释文字的坐标位置
xycoords 参数如下:
- figure points points from the lower left of the figure 点在图左下方
- figure pixels pixels from the lower left of the figure 图左下角的像素
- figure fraction fraction of figure from lower left 左下角数字部分
- axes points points from lower left corner of axes 从左下角点的坐标
- axes pixels pixels from lower left corner of axes 从左下角的像素坐标
- axes fraction fraction of axes from lower left 左下角部分
- data use the coordinate system of the object being annotated(default) 使用的坐标系统被注释的对象(默认)
- polar(theta,r) if not native ‘data’ coordinates t
extcoords 设置注释文字偏移量
arrowprops #箭头参数,参数类型为字典dict
- width the width of the arrow in points 点箭头的宽度
- headwidth the width of the base of the arrow head in points 在点的箭头底座的宽度
- headlength the length of the arrow head in points 点箭头的长度
- shrink fraction of total length to ‘shrink’ from both ends 总长度为分数“缩水”从两端
- facecolor 箭头颜色
bbox给标题增加外框 ,常用参数如下:
- boxstyle方框外形
- facecolor(简写fc)背景颜色
- edgecolor(简写ec)边框线条颜色
- edgewidth边框线条大小
bbox=dict(boxstyle='round,pad=0.5', fc='yellow', ec='k',lw=1 ,alpha=0.5) #fc为facecolor,ec为edgecolor,lw为lineweight
(2)案例
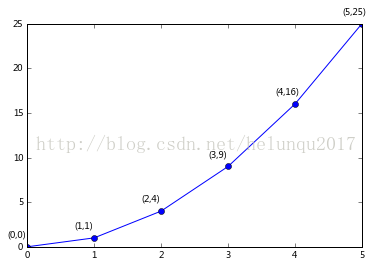
- import matplotlib.pyplot as plt
- import numpy as np
- x = np.arange(0, 6)
- y = x * x
- plt.plot(x, y, marker='o')
- for xy in zip(x, y):
- plt.annotate("(%s,%s)" % xy, xy=xy, xytext=(-20, 10), textcoords='offset points')
- plt.show()
plt.annotate('local max', xy=(2, 1), xytext=(3, 1.5),arrowprops=dict(facecolor='black', shrink=0.05))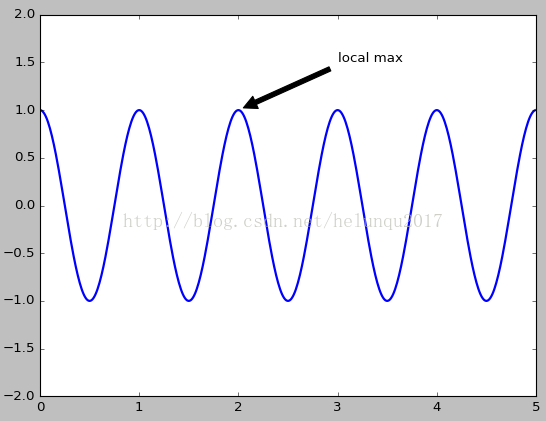
3.text设置文字说明
(1)text语法说明
text(x,y,string,fontsize=15,verticalalignment="top",horizontalalignment="right")
x,y:表示坐标值上的值
string:表示说明文字
fontsize:表示字体大小
verticalalignment:垂直对齐方式 ,参数:[ ‘center’ | ‘top’ | ‘bottom’ | ‘baseline’ ]
horizontalalignment:水平对齐方式 ,参数:[ ‘center’ | ‘right’ | ‘left’ ]
xycoords选择指定的坐标轴系统:
- figure points points from the lower left of the figure 点在图左下方
- figure pixels pixels from the lower left of the figure 图左下角的像素
- figure fraction fraction of figure from lower left 左下角数字部分
- axes points points from lower left corner of axes 从左下角点的坐标
- axes pixels pixels from lower left corner of axes 从左下角的像素坐标
- axes fraction fraction of axes from lower left 左下角部分
- data use the coordinate system of the object being annotated(default) 使用的坐标系统被注释的对象(默认)
- polar(theta,r) if not native ‘data’ coordinates t
arrowprops #箭头参数,参数类型为字典dict
- width the width of the arrow in points 点箭头的宽度
- headwidth the width of the base of the arrow head in points 在点的箭头底座的宽度
- headlength the length of the arrow head in points 点箭头的长度
- shrink fraction of total length to ‘shrink’ from both ends 总长度为分数“缩水”从两端
- facecolor 箭头颜色
bbox给标题增加外框 ,常用参数如下:
- boxstyle方框外形
- facecolor(简写fc)背景颜色
- edgecolor(简写ec)边框线条颜色
- edgewidth边框线条大小
bbox=dict(boxstyle='round,pad=0.5', fc='yellow', ec='k',lw=1 ,alpha=0.5) #fc为facecolor,ec为edgecolor,lw为lineweight
(2)案例
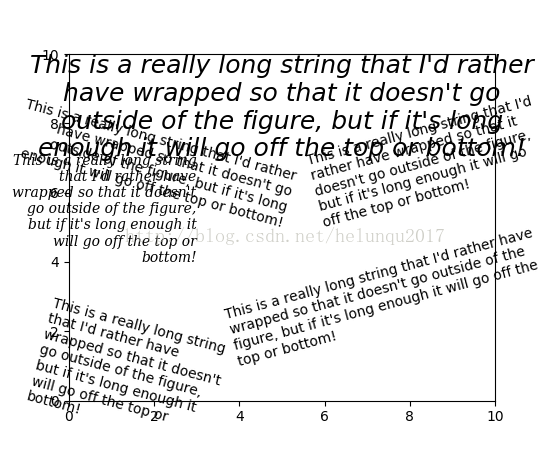
- import matplotlib.pyplot as plt
- fig = plt.figure()
- plt.axis([0, 10, 0, 10])
- t = "This is a really long string that I'd rather have wrapped so that it"\
- " doesn't go outside of the figure, but if it's long enough it will go"\
- " off the top or bottom!"
- plt.text(4, 1, t, ha='left', rotation=15, wrap=True)
- plt.text(6, 5, t, ha='left', rotation=15, wrap=True)
- plt.text(5, 5, t, ha='right', rotation=-15, wrap=True)
- plt.text(5, 10, t, fontsize=18, style='oblique', ha='center',va='top',wrap=True)
- plt.text(3, 4, t, family='serif', style='italic', ha='right', wrap=True)
- plt.text(-1, 0, t, ha='left', rotation=-15, wrap=True)
- plt.show()
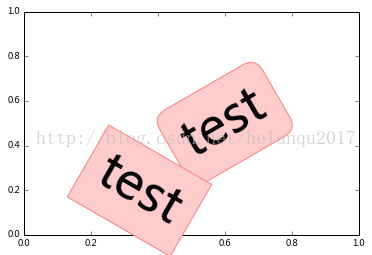
- import matplotlib.pyplot as plt
- plt.text(0.6, 0.5, "test", size=50, rotation=30.,ha="center", va="center",bbox=dict(boxstyle="round",ec=(1., 0.5, 0.5),fc=(1., 0.8, 0.8),))
- plt.text(0.5, 0.4, "test", size=50, rotation=-30.,ha="right", va="top",bbox=dict(boxstyle="square",ec=(1., 0.5, 0.5),fc=(1., 0.8, 0.8),))
- plt.draw()
- plt.show()
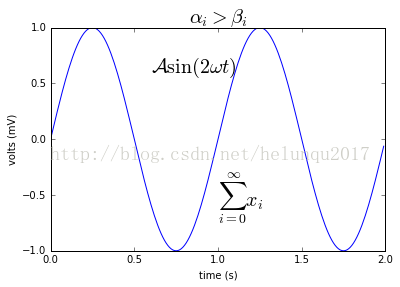
数学公式:
- plt.title(r'$\alpha_i > \beta_i$', fontsize=20)
- plt.text(1, -0.6, r'$\sum_{i=0}^\infty x_i$', fontsize=20)
- plt.text(0.6, 0.6, r'$\mathcal{A}\mathrm{sin}(2 \omega t)$',fontsize=20)
matplotlib命令与格式:标题(title),标注(annotate),文字说明(text)的更多相关文章
- matplotlib命令与格式:参数配置文件与参数配置
转自 https://my.oschina.net/swuly302/blog/94805 自定义matplotlib Created Saturday 08 December 2012 5.1 ma ...
- (三)Linux命令基本格式以及文件处理命令
命令基本格式 (1)命令提示符 如下是命令行的命令提示符,以此为例,讲解含义. 其中: root 当前登录用户名 localhost 主机名 ~ 当前所在的目录(即家目录,用户登录的初始位置) # 超 ...
- 十条常用nmap命令行格式
十条常用nmap命令行格式 ) 获取远程主机的系统类型及开放端口 nmap -sS -P0 -sV -O <target> 这里的 < target > 可以是单一 IP, 或 ...
- javascript 的Date 格式化, 模仿shell中date命令的格式
原文:javascript 的Date 格式化, 模仿shell中date命令的格式 shell 中显示当前的日期 [root@localhost]$ date '+%Y-%m-%d %H:%M:%S ...
- Python生成PASCAL VOC格式的xml标注文件
Python生成PASCAL VOC格式的xml标注文件 PASCAL VOC数据集的标注文件是xml格式的.对于py-faster-rcnn,通常以下示例的字段是合适的: <annotatio ...
- DOS中命令的格式
---------------siwuxie095 一.DOS中,命令使用格式的一般形式 用中文表达的形式为: [路径] 关键字 [盘符] [路径] 文件名 [扩展名] (参数) [参数 ...
- 山寨今日头条的标题title效果
山寨今日头条的标题title效果 效果: 源码: // // ViewController.m // 今日头条 // // Created by YouXianMing on 14/11/26. // ...
- 使用jquery修改标题$("title").html("标题")应注意的问题
使用jquery修改标题$("title").html("标题")应注意的问题: 如果修改后的标题和原标题一致,jquery会跳过该操作,这种情况再从其他页面回 ...
- SEO页面标题Title的优化
我在一个月前改过页面标题(Title),随后表现是:百度网页快照4天不更新,Google正常.而我仅仅是改了两个词组而已.在建博初期,修改Title的最频繁的时期,下面卢松松就我经历的修改Title过 ...
随机推荐
- jquery-mobile 学习笔记之二(表单创建)
绪上 一.注意事项 1. <form> 元素必须设置 method 和 action 属性 2. 每一个表单元素必须设置唯一的 "id" 属性. 该 id 在网站的页面 ...
- 【UI自动化方面】
1.自动化执行失败如何排查故障. 答:1).查看log,错误原因.[log不详细的话,可以优化] 2).排查是否真的有bug,若不是bug查看是否是新版本引入了新的变更. 3).调试脚本看自己脚本是不 ...
- javascript的call和apply
coffeescript里,每个文件编译成JS后,都是(function(){...}).call(this);的架势 这个call,该怎么理解呢? 在javascript里面,call 或者 app ...
- bzoj 4590: [Shoi2015]自动刷题机
好恶心.. 二分上界到100000LL*1000000000LL %_% #include<cstdio> #include<iostream> #include<cs ...
- JavaScript Patterns 2.6 switch Pattern
Principle • Aligning each case with switch(an exception to the curly braces indentation rule). • Ind ...
- cmd 批处理文件(.bat)文件的编写
1. 获取当前文件所在的路径信息 CMD获取当前目录的绝对路径 创建如下的名为 test.bat的文本文件: @echo off echo 当前盘符:%~d0 echo 当前盘符和路径:%~dp0 e ...
- Mac 终端执行JavaScript
创建: 2017/09/16 第一步 打开命令 输入alias jsc="/System/Library/Frameworks/JavaScriptCore.framework/ ...
- BZOJ 2946 SA/SAM
思路: 1. 二分+后缀数组 2.SAM //By SiriusRen #include <cstdio> #include <cstring> #include <al ...
- android 蓝牙 通信 bluetooth
此例子基于 android demo Android的蓝牙开发,虽然不多用,但有时还是会用到, Android对于蓝牙开发从2.0版本的sdk才开始支持,而且模拟器不支持,测试需要两部手机: ...
- day03_12/13/2016_bean属性的设置之构造器方式注入