一个自带简易数据集的模拟线性分类器matlab代码——实验训练
%%%% Tutorial on the basic structure of using a planar decision boundary
%%%% to divide a collection of data-points into two classes.
%%%% by Rajeev Raizada, Jan.2010
%%%%
%%%% Please mail any comments or suggestions to: raizada at cornell dot edu
%%%%
%%%% Probably the best way to look at this program is to read through it
%%%% line by line, and paste each line into the Matlab command window
%%%% in turn. That way, you can see what effect each individual command has.
%%%%
%%%% Alternatively, you can run the program directly by typing
%%%%
%%%% classification_plane_tutorial
%%%%
%%%% into your Matlab command window.
%%%% Do not type ".m" at the end
%%%% If you run the program all at once, all the Figure windows
%%%% will get made at once and will be sitting on top of each other.
%%%% You can move them around to see the ones that are hidden beneath. %%%%%%%%%%%%%%%%%%%%%%%%%%%%%%%%%%%%%%%%%%%%%%%%%%%%%%%%%%%%%%%%%%%%%%%
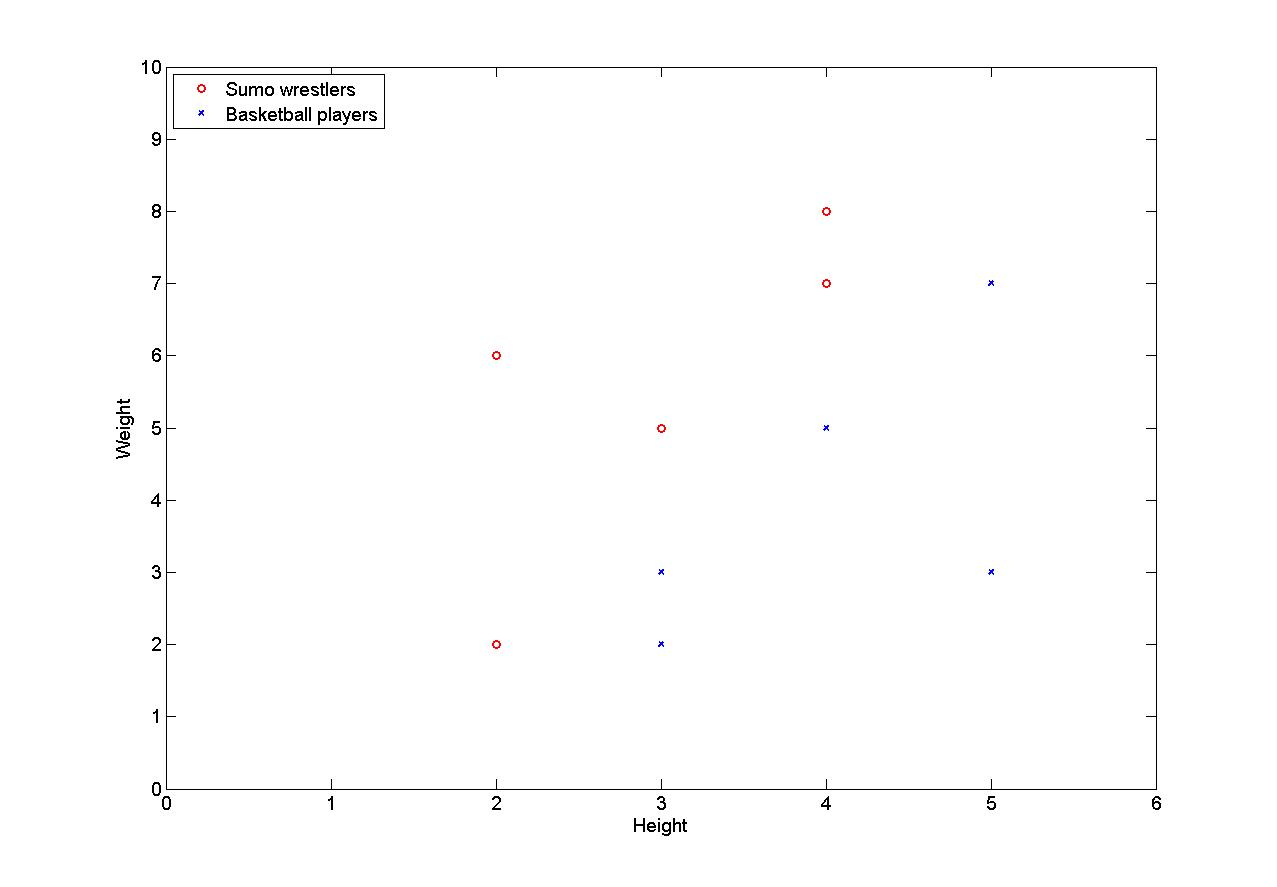
%%%% Let's look at a toy example: classifying people as either
%%%% sumo wrestlers or basketball players, depending on their height and weight.
%%%% Let's call the x-axis height and the y-axis weight sumo_wrestlers = [ 4 8; ...
2 6; ...
2 2; ...
3 5; ...
4 7]; basketball_players = [ 3 2; ...
4 5; ...
5 3; ...
5 7; ...
3 3]; %%% Let's plot this
figure(1);
clf;
set(gca,'FontSize',14);
plot(sumo_wrestlers(:,1),sumo_wrestlers(:,2),'ro','LineWidth',2);
hold on;
plot(basketball_players(:,1),basketball_players(:,2),'bx','LineWidth',2);
axis([0 6 0 10]);
xlabel('Height');
ylabel('Weight');
legend('Sumo wrestlers','Basketball players',2); % The 2 at the end means
% put the legend in top-left corner %%%% In order to be able to train a classifier on the input vectors,
%%%% we need to know what the desired output categories are for each one.
%%%% Let's set this to be +1 for sumo wrestlers, and -1 for basketball players desired_output_sumo = [ 1; ... % sumo_wrestlers = [ 4 8; ...
1; ... % 2 6; ...
1; ... % 2 2; ...
1; ... % 3 5; ...
1 ]; % 4 7];
desired_output_basketball = [ -1; ... % basketball_players = [ 3 2; ...
-1; ... % 4 5; ...
-1; ... % 5 3; ...
-1; ... % 5 7; ...
-1 ]; % 3 3 ]; all_desired_output = [ desired_output_sumo; ...
desired_output_basketball ]; %%%%%% We want to find a linear decision boundary,
%%%%%% i.e. simply a straight line, such that all the data points
%%%%%% on one side of the line get classified as sumo wrestlers,
%%%%%% i.e. get mapped onto the desired output of +1,
%%%%%% and all the data points on the other side get classified
%%%%%% as basketball players, i.e. get mapped onto the desired output of -1.
%%%%%%
%%%%%% The equation for a straight line has this form:
%%%%%% weight_vector * data_coords - offset_from_origin = 0;
%%%%%%
%%%%%% We're not so interested for now in the offset_from_origin term,
%%%%%% so we can get rid of that by subtracting the mean from our data,
%%%%%% so that it is all centered around the origin. %%%%%% Let's stack up the sumo data on top of the bastetball players data
all_data = [ sumo_wrestlers; ...
basketball_players ]; %%%%%% Now let's subtract the mean from the data,
%%%%%% so that it is all centered around the origin.
%%%%%% Each dimension (height and weight) has its own column.
mean_column_vals = mean(all_data); %%%%%% To subtract the mean from each column in Matlab,
%%%%%% we need to make a matrix full of column-mean values
%%%%%% that is the same size as the whole data matrix.
matrix_of_mean_vals = ones(size(all_data,1),1) * mean_column_vals; zero_meaned_data = all_data - matrix_of_mean_vals; %%%% Now, having gotten rid of that annoying offset_from_origin term,
%%%% we want to find a weight vector which gives us the best solution
%%%% that we can find to this equation:
%%%% zero_meaned_data * weights = all_desired_output;
%%%% But, there is no such perfect set of weights.
%%%% We can only get a best fit, such that
%%%% zero_meaned_data * weights = all_desired_output + error
%%%% where the error term is as small as possible.
%%%%
%%%% Note that our equation
%%%% zero_meaned_data * weights = all_desired_output
%%%%
%%%% has exactly the same form as the equation
%%%% from the tutorial code in
%%%% http://www.dartmouth.edu/~raj/Matlab/fMRI/design_matrix_tutorial.m
%%%% which is:
%%%% Design matrix * sensitivity vector = Voxel response
%%%%
%%%% The way we solve the equation is exactly the same, too.
%%%% If we could find a matrix-inverse of the data matrix,
%%%% then we could pre-multiply both sides by that inverse,
%%%% and that would give us the weights:
%%%%
%%%% inv(zero_meaned_data) * zero_meaned_data * weights = inv(zero_meaned_data) * all_desired_output
%%%% The inv(zero_meaned_data) and zero_meaned_data terms on the left
%%%% would cancel each other out, and we would be left with:
%%%% weights = inv(zero_meaned_data) * all_desired_output
%%%%
%%%% However, unfortunately there will in general not exist any
%%%% matrix-inverse of the data matrix zero_meaned_data.
%%%% Only square matrices have inverses, and not even all of them do.
%%%% Luckily, however, we can use something that plays a similar role,
%%%% called a pseudo-inverse. In Matlab, this is given by the command pinv.
%%%% The pseudo-inverse won't give us a perfect solution to the equation
%%%% zero_meaned_data * weights = all_desired_output
%%%% but it will give us the best approximate solution, which is what we want.
%%%%
%%%% So, instead of
%%%% weights = inv(zero_meaned_data) * all_desired_output
%%%% we have this equation:
weights = pinv(zero_meaned_data) * all_desired_output; %%%% Let's have a look at how these weights carve up the input space
%%%% A useful Matlab command for making grids of points
%%%% which span a particular 2D space is called "meshgrid"
[input_space_X, input_space_Y] = meshgrid([-3:0.3:3],[-3:0.3:3]);
weighted_output_Z = input_space_X*weights(1) + input_space_Y*weights(2); %%%% The weighted output gets turned into the category-decision +1
%%%% if it is greater than 0, and -1 if it is less than zero.
%%%% The easiest way to map positive numbers to +1
%%%% and negative numbers to -1
%%%% is by first mapping them to 1 and 0
%%%% by the inequality-test(weighted_output_Z>0)
%%%% and then turning 1 and 0 into +1 and -1
%%%% by multipling by 2 and subtracting 1.
decision_output_Z = 2*(weighted_output_Z>0) - 1; figure(2);
clf;
hold on;
surf(input_space_X,input_space_Y,decision_output_Z);
%%% Let's show this decision surface in gray, from a good angle
colormap gray;
caxis([-3 3]); %%% Sets white and black values to +/-3, so +/-1 are gray
shading interp; %%% Makes the shading look prettier
grid on;
view(-10,60);
rotate3d on; %%% Make it so we can use mouse to rotate the 3d figure
set(gca,'FontSize',14);
title('Click and drag to rotate view'); %%%% Let's plot the zero-meaned sumo and basketball data on top of this
%%%% Each class has 5 members, in this case, so we'll subtract
%%%% a mean-column-values matrix with 5 rows, to make the matrix sizes match.
one_class_matrix_of_mean_vals = ones(5,1) * mean_column_vals;
zero_meaned_sumo_wrestlers = sumo_wrestlers - one_class_matrix_of_mean_vals;
zero_meaned_basketball_players = basketball_players - one_class_matrix_of_mean_vals; plot3(zero_meaned_sumo_wrestlers(:,1),zero_meaned_sumo_wrestlers(:,2), ...
desired_output_sumo,'ro','LineWidth',5);
hold on;
plot3(zero_meaned_basketball_players(:,1),zero_meaned_basketball_players(:,2), ...
desired_output_basketball,'bx','LineWidth',5,'MarkerSize',15); xlabel('Height');
ylabel('Weight');
zlabel('Classifier output');
分类前:
分类后:

一个自带简易数据集的模拟线性分类器matlab代码——实验训练的更多相关文章
- 利用keras自带影评数据集进行评价正面与否的二分类训练
from keras.datasets import imdb from keras import layers from keras import models from keras import ...
- .net mvc 站点自带简易SSL加密传输 Word报告自动生成(例如 导出数据库结构) 微信小程序:动画(Animation) SignalR 设计理念(一) ASP.NET -- WebForm -- ViewState ASP.NET -- 一般处理程序ashx 常用到的一些js方法,记录一下 CryptoJS与C#AES加解密互转
.net mvc 站点自带简易SSL加密传输 因项目需要,传输数据需要加密,因此有了一些经验,现简易抽出来分享! 请求:前端cryptojs用rsa/aes 或 rsa/des加密,后端.net ...
- sklearn提供的自带的数据集
sklearn 的数据集有好多个种 自带的小数据集(packaged dataset):sklearn.datasets.load_<name> 可在线下载的数据集(Downloaded ...
- C#调用Oracle带输出数据集的存储过程
1.创建一个带输出数据集的Oracle存储过程 create or replace procedure PRO_test(in_top in number,cur_out out sys_refcur ...
- Python——sklearn提供的自带的数据集
sklearn提供的自带的数据集 sklearn 的数据集有好多个种 自带的小数据集(packaged dataset):sklearn.datasets.load_<name> 可在线下 ...
- ASP.NET Core管道深度剖析(2):创建一个“迷你版”的管道来模拟真实管道请求处理流程
从<ASP.NET Core管道深度剖析(1):采用管道处理HTTP请求>我们知道ASP.NET Core请求处理管道由一个服务器和一组有序的中间件组成,所以从总体设计来讲是非常简单的,但 ...
- UNITY自带的PACKAGE的UTILITY 里面有一个自带的FPS COUNTER
UNITY自带的PACKAGE的UTILITY 里面有一个自带的FPS COUNTER 可用,但是脚本是保密的?
- c++中在一个类中定义另一个只有带参数构造函数的类的对象
c++中在一个类中定义另一个只有带参数构造函数的类的对象,编译通不过 #include<iostream> using namespace std; class A { public: ...
- 一个故事带你理解if __name__ == '__main__'
如果你刚刚接触python,相信会在看别人的程序的时候会遇到if __name__ == '__main__'酱紫的语法,如果当时没看懂现在也一知半解的话,看下去,本文可以帮你解决这个问题. 大家都知 ...
随机推荐
- 判断一个字符是否为数字的两种方法(C/C++)
在平时,我们经常遇见判断字符是否为数字这种题目,虽然感觉还是很简单,不过我是个更喜欢用函数的人,因为我觉得这样更便捷,所以我更推荐第二种方式. 1.直接判断 #include <stdio.h& ...
- Struts 2 Overview
Struts2 is popular and mature web application framework based on the MVC design pattern. Struts2 is ...
- centos7 vnc 无法systemctl启动
1.centos7 vnc 无法systemctl启动 报错如下:Failed to start Remote desktop service (VNC) 2.解决办法 错误服务脚本名 vncserv ...
- sicily 1176. Two Ends (Top-down 动态规划+记忆化搜索 v.s. Bottom-up 动态规划)
Description In the two-player game "Two Ends", an even number of cards is laid out in a ro ...
- 【LOJ】#2046. 「CQOI2016」路由表
题解 题面太长无法阅读系列-- 这里说的选择改变指的是在下面区间里碰上了一个更长的可匹配的地址,如果可匹配但是匹配长度没有当前的值大,那么不算改变 我们建一个可持久化的trie,查询的时候先在前\(a ...
- 【51nod】1251 Fox序列的数量
题解 容斥题 我们枚举出现次数最多的数出现了K次 然后我们需要计算的序列是所有数字出现个数都不超过K - 1次 我们枚举不合法的数字的数目j,说明这个排列里除了我们固定出现K次的数至少有j个数是不合法 ...
- Ionic入门三:列表
列表是一个应用广泛的界面元素,在所有移动app中几乎都会使用到. 列表可以是基本文字.按钮,开关,图标和缩略图等. 列表项可以是任何的HTML元素.容器元素需要list类,每个列表项需要使用item类 ...
- 创建NuGet包
创建NuGet包 在创建一个NuGet包之前我们应该先创建一个以.nuspec为后缀的xml清单文件,这个清单文件描述了包的内容,在安装NuGet包的过程中这个清单文件扮演者很重要的角色.实际上它的作 ...
- m3u8转mp4
先进行一波操作 新建一个文件夹,里面床两个txt文件 如图 里面随意写一些内容 之后新建一个demo.bat文件.里面输入 copy /b 1.txt+2.txt new.txt 之后双击会有一个ne ...
- JVM CPU占满问题定位
RASP加载后出现JVM CPU占满问题,jstack -F输出信息无法找到对应占用CPU的线程 perf定位到占用CPU的热代码位于Dependencies::find_finalizable_su ...