
Python3绘图库Matplotlib(02)
控制颜色

| Color | Color Name |
| b | blue |
| c | cyan |
| g | green |
| k | black |
| m | magenta |
| r | red |
| w | white |
| y | yellow |
控制线的风格
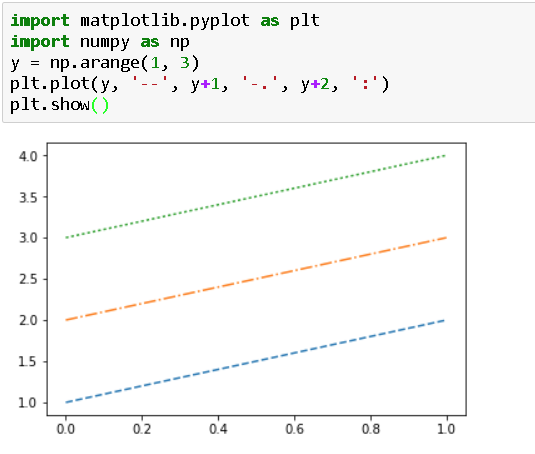
| Style | Style |
| - | solid line |
| -- | dashed line |
| -. | dash-dot line |
| : | dotted line |
控制标记样式
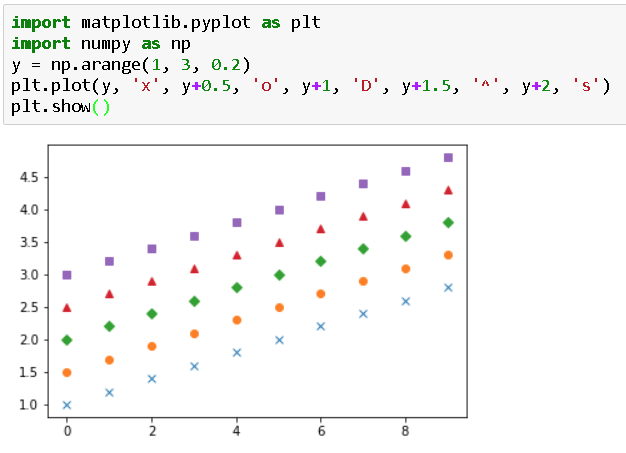
| . | Point marker |
| , | Pixel marker |
| o | Circle marker |
| v | Triangle down |
| ^ | Triangle up marker |
| < | Triangle left marker |
| > | Triangle right marker |
| 1 | Tripod down marker |
| 2 | Tripod up marker |
| 3 | Tripod left marker |
| 4 | Tripod right marker |
| s | Square marker |
| p | Pentagon marker |
| * | Star marker |
| h | Hexagon marker |
| H | Rotated hexagon marker |
| + | Plus marker |
| x | Cross marker |
| D | Diamond marker |
| d | Thin diamond marker |
| | | Vertical line |
| _ | Horizontal line |

用关键字参数进行更好的控制

处理X和Y的ticks标签值

画图的类型

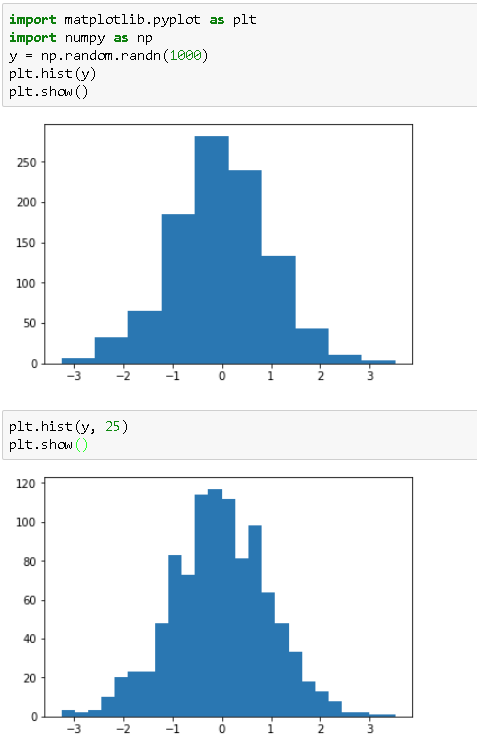
直方图图表 = Histogram charts
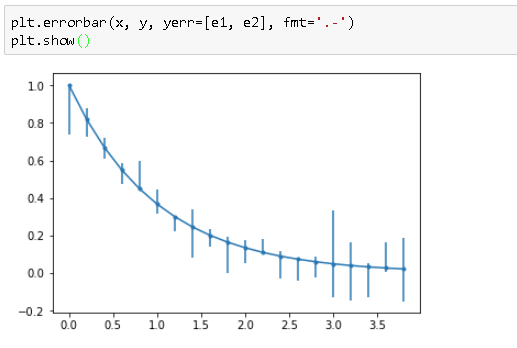
Error bar charts

Bar Charts
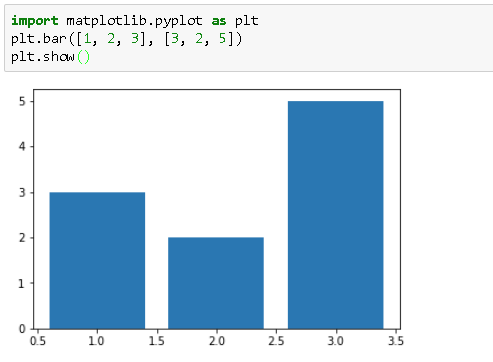
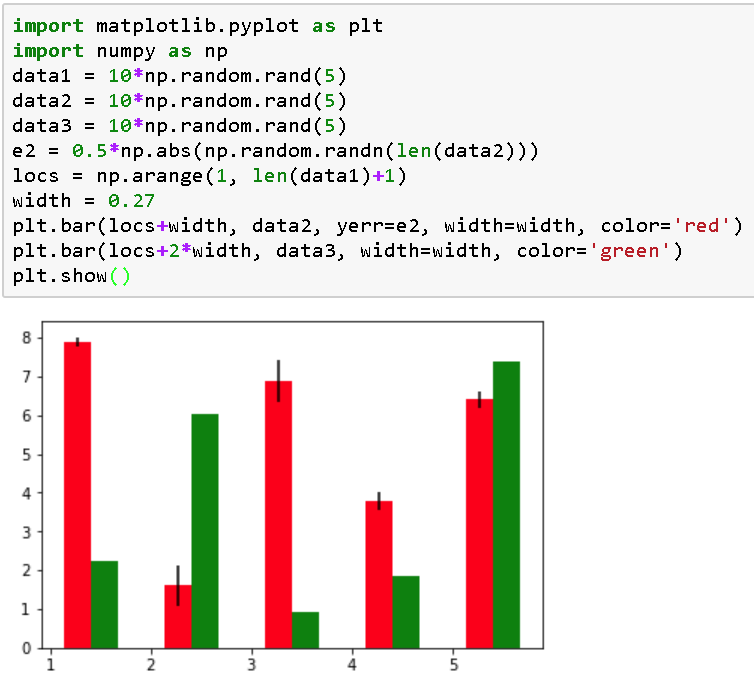
本小结代码示例
import matplotlib.pyplot as plt

import numpy as np

y = np.arange(1, 3)

plt.plot(y, 'y')

plt.plot(y+1, 'm')

plt.plot(y+2, 'c')

plt.show()

import matplotlib.pyplot as plt

import numpy as np

y = np.arange(1, 3)

plt.plot(y, '--', y+1, '-.', y+2, ':')

plt.show()

import matplotlib.pyplot as plt

import numpy as np

y = np.arange(1, 3, 0.2)

plt.plot(y, 'x', y+0.5, 'o', y+1, 'D', y+1.5, '^', y+2, 's')

plt.show()

import matplotlib.pyplot as plt

import numpy as np

y = np.arange(1, 3, 0.3)

plt.plot(y, 'cx--', y+1, 'mo:', y+2, 'kp-.')

plt.show()

import matplotlib.pyplot as plt

import numpy as np

y = np.arange(1, 3, 0.3)

plt.plot(y, color='blue', linestyle='dashdot', linewidth=4,

         marker='o', markerfacecolor='red', markeredgecolor='black',

        markeredgewidth=3, markersize=12)

plt.show()

import matplotlib.pyplot as plt

x = [5, 3, 7, 2, 4, 1]

plt.plot(x)

plt.xticks(range(len(x)), ['a', 'b', 'c', 'd', 'e', 'f'])

plt.yticks(range(1, 8, 2))

plt.show()

import matplotlib.pyplot as plt

import numpy as np

y = np.random.randn(1000)

plt.hist(y)

plt.show()

plt.hist(y, 25)

plt.show()

import matplotlib.pyplot as plt

import numpy as np

x = np.arange(0, 4, 0.2)

y = np.exp(-x)

e1 = 0.1 * np.abs(np.random.randn(len(y)))

plt.errorbar(x, y, yerr=e1, fmt='.-')

plt.show()

e2 = 0.1 * np.abs(np.random.randn(len(y)))

plt.errorbar(x, y, yerr=e1, xerr=e2, fmt='.-', capsize=0)

plt.show()

plt.errorbar(x, y, yerr=[e1, e2], fmt='.-')

plt.show()

import matplotlib.pyplot as plt

plt.bar([1, 2, 3], [3, 2, 5])

plt.show()

import matplotlib.pyplot as plt

import numpy as np

data1 = 10*np.random.rand(5)

data2 = 10*np.random.rand(5)

data3 = 10*np.random.rand(5)

e2 = 0.5*np.abs(np.random.randn(len(data2)))

locs = np.arange(1, len(data1)+1)

width = 0.27

plt.bar(locs+width, data2, yerr=e2, width=width, color='red')

plt.bar(locs+2*width, data3, width=width, color='green')

plt.show()
知识在于点点滴滴的积累,我会在这个路上Go ahead,
后记:打油诗一首
适度锻炼,量化指标
考量天气,设定目标
科学锻炼,成就体标
高效科研,实现学标
Python3绘图库Matplotlib(02)的更多相关文章
- Python3绘图库Matplotlib(01)
1 First plots with Matplotlib 简单的绘图1 简单的绘图2 简单的绘图3 2 网格 = grid 3 设置坐标轴的取值范围 = axis xlim ylim 方法1:整体设 ...
- Python 绘图库Matplotlib入门教程
0 简单介绍 Matplotlib是一个Python语言的2D绘图库,它支持各种平台,并且功能强大,能够轻易绘制出各种专业的图像. 1 安装 pip install matplotlib 2 入门代码 ...
- python 绘图库 Matplotlib
matplotlib官方文档 使用Matplotlib,能够轻易生成各种图像,例如:直方图.波谱图.条形图.散点图等. 入门代码实例 import matplotlib.pyplot as plt i ...
- 数据可视化:绘图库-Matplotlib
为什么要绘图? 一个图表数据的直观分析,下面先看一组北京和上海上午十一点到十二点的气温变化数据: 数据: 这里我用一段代码生成北京和上海的一个小时内每分钟的温度如下: import random co ...
- windows环境下,用python绘图库matplotlib绘图时中文乱码问题
1.下载中文字体(看自己爱好就行)下面这个举例: SimHei - Free Font Downloadwww.fontpalace.co 2.下载之后,打开即可安装,将字体安装进windows系统 ...
- 【Matplotlib-01】Python 绘图库 Matplotlib 入门教程
环境: Windows10 python3.6.4 numpy1.14.1 matplotlib2.1.2 工具:Cmder 目录: 1.线性图 2.散点图 3.饼状图 4.条形图 5.直方图 例1: ...
- 『科学计算』科学绘图库matplotlib学习之绘制动画
基础 1.matplotlib绘图函数接收两个等长list,第一个作为集合x坐标,第二个作为集合y坐标 2.基本函数: animation.FuncAnimation(fig, update_poin ...
- Ubuntu下安装Python绘图库Matplotlib的方法
在安装好Python的基础上, sudo apt-get install python-numpy sudo apt-get install python-scipy sudo apt-get ins ...
- 『科学计算』科学绘图库matplotlib练习
思想:万物皆对象 作业 第一题: import numpy as np import matplotlib.pyplot as plt x = [1, 2, 3, 1] y = [1, 3, 0, 1 ...
随机推荐
- python 退出程序的方式
python程序退出方式[sys.exit() os._exit() os.kill() os.popen(...)] 知乎说明 http://www.zhihu.com/question/21187 ...
- python3数据结构与算法
python内置的数据结构包括:列表(list).集合(set).字典(dictionary),一般情况下我们可以直接使用这些数据结构,但通常我们还需要考虑比如搜索.排序.排列以及赛选等一些常见的问题 ...
- if-else 重构
最近发现自己写的代码if else太多了,有时候自己回头看都要重新捋逻辑,很不好.决定深入理解下if else重构. 中心思想: ①不同分支应当是同等层次,内容相当. ②合并条件表达式,减少if语句数 ...
- kali Linux下wifi密码安全测试(1)虚拟机下usb无线网卡的挂载 【转】
转自:http://blog.chinaunix.net/uid-26349264-id-4455634.html 目录 kali Linux下wifi密码安全测试(1)虚拟机下usb无线网卡的挂载 ...
- 在SecureCRT中做make menuconfig乱码
不能在SecureCRT中做(显示为乱码),从高手那里学来一招,解决了这个问题: options--terminal--emulation-- xterm ansi color1.先设置终端为x ...
- 007_linux显示一个文件的某几行(中间几行)
<1>从第3000行开始,显示1000行.即显示3000~3999行 cat -n filename | tail -n +3000 | head -n 1000 cat -n anaco ...
- 同时装了Python3和Python2,怎么用pip
作者:匿名用户链接:https://www.zhihu.com/question/21653286/answer/95532074来源:知乎著作权归作者所有.商业转载请联系作者获得授权,非商业转载请注 ...
- Oracle基本命令大全
用户: scott/tiger sys as sysdba 空密码 转换用户登录: connect 用户/密码 connect sys as sysdba 权限 用户解锁: alter user ...
- LeetCode(6):Z字形转换
Medium! 题目描述: 将字符串 "PAYPALISHIRING" 以Z字形排列成给定的行数:(下面这样的形状) P A H N A P L S I I G Y I R 之后按 ...
- poj2992 阶乘分解
/* 将C(n,k)质因数分解,然后约束个数按公式计算 */ #include<iostream> #include<cstring> #include<cstdio&g ...