Zabbix JMX之tomcat监控
工作原理:
1、JAVA-GATEWAY
Zabbix本身不支持直接监控Java,在zabbix 1.8以前,只能使用Zapcat来做代理监控,而且要修改源代码,非常麻烦。所有后来为了解决这个监控问题,Zabbix和Java双方应运生成了各自的代理监控程序:zabbix 2.0 以后添加了服务进程zabbix-java-gateway,用以在服务端接收JMX的监控数据;Java有了JMX(全称是Java Management Extensions,即Java管理扩展),用以在客户端收集客户端的监控数据并转发到zabbix-java-gateway
2、示意图
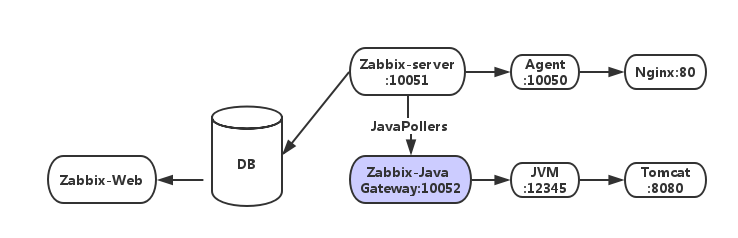
比如:当Zabbix-Server需要知道java应用程序的某项性能的时候,会启动自身的一个Zabbix-JavaPollers进程去连接Zabbix-Java-Gateway请求数据,而Zabbix-Java-gateway收到请求后会使用“JMX-management-API”去tomcat服务器开启JMX,而前提是tomcat服务器端在开启时需要“-Dcom.sun.management.jmxremote”参数来开启JMX远程查询。Java程序会启动自身的一个简单的小程序端口12345向Zabbix-JavaGateway提供请求数据。
Zabbix监控端部署:
1.安装zabbix server
编译安装zabbix server需要加上--enable-java以支持jmx监控,如果之前的zabbix server没加,那么请重新编译安装
./configure --prefix=/application/zabbix-3.0.3 --enable-server --enable-agent --enable-java --enable-ipv6 --with-mysql=/application/mysql-5.5.49/bin/mysql_config --with-net-snmp --with-libcurl --with-libxml2 --with-openipmi --with-unixodbc --with-openssl
并且监控端也需要安装java环境
2.安装zabbix_java_gateway
wget http://mirrors.aliyun.com/zabbix/zabbix/3.4/rhel/6/x86_64/zabbix-java-gateway-3.4.1-1.el6.x86_64.rpm
rpm -ivh zabbix-java-gateway-3.4.1-1.el6.x86_64.rpm(zabbix-java-gateway用老版本可能会出错)
#zabbix_java_gateway配置文件zabbix_java_gateway.conf里有默认端口等设置,这里我们保持默认即可
service zabbix-java-gateway start
此时,默认的端口10052应该打开,ss -nat | grep 10052查看
在zabbix_server.conf 中配置监控端访问zabbix_java_gateway
JavaGateway=172.16.2.150 #zabbix_java_gateway地址
StartJavaPollers=6 #预启动进程轮询个数,且这个值要比zabbix_java_gateway.conf中Start_poller值要大,不然会无法通信
重启zabbix-server
zabbix客户端安装:
1.安装JMX
1. 下载 JMX Remote jar 二进制包。放在 tomcat/lib 下面
wget http://archive.apache.org/dist/tomcat/tomcat-7/v7.0.56/bin/extras/catalina-jmx-remote.jar
2. 修改 tomcat conf/server.xml 配置文件,添加以下内容:
|
<Listener className="org.apache.catalina.mbeans.JmxRemoteLifecycleListener" rmiRegistryPortPlatform="12345" rmiServerPortPlatform="12346" /> |
3. 修改 tomcat/bin 目录下 catalina.sh ,添加以下内容:
|
CATALINA_OPTS="-Dcom.sun.management.jmxremote -Dcom.sun.management.jmxremote.authenticate=false -Dcom.sun.management.jmxremote.ssl=false -Djava.rmi.server.hostname=10.32.18.1" |
注意:Djava.rmi.server.hostname这里写上被监控端 hostname 是由于 hostname 默认值为 localhost,如果你的 tomcat 未监听在 localhost,那么不写具体 ip 会引发问题。并且这段配置应该写在catalina.sh的前面,不然端口打不开。
4. 确保 zabbix server 或者 proxy 和 配置文件中的端口通讯畅通,重启tomcat,lsof -i:12345端口打开
验证是否能获取数据
在监控端下载JMX cmd.jar文件
wget http://nchc.dl.sourceforge.net/project/jmxcmd/jmxcmd.jar
测试有数据则表示成功
命令格式:
# java -jar jmxcmd.jar - 192.168.3.18:12345 java.lang:type=Memory NonHeapMemoryUsage
导入模板,添加监控
<?xml version="1.0" encoding="UTF-8"?>

-<zabbix_export>

<version>2.0</version>

<date>2013-05-30T03:17:01Z</date>

-<groups>

-<group>

<name>Templates</name>

</group>

</groups>

-<templates>

-<template>

<template>CustomTomcat</template>

<name>CustomTomcat</name>

-<groups>

-<group>

<name>Templates</name>

</group>

</groups>

-<applications>

-<application>

<name>class</name>

</application>

-<application>

<name>HeapStatistics</name>

</application>

-<application>

<name>Sessions</name>

</application>

-<application>

<name>ThreadStatistics</name>

</application>

-<application>

<name>Tomcat</name>

</application>

</applications>

-<items>

-<item>

<name>http-8080 gzip compression</name>

<type>16</type>

<snmp_community/>

<multiplier>0</multiplier>

<snmp_oid/>

<key>jmx["Catalina:type=ProtocolHandler,port=8080",compression]</key>

<delay>30</delay>

<history>90</history>

<trends>365</trends>

<status>0</status>

<value_type>1</value_type>

<allowed_hosts/>

<units/>

<delta>0</delta>

<snmpv3_securityname/>

<snmpv3_securitylevel>0</snmpv3_securitylevel>

<snmpv3_authpassphrase/>

<snmpv3_privpassphrase/>

<formula>1</formula>

<delay_flex/>

<params/>

<ipmi_sensor/>

<data_type>0</data_type>

<authtype>0</authtype>

<username/>

<password/>

<publickey/>

<privatekey/>

<port/>

<description/>

<inventory_link>0</inventory_link>

<applications/>

<valuemap/>

</item>

-<item>

<name>http-8080活动线程</name>

<type>16</type>

<snmp_community/>

<multiplier>0</multiplier>

<snmp_oid/>

<key>jmx["java.lang:type=Threading","ThreadCount"]</key>

<delay>30</delay>

<history>90</history>

<trends>365</trends>

<status>0</status>

<value_type>3</value_type>

<allowed_hosts/>

<units/>

<delta>0</delta>

<snmpv3_securityname/>

<snmpv3_securitylevel>0</snmpv3_securitylevel>

<snmpv3_authpassphrase/>

<snmpv3_privpassphrase/>

<formula>1</formula>

<delay_flex/>

<params/>

<ipmi_sensor/>

<data_type>0</data_type>

<authtype>0</authtype>

<username/>

<password/>

<publickey/>

<privatekey/>

<port/>

<description/>

<inventory_link>0</inventory_link>

-<applications>

-<application>

<name>ThreadStatistics</name>

</application>

</applications>

<valuemap/>

</item>

-<item>

<name>http-8080线程峰值</name>

<type>16</type>

<snmp_community/>

<multiplier>0</multiplier>

<snmp_oid/>

<key>jmx["java.lang:type=Threading","PeakThreadCount"]</key>

<delay>30</delay>

<history>90</history>

<trends>365</trends>

<status>0</status>

<value_type>3</value_type>

<allowed_hosts/>

<units/>

<delta>0</delta>

<snmpv3_securityname/>

<snmpv3_securitylevel>0</snmpv3_securitylevel>

<snmpv3_authpassphrase/>

<snmpv3_privpassphrase/>

<formula>1</formula>

<delay_flex/>

<params/>

<ipmi_sensor/>

<data_type>0</data_type>

<authtype>0</authtype>

<username/>

<password/>

<publickey/>

<privatekey/>

<port/>

<description/>

<inventory_link>0</inventory_link>

-<applications>

-<application>

<name>ThreadStatistics</name>

</application>

</applications>

<valuemap/>

</item>

-<item>

<name>http-8080线程总计</name>

<type>16</type>

<snmp_community/>

<multiplier>0</multiplier>

<snmp_oid/>

<key>jmx["java.lang:type=Threading","TotalStartedThreadCount"]</key>

<delay>30</delay>

<history>90</history>

<trends>365</trends>

<status>0</status>

<value_type>3</value_type>

<allowed_hosts/>

<units/>

<delta>0</delta>

<snmpv3_securityname/>

<snmpv3_securitylevel>0</snmpv3_securitylevel>

<snmpv3_authpassphrase/>

<snmpv3_privpassphrase/>

<formula>1</formula>

<delay_flex/>

<params/>

<ipmi_sensor/>

<data_type>0</data_type>

<authtype>0</authtype>

<username/>

<password/>

<publickey/>

<privatekey/>

<port/>

<description/>

<inventory_link>0</inventory_link>

-<applications>

-<application>

<name>ThreadStatistics</name>

</application>

</applications>

<valuemap/>

</item>

-<item>

<name>Sessions-Number of sessions we rejected due to maxActive beeing reached</name>

<type>16</type>

<snmp_community/>

<multiplier>0</multiplier>

<snmp_oid/>

<key>jmx["Catalina:type=Manager,context=/,host=localhost",rejectedSessions]</key>

<delay>30</delay>

<history>90</history>

<trends>365</trends>

<status>0</status>

<value_type>3</value_type>

<allowed_hosts/>

<units/>

<delta>0</delta>

<snmpv3_securityname/>

<snmpv3_securitylevel>0</snmpv3_securitylevel>

<snmpv3_authpassphrase/>

<snmpv3_privpassphrase/>

<formula>1</formula>

<delay_flex/>

<params/>

<ipmi_sensor/>

<data_type>0</data_type>

<authtype>0</authtype>

<username/>

<password/>

<publickey/>

<privatekey/>

<port/>

<description/>

<inventory_link>0</inventory_link>

-<applications>

-<application>

<name>Sessions</name>

</application>

</applications>

<valuemap/>

</item>

-<item>

<name>Sessions-The maximum number of active Sessions allowed, or -1 for no limit</name>

<type>16</type>

<snmp_community/>

<multiplier>0</multiplier>

<snmp_oid/>

<key>jmx["Catalina:type=Manager,context=/,host=localhost",maxActiveSessions]</key>

<delay>30</delay>

<history>90</history>

<trends>365</trends>

<status>0</status>

<value_type>0</value_type>

<allowed_hosts/>

<units/>

<delta>0</delta>

<snmpv3_securityname/>

<snmpv3_securitylevel>0</snmpv3_securitylevel>

<snmpv3_authpassphrase/>

<snmpv3_privpassphrase/>

<formula>1</formula>

<delay_flex/>

<params/>

<ipmi_sensor/>

<data_type>0</data_type>

<authtype>0</authtype>

<username/>

<password/>

<publickey/>

<privatekey/>

<port/>

<description/>

<inventory_link>0</inventory_link>

-<applications>

-<application>

<name>Sessions</name>

</application>

</applications>

<valuemap/>

</item>

-<item>

<name>Sessions-会话数</name>

<type>16</type>

<snmp_community/>

<multiplier>0</multiplier>

<snmp_oid/>

<key>jmx["Catalina:type=Manager,context=/,host=localhost",sessionCounter]</key>

<delay>30</delay>

<history>90</history>

<trends>365</trends>

<status>0</status>

<value_type>3</value_type>

<allowed_hosts/>

<units/>

<delta>0</delta>

<snmpv3_securityname/>

<snmpv3_securitylevel>0</snmpv3_securitylevel>

<snmpv3_authpassphrase/>

<snmpv3_privpassphrase/>

<formula>1</formula>

<delay_flex/>

<params/>

<ipmi_sensor/>

<data_type>0</data_type>

<authtype>0</authtype>

<username/>

<password/>

<publickey/>

<privatekey/>

<port/>

<description/>

<inventory_link>0</inventory_link>

-<applications>

-<application>

<name>Sessions</name>

</application>

</applications>

<valuemap/>

</item>

-<item>

<name>Sessions-当前活动会话数</name>

<type>16</type>

<snmp_community/>

<multiplier>0</multiplier>

<snmp_oid/>

<key>jmx["Catalina:type=Manager,context=/,host=localhost",activeSessions]</key>

<delay>30</delay>

<history>90</history>

<trends>365</trends>

<status>0</status>

<value_type>3</value_type>

<allowed_hosts/>

<units/>

<delta>0</delta>

<snmpv3_securityname/>

<snmpv3_securitylevel>0</snmpv3_securitylevel>

<snmpv3_authpassphrase/>

<snmpv3_privpassphrase/>

<formula>1</formula>

<delay_flex/>

<params/>

<ipmi_sensor/>

<data_type>0</data_type>

<authtype>0</authtype>

<username/>

<password/>

<publickey/>

<privatekey/>

<port/>

<description/>

<inventory_link>0</inventory_link>

-<applications>

-<application>

<name>Sessions</name>

</application>

</applications>

<valuemap/>

</item>

-<item>

<name>Sessions-最大活动会话数</name>

<type>16</type>

<snmp_community/>

<multiplier>0</multiplier>

<snmp_oid/>

<key>jmx["Catalina:type=Manager,context=/,host=localhost",maxActive]</key>

<delay>30</delay>

<history>90</history>

<trends>365</trends>

<status>0</status>

<value_type>3</value_type>

<allowed_hosts/>

<units/>

<delta>0</delta>

<snmpv3_securityname/>

<snmpv3_securitylevel>0</snmpv3_securitylevel>

<snmpv3_authpassphrase/>

<snmpv3_privpassphrase/>

<formula>1</formula>

<delay_flex/>

<params/>

<ipmi_sensor/>

<data_type>0</data_type>

<authtype>0</authtype>

<username/>

<password/>

<publickey/>

<privatekey/>

<port/>

<description/>

<inventory_link>0</inventory_link>

-<applications>

-<application>

<name>Sessions</name>

</application>

</applications>

<valuemap/>

</item>

-<item>

<name>Tomcat version</name>

<type>16</type>

<snmp_community/>

<multiplier>0</multiplier>

<snmp_oid/>

<key>jmx["Catalina:type=Server",serverInfo]</key>

<delay>30</delay>

<history>90</history>

<trends>365</trends>

<status>0</status>

<value_type>1</value_type>

<allowed_hosts/>

<units/>

<delta>0</delta>

<snmpv3_securityname/>

<snmpv3_securitylevel>0</snmpv3_securitylevel>

<snmpv3_authpassphrase/>

<snmpv3_privpassphrase/>

<formula>1</formula>

<delay_flex/>

<params/>

<ipmi_sensor/>

<data_type>0</data_type>

<authtype>0</authtype>

<username/>

<password/>

<publickey/>

<privatekey/>

<port/>

<description/>

<inventory_link>0</inventory_link>

-<applications>

-<application>

<name>Tomcat</name>

</application>

</applications>

<valuemap/>

</item>

-<item>

<name>堆内存已使用</name>

<type>16</type>

<snmp_community/>

<multiplier>0</multiplier>

<snmp_oid/>

<key>jmx["java.lang:type=Memory","HeapMemoryUsage.used"]</key>

<delay>30</delay>

<history>90</history>

<trends>365</trends>

<status>0</status>

<value_type>3</value_type>

<allowed_hosts/>

<units/>

<delta>0</delta>

<snmpv3_securityname/>

<snmpv3_securitylevel>0</snmpv3_securitylevel>

<snmpv3_authpassphrase/>

<snmpv3_privpassphrase/>

<formula>1</formula>

<delay_flex/>

<params/>

<ipmi_sensor/>

<data_type>0</data_type>

<authtype>0</authtype>

<username/>

<password/>

<publickey/>

<privatekey/>

<port/>

<description/>

<inventory_link>0</inventory_link>

-<applications>

-<application>

<name>HeapStatistics</name>

</application>

</applications>

<valuemap/>

</item>

-<item>

<name>堆内存已提交</name>

<type>16</type>

<snmp_community/>

<multiplier>0</multiplier>

<snmp_oid/>

<key>jmx["java.lang:type=Memory","HeapMemoryUsage.committed"]</key>

<delay>30</delay>

<history>90</history>

<trends>365</trends>

<status>0</status>

<value_type>3</value_type>

<allowed_hosts/>

<units/>

<delta>0</delta>

<snmpv3_securityname/>

<snmpv3_securitylevel>0</snmpv3_securitylevel>

<snmpv3_authpassphrase/>

<snmpv3_privpassphrase/>

<formula>1</formula>

<delay_flex/>

<params/>

<ipmi_sensor/>

<data_type>0</data_type>

<authtype>0</authtype>

<username/>

<password/>

<publickey/>

<privatekey/>

<port/>

<description/>

<inventory_link>0</inventory_link>

-<applications>

-<application>

<name>HeapStatistics</name>

</application>

</applications>

<valuemap/>

</item>

-<item>

<name>堆内存最大</name>

<type>16</type>

<snmp_community/>

<multiplier>0</multiplier>

<snmp_oid/>

<key>jmx["java.lang:type=Memory","HeapMemoryUsage.max"]</key>

<delay>30</delay>

<history>90</history>

<trends>365</trends>

<status>0</status>

<value_type>3</value_type>

<allowed_hosts/>

<units/>

<delta>0</delta>

<snmpv3_securityname/>

<snmpv3_securitylevel>0</snmpv3_securitylevel>

<snmpv3_authpassphrase/>

<snmpv3_privpassphrase/>

<formula>1</formula>

<delay_flex/>

<params/>

<ipmi_sensor/>

<data_type>0</data_type>

<authtype>0</authtype>

<username/>

<password/>

<publickey/>

<privatekey/>

<port/>

<description/>

<inventory_link>0</inventory_link>

-<applications>

-<application>

<name>HeapStatistics</name>

</application>

</applications>

<valuemap/>

</item>

-<item>

<name>类-已加载</name>

<type>16</type>

<snmp_community/>

<multiplier>0</multiplier>

<snmp_oid/>

<key>jmx["java.lang:type=ClassLoading","LoadedClassCount"]</key>

<delay>30</delay>

<history>90</history>

<trends>365</trends>

<status>0</status>

<value_type>3</value_type>

<allowed_hosts/>

<units/>

<delta>0</delta>

<snmpv3_securityname/>

<snmpv3_securitylevel>0</snmpv3_securitylevel>

<snmpv3_authpassphrase/>

<snmpv3_privpassphrase/>

<formula>1</formula>

<delay_flex/>

<params/>

<ipmi_sensor/>

<data_type>0</data_type>

<authtype>0</authtype>

<username/>

<password/>

<publickey/>

<privatekey/>

<port/>

<description/>

<inventory_link>0</inventory_link>

-<applications>

-<application>

<name>class</name>

</application>

</applications>

<valuemap/>

</item>

-<item>

<name>类-已卸载</name>

<type>16</type>

<snmp_community/>

<multiplier>0</multiplier>

<snmp_oid/>

<key>jmx["java.lang:type=ClassLoading","UnloadedClassCount"]</key>

<delay>30</delay>

<history>90</history>

<trends>365</trends>

<status>0</status>

<value_type>3</value_type>

<allowed_hosts/>

<units/>

<delta>0</delta>

<snmpv3_securityname/>

<snmpv3_securitylevel>0</snmpv3_securitylevel>

<snmpv3_authpassphrase/>

<snmpv3_privpassphrase/>

<formula>1</formula>

<delay_flex/>

<params/>

<ipmi_sensor/>

<data_type>0</data_type>

<authtype>0</authtype>

<username/>

<password/>

<publickey/>

<privatekey/>

<port/>

<description/>

<inventory_link>0</inventory_link>

-<applications>

-<application>

<name>class</name>

</application>

</applications>

<valuemap/>

</item>

-<item>

<name>类-总计</name>

<type>16</type>

<snmp_community/>

<multiplier>0</multiplier>

<snmp_oid/>

<key>jmx["java.lang:type=ClassLoading","TotalLoadedClassCount"]</key>

<delay>30</delay>

<history>90</history>

<trends>365</trends>

<status>0</status>

<value_type>3</value_type>

<allowed_hosts/>

<units/>

<delta>0</delta>

<snmpv3_securityname/>

<snmpv3_securitylevel>0</snmpv3_securitylevel>

<snmpv3_authpassphrase/>

<snmpv3_privpassphrase/>

<formula>1</formula>

<delay_flex/>

<params/>

<ipmi_sensor/>

<data_type>0</data_type>

<authtype>0</authtype>

<username/>

<password/>

<publickey/>

<privatekey/>

<port/>

<description/>

<inventory_link>0</inventory_link>

-<applications>

-<application>

<name>class</name>

</application>

</applications>

<valuemap/>

</item>

</items>

<discovery_rules/>

<macros/>

<templates/>

<screens/>

</template>

</templates>

-<graphs>

-<graph>

<name>会话状态</name>

<width>900</width>

<height>200</height>

<yaxismin>0.0000</yaxismin>

<yaxismax>100.0000</yaxismax>

<show_work_period>1</show_work_period>

<show_triggers>1</show_triggers>

<type>0</type>

<show_legend>1</show_legend>

<show_3d>0</show_3d>

<percent_left>0.0000</percent_left>

<percent_right>0.0000</percent_right>

<ymin_type_1>0</ymin_type_1>

<ymax_type_1>0</ymax_type_1>

<ymin_item_1>0</ymin_item_1>

<ymax_item_1>0</ymax_item_1>

-<graph_items>

-<graph_item>

<sortorder>0</sortorder>

<drawtype>0</drawtype>

<color>C80000</color>

<yaxisside>0</yaxisside>

<calc_fnc>2</calc_fnc>

<type>0</type>

-<item>

<host>CustomTomcat</host>

<key>jmx["Catalina:type=Manager,context=/,host=localhost",maxActive]</key>

</item>

</graph_item>

-<graph_item>

<sortorder>1</sortorder>

<drawtype>0</drawtype>

<color>00C800</color>

<yaxisside>0</yaxisside>

<calc_fnc>2</calc_fnc>

<type>0</type>

-<item>

<host>CustomTomcat</host>

<key>jmx["Catalina:type=Manager,context=/,host=localhost",activeSessions]</key>

</item>

</graph_item>

-<graph_item>

<sortorder>2</sortorder>

<drawtype>0</drawtype>

<color>0000C8</color>

<yaxisside>0</yaxisside>

<calc_fnc>2</calc_fnc>

<type>0</type>

-<item>

<host>CustomTomcat</host>

<key>jmx["Catalina:type=Manager,context=/,host=localhost",sessionCounter]</key>

</item>

</graph_item>

-<graph_item>

<sortorder>3</sortorder>

<drawtype>0</drawtype>

<color>C800C8</color>

<yaxisside>0</yaxisside>

<calc_fnc>2</calc_fnc>

<type>0</type>

-<item>

<host>CustomTomcat</host>

<key>jmx["Catalina:type=Manager,context=/,host=localhost",rejectedSessions]</key>

</item>

</graph_item>

-<graph_item>

<sortorder>4</sortorder>

<drawtype>0</drawtype>

<color>00C8C8</color>

<yaxisside>0</yaxisside>

<calc_fnc>2</calc_fnc>

<type>0</type>

-<item>

<host>CustomTomcat</host>

<key>jmx["Catalina:type=Manager,context=/,host=localhost",maxActiveSessions]</key>

</item>

</graph_item>

</graph_items>

</graph>

-<graph>

<name>堆内存状态</name>

<width>900</width>

<height>200</height>

<yaxismin>0.0000</yaxismin>

<yaxismax>100.0000</yaxismax>

<show_work_period>1</show_work_period>

<show_triggers>1</show_triggers>

<type>0</type>

<show_legend>1</show_legend>

<show_3d>0</show_3d>

<percent_left>0.0000</percent_left>

<percent_right>0.0000</percent_right>

<ymin_type_1>0</ymin_type_1>

<ymax_type_1>0</ymax_type_1>

<ymin_item_1>0</ymin_item_1>

<ymax_item_1>0</ymax_item_1>

-<graph_items>

-<graph_item>

<sortorder>0</sortorder>

<drawtype>0</drawtype>

<color>C80000</color>

<yaxisside>0</yaxisside>

<calc_fnc>2</calc_fnc>

<type>0</type>

-<item>

<host>CustomTomcat</host>

<key>jmx["java.lang:type=Memory","HeapMemoryUsage.used"]</key>

</item>

</graph_item>

-<graph_item>

<sortorder>1</sortorder>

<drawtype>0</drawtype>

<color>00C800</color>

<yaxisside>0</yaxisside>

<calc_fnc>2</calc_fnc>

<type>0</type>

-<item>

<host>CustomTomcat</host>

<key>jmx["java.lang:type=Memory","HeapMemoryUsage.committed"]</key>

</item>

</graph_item>

-<graph_item>

<sortorder>2</sortorder>

<drawtype>0</drawtype>

<color>0000C8</color>

<yaxisside>0</yaxisside>

<calc_fnc>2</calc_fnc>

<type>0</type>

-<item>

<host>CustomTomcat</host>

<key>jmx["java.lang:type=Memory","HeapMemoryUsage.max"]</key>

</item>

</graph_item>

</graph_items>

</graph>

-<graph>

<name>类状态</name>

<width>900</width>

<height>200</height>

<yaxismin>0.0000</yaxismin>

<yaxismax>100.0000</yaxismax>

<show_work_period>1</show_work_period>

<show_triggers>1</show_triggers>

<type>0</type>

<show_legend>1</show_legend>

<show_3d>0</show_3d>

<percent_left>0.0000</percent_left>

<percent_right>0.0000</percent_right>

<ymin_type_1>0</ymin_type_1>

<ymax_type_1>0</ymax_type_1>

<ymin_item_1>0</ymin_item_1>

<ymax_item_1>0</ymax_item_1>

-<graph_items>

-<graph_item>

<sortorder>0</sortorder>

<drawtype>0</drawtype>

<color>C80000</color>

<yaxisside>0</yaxisside>

<calc_fnc>2</calc_fnc>

<type>0</type>

-<item>

<host>CustomTomcat</host>

<key>jmx["java.lang:type=ClassLoading","LoadedClassCount"]</key>

</item>

</graph_item>

-<graph_item>

<sortorder>1</sortorder>

<drawtype>0</drawtype>

<color>00C800</color>

<yaxisside>0</yaxisside>

<calc_fnc>2</calc_fnc>

<type>0</type>

-<item>

<host>CustomTomcat</host>

<key>jmx["java.lang:type=ClassLoading","UnloadedClassCount"]</key>

</item>

</graph_item>

-<graph_item>

<sortorder>2</sortorder>

<drawtype>0</drawtype>

<color>0000C8</color>

<yaxisside>0</yaxisside>

<calc_fnc>2</calc_fnc>

<type>0</type>

-<item>

<host>CustomTomcat</host>

<key>jmx["java.lang:type=ClassLoading","TotalLoadedClassCount"]</key>

</item>

</graph_item>

</graph_items>

</graph>

-<graph>

<name>线程状态</name>

<width>900</width>

<height>200</height>

<yaxismin>0.0000</yaxismin>

<yaxismax>100.0000</yaxismax>

<show_work_period>1</show_work_period>

<show_triggers>1</show_triggers>

<type>0</type>

<show_legend>1</show_legend>

<show_3d>0</show_3d>

<percent_left>0.0000</percent_left>

<percent_right>0.0000</percent_right>

<ymin_type_1>0</ymin_type_1>

<ymax_type_1>0</ymax_type_1>

<ymin_item_1>0</ymin_item_1>

<ymax_item_1>0</ymax_item_1>

-<graph_items>

-<graph_item>

<sortorder>0</sortorder>

<drawtype>0</drawtype>

<color>C80000</color>

<yaxisside>0</yaxisside>

<calc_fnc>2</calc_fnc>

<type>0</type>

-<item>

<host>CustomTomcat</host>

<key>jmx["java.lang:type=Threading","ThreadCount"]</key>

</item>

</graph_item>

-<graph_item>

<sortorder>1</sortorder>

<drawtype>0</drawtype>

<color>00C800</color>

<yaxisside>0</yaxisside>

<calc_fnc>2</calc_fnc>

<type>0</type>

-<item>

<host>CustomTomcat</host>

<key>jmx["java.lang:type=Threading","PeakThreadCount"]</key>

</item>

</graph_item>

-<graph_item>

<sortorder>2</sortorder>

<drawtype>0</drawtype>

<color>0000C8</color>

<yaxisside>0</yaxisside>

<calc_fnc>2</calc_fnc>

<type>0</type>

-<item>

<host>CustomTomcat</host>

<key>jmx["java.lang:type=Threading","TotalStartedThreadCount"]</key>

</item>

</graph_item>

</graph_items>

</graph>

</graphs>

</zabbix_export>
附录

Zabbix JMX之tomcat监控的更多相关文章
- zabbix 基于JMX的Tomcat监控
zabbix 基于JMX的Tomcat监控 一.环境 ubuntu14.04 LTS Java 1.7.0 zabbix 2.4.5 二.安装配置 1.安装JavaGateway 在ubuntu14. ...
- zabbix实现对tomcat的监控
zabbix实现对tomcat的监控 工作原理 比如:当Zabbix-Server需要知道java应用程序的某项性能的时候,会启动自身的一个Zabbix-JavaPollers进程去连接Zabbix- ...
- zabbix添加Tomcat监控
参靠了网上一些关于zabbix添加Tomcat的监控配置,自己整理了下: 一.服务器端配置1.找到zabbix源码存放路径 # find / -name zabbix_java #/usr/local ...
- 【 Zabbix 】— Tomcat监控及故障重启服务
一.监控tomcat原理 zabbix_server开启java poller,zabbix_java开启JavaGateway, 端口为:10052,tomcat JMX开启12345提供性能数据. ...
- 使用JMX工具远程监控tomcat配置
使用JMX工具远程监控tomcat,在tomcat启动时添加配置参数: -Dcom.sun.management.jmxremote -Dcom.sun.management.jmxremote.po ...
- 8、zabbix监控方式及分布式监控(04)
zabbix支持的监控方式 zabbix所能够显示的且可指定为监控接口类型的监控方式: Agent passive active SNMP:Simple Network Management Prot ...
- Zabbix的集中式监控
相对于传统的ZABBIX硬件系统级监控(CPU,内存,硬盘,网卡),应用级的监控就显得有些复杂了. 如果对不同的应该来不同的应用,配置会很多的. 如果我们能在一个指定的AGENT上监控所有的APACH ...
- 开源框架是如何通过JMX来做监控的(一) - JMX简介和Standard MBean
相关文章目录: 开源框架是如何通过JMX来做监控的(一) - JMX简介和Standard MBean 开源框架是如何通过JMX来做监控的(二) - Druid连接池的监控 相信很多做Java开发的同 ...
- Centos Tomcat监控
1.Window环境下jdk的bin目录中提供jvisualvm.exe工具,但是linux环境中的jdk未提供. 用window下的jvisualvm远程监控linux环境下的tomcat 两种连接 ...
随机推荐
- Linux系统内存占用90%以上——解决方法
Linux系统内存占用90%以上--解决方法 首先要明确一个问题:Linux系统内存占用90%以上,是否属于正常范围?网上有详细的解释,这属于正常现象~~~ www.2cto.com L ...
- centos7下安装vsftpd
安装步骤: 创建ftp目录 cd / mkdir ftpfile 创建指定登陆用户并不让他拥有登陆系统的权限(设置指定登陆shell) useradd ftpuser -d /ftpfile/ -s ...
- 试着把.net的GC讲清楚(2)
试着把.net的GC讲清楚(1) 上篇文章说了一些基本概念的东西,然后还有很多东西概念没有头绪,这篇文章我试着解释 GC的回收算法详细步骤? 上篇]文章讲了.net GC的算法是Mark and Co ...
- 《InsideUE4》UObject(六)类型系统代码生成重构-UE4CodeGen_Private
读的不如写的快 引言 在之前的<InsideUE4>UObject(四)类型系统代码生成和<InsideUE4>UObject(五)类型系统收集章节里,我们介绍了UE4是如何根 ...
- win7下通过easyBCD引导安装Ubuntu16.04(并处理遇到的坑)
Ubuntu16.04作为目前最新版本的ubuntu系统,相信很多人都想在自己的电脑上安装一下,然而系统的安装方法各式各样,u盘法.grub引导法等等,这里我将介绍在win7系统下用easyBCD软件 ...
- C语言学习之插入排序
此前的一些博文分别写了C语言中经典的排序方式,选择排序 冒泡排序 桶排序,此文就写 插入排序吧. 相对于冒泡排序,插入排序就比较方便快捷了.和冒泡 选择排序一样,插入排序也需要比较大小.可以这样理解插 ...
- shiro笔记-AuthenticatingRealm和AuthorizingRealm关系
AuthenticatingRealm-------->用于认证方法的Realm AuthorizingRealm--------->用于授权和认证的realm一般使用这个 Authori ...
- js在工作中遇到的一些问题
前言 js这种语言没有太多封装好的模式或者统一的编程方式,所以一些细节的问题很容易导致bug,那下面就写为:一份坚固的代码是什么样的. 持续更新一下,记一些good case和bug. 事件绑定的选择 ...
- 第I篇PCI体系结构概述
PCI总线作为处理器系统的局部总线,主要目的是为了连接外部设备,而不是作为处理器的系统总线连接Cache和主存储器.但是PCI总线.系统总线和处理器体系结构之间依然存在着紧密的联系. PCI总线作为系 ...
- 笔记︱范数正则化L0、L1、L2-岭回归&Lasso回归(稀疏与特征工程)
机器学习中的范数规则化之(一)L0.L1与L2范数 博客的学习笔记,对一些要点进行摘录.规则化也有其他名称,比如统计学术中比较多的叫做增加惩罚项:还有现在比较多的正则化. -------------- ...