RAC Wait Event: gcs log flush sync 等待事件 转
RAC Wait Event: gcs log flush sync
https://www.hhutzler.de/blog/rac-wait-event_gcs_log_flush_sync/#overview-gcs-log-flush-sync-wait-event
Table of Contents
Overview : gcs log flush sync wait event
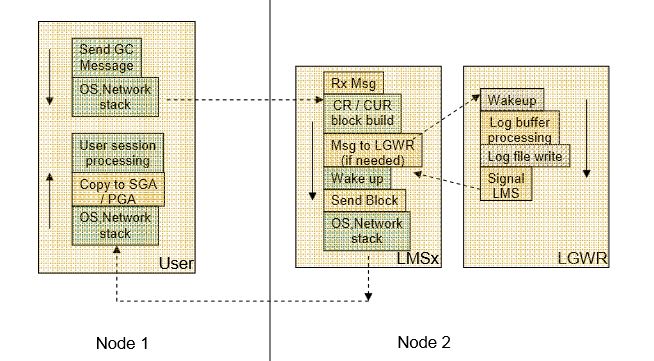
- Before sending a reconstructed CR block or CUR block, LMS will verify that corresponding redo vectors are flushed to disk.
- LMS will flush request a log flush when there are uncomitted transactions within the required block -> Increasing commit frequence will increase this wait event too
- Use lfsdiag.sql script to understand the wait time suffered by LGWR process
- If the redo vector are not flushed, LMS on node2 need to wait for ‘gcs log flush sync’ event after requesting LGWR for a log flush, analogous to ‘log file sync’ event.
- in a healthy database 90 % of GCS Log flush Sync should be 2ms ore less
- Always check related instances for LOG FILE SYNC event as this event also reduces the Redo I/O bandwith
- If gcs log flush sync wait event is significant then you need to understand your LGWR performance ( you may use lfsdiag,sql script )
Monitor gv$session wait events for LGWR, LMS processes
SQL> select w.inst_id, w.sid,w.program, w.event , w.STATE , w.SECONDS_IN_WAIT SEC_in_WAIT , w.P1TEXT || ': '  || w.P1 || ' - '    || w.P2TEXT  || ': '  || w.P2 || ' - '

      || w.P3TEXT || ': '  || w.P3 as P1_P2_P3 from gv$session w where

        program like '%LGWR%' or program like '%LMS%' or  program like '%JDBC%' order by program;

INST_ID        SID PROGRAM                          EVENT                         STATE             SEC_IN_WAIT P1_P2_P3

------- ---------- -------------------------------- ---------------------------- ------------------ ----------- ---------------------------------------------

      2         18 oracle@grac42.example.com (LGWR) log file parallel write      WAITED SHORT TIME  0 files: 1 - blocks: 1 - requests: 1

      2         13 oracle@grac42.example.com (LMS0) gcs log flush sync           WAITING            0 waittime: 30 - poll: 0 - event: 138
Gcs Log Flush Sync Wait histogramms
Script:@event_histogram_from_awr.sql

Acceptable gcs log flush sync histogramm (90 % of wait requests returns in less that 2 ms )

BEGIN_INTERVAL_TIME            Inst    SNAP_ID EVENT_NAME        WAIT_TIME_MILLI WAIT_COUNT

------------------------------ ---- ---------- ----------------  --------------- ----------

28-NOV-13 04.24.27.507 PM         1       876 gcs log flush sync              1      58940

                                  1       876 gcs log flush sync              2      51775

                                  1       876 gcs log flush sync              4       1433

                                  1       876 gcs log flush sync              8        605

                                  1       876 gcs log flush sync             16        271

                                  1       876 gcs log flush sync             32        181

                                  1       876 gcs log flush sync             64        133

                                  1       876 gcs log flush sync            128         78

                                  1       876 gcs log flush sync            256         7

                                  1       876 gcs log flush sync            512         1

Gcs log flush sync wait histogramm with high wait times

28-NOV-13 04.25.58.021 PM         1       877 gcs log flush sync               1        304

                                  1       877 gcs log flush sync               2        662

                                  1       877 gcs log flush sync               4      11816

                                  1       877 gcs log flush sync               8      46981

                                  1       877 gcs log flush sync              16      68740

                                  1       877 gcs log flush sync              32        202

                                  1       877 gcs log flush sync              64        141

                                  1       877 gcs log flush sync             128         83

                                  1       877 gcs log flush sync             256          8

                                  1       877 gcs log flush sync             512          1
References
1、event_histogram_from_awr.sql
set linesize 180

set pagesize 200

col BEGIN_INTERVAL_TIME format A30

col instance_number format 99 head Inst

break on  BEGIN_INTERVAL_TIME

/*

define event_name="gcs log flush sync"

define event_name="log file sync"

*/

select snaps.begin_interval_time, snaps.instance_number,snaps.snap_id,hist.event_name , hist.wait_time_milli, hist.wait_count

  from dba_hist_event_histogram hist, dba_hist_snapshot snaps

 where snaps.snap_id = hist.snap_id and snaps.instance_number = hist.instance_number and

   snaps.begin_interval_time > sysdate - 1/12   -- sysdate - 1/12 -> display AWR reports from the last 2 hours

   AND hist.event_name = lower ('&&event_name')

 order by  snaps.snap_id , snaps.instance_number, wait_time_milli;
Contents
Overview : gcs log flush sync wait event
- Before sending a reconstructed CR block or CUR block, LMS will verify that corresponding redo vectors are flushed to disk.
- LMS will flush request a log flush when there are uncomitted transactions within the required block -> Increasing commit frequence will increase this wait event too
- Use lfsdiag.sql script to understand the wait time suffered by LGWR process
- If the redo vector are not flushed, LMS on node2 need to wait for ‘gcs log flush sync’ event after requesting LGWR for a log flush, analogous to ‘log file sync’ event.
- in a healthy database 90 % of GCS Log flush Sync should be 2ms ore less
- Always check related instances for LOG FILE SYNC event as this event also reduces the Redo I/O bandwith
- If gcs log flush sync wait event is significant then you need to understand your LGWR performance ( you may use lfsdiag,sql script )
Monitor gv$session wait events for LGWR, LMS processes
SQL> select w.inst_id, w.sid,w.program, w.event , w.STATE , w.SECONDS_IN_WAIT SEC_in_WAIT , w.P1TEXT || ': '  || w.P1 || ' - '    || w.P2TEXT  || ': '  || w.P2 || ' - '

      || w.P3TEXT || ': '  || w.P3 as P1_P2_P3 from gv$session w where

        program like '%LGWR%' or program like '%LMS%' or  program like '%JDBC%' order by program;

INST_ID        SID PROGRAM                          EVENT                         STATE             SEC_IN_WAIT P1_P2_P3

------- ---------- -------------------------------- ---------------------------- ------------------ ----------- ---------------------------------------------

      2         18 oracle@grac42.example.com (LGWR) log file parallel write      WAITED SHORT TIME  0 files: 1 - blocks: 1 - requests: 1

      2         13 oracle@grac42.example.com (LMS0) gcs log flush sync           WAITING            0 waittime: 30 - poll: 0 - event: 138
Gcs Log Flush Sync Wait histogramms
Script:@event_histogram_from_awr.sql

Acceptable gcs log flush sync histogramm (90 % of wait requests returns in less that 2 ms )

BEGIN_INTERVAL_TIME            Inst    SNAP_ID EVENT_NAME        WAIT_TIME_MILLI WAIT_COUNT

------------------------------ ---- ---------- ----------------  --------------- ----------

28-NOV-13 04.24.27.507 PM         1       876 gcs log flush sync              1      58940

                                  1       876 gcs log flush sync              2      51775

                                  1       876 gcs log flush sync              4       1433

                                  1       876 gcs log flush sync              8        605

                                  1       876 gcs log flush sync             16        271

                                  1       876 gcs log flush sync             32        181

                                  1       876 gcs log flush sync             64        133

                                  1       876 gcs log flush sync            128         78

                                  1       876 gcs log flush sync            256         7

                                  1       876 gcs log flush sync            512         1

Gcs log flush sync wait histogramm with high wait times

28-NOV-13 04.25.58.021 PM         1       877 gcs log flush sync               1        304

                                  1       877 gcs log flush sync               2        662

                                  1       877 gcs log flush sync               4      11816

                                  1       877 gcs log flush sync               8      46981

                                  1       877 gcs log flush sync              16      68740

                                  1       877 gcs log flush sync              32        202

                                  1       877 gcs log flush sync              64        141

                                  1       877 gcs log flush sync             128         83

                                  1       877 gcs log flush sync             256          8

                                  1       877 gcs log flush sync             512          1

资料二:
How To Solve “gcs log flush sync” Wait Event
In busy databases you may encounter this wait event. The general reason is the low redo log I/O performance or the slow interconnect connection.
As a solution of this wait event;
- You can increase the performance of Interconnect network. For example, instead of 1g cards, you can create an interconnect interface on 10g cards.
- You can move Redo log files onto faster disks.
- Or, you can set the value of the _cr_server_log_flush parameter to false. This is not suggested.
You can change the value of the parameter as follows.
|
1
2
3
|
SQL> alter system set "_cr_server_log_flush"=false scope=both sid='*';
System altered.
|
RAC Wait Event: gcs log flush sync 等待事件 转的更多相关文章
- RAC 性能分析 - 'log file sync' 等待事件
简介 本文主要讨论 RAC 数据库中的'log file sync' 等待事件.RAC 数据库中的'log file sync' 等待事件要比单机数据库中的'log file sync' 等待事件复杂 ...
- 完全揭秘log file sync等待事件-转自itpub
原贴地址:http://www.itpub.net/thread-1777234-1-1.html 谢谢 guoyJoe 老大 这里先引用一下tanel poder大师的图: 什么是log fil ...
- Oracle数据库由dataguard备库引起的log file sync等待
导读: 最近数据库经常出现会话阻塞的报警,过一会又会自动消失,昨天晚上恰好发生了一次,于是赶紧进行了查看,不看不知道,一看吓一跳,发现是由dataguard引起的log file sync等待.我们知 ...
- log file sync等待超高案例浅析
监控工具DPA发现海外一台Oracle数据库服务器DB Commit Time指标告警,超过红色告警线(40毫秒左右,黄色告警是10毫秒,红色告警线是20毫秒),如下截图所示,生成了对应的时段的AWR ...
- log file sync等待超高一例
这是3月份某客户的情况,原因是server硬件故障后进行更换之后,业务翻译偶尔出现提交缓慢的情况.我们先来看下awr的情况. 我们能够看到,该系统的load profile信息事实上并不高,每秒才21 ...
- log buffer space等待事件
最近,我们有台服务器在delete操作期间发现一直在等待log buffer space,其他节点就没与这个问题.经查,向重做缓冲区上写入重做记录的进程,为了确保拥有重做缓冲区内必要的空间,需要获得r ...
- RAC性能分析 - gc buffer busy acquire 等待事件
概述---------------------gc buffer busy是RAC数据库中常见的等待事件,11g开始gc buffer busy分为gc buffer busy acquire和gc ...
- oracle之 等待事件LOG FILE SYNC (awr)优化
log file sycn是ORACLE里最普遍的等待事件之一,一般log file sycn的等待时间都非常短 1-5ms,不会有什么问题,但是一旦出问题,往往都比较难解决.什么时候会产生log f ...
- ORACLE等待事件: log file parallel write
log file parallel write概念介绍 log file parallel write 事件是LGWR进程专属的等待事件,发生在LGWR将日志缓冲区(log_buffer)中的重做日志 ...
随机推荐
- 再谈AbstractQueuedSynchronizer1:独占模式
关于AbstractQueuedSynchronizer JDK1.5之后引入了并发包java.util.concurrent,大大提高了Java程序的并发性能.关于java.util.concurr ...
- 在linux(centos)系统安装nginx教程
最近在切换服务器操作系统,简单记录一下 一.安装nginx需要如下环境 1.gcc 编译依赖gcc环境,如果没有gcc环境,需要安装gcc yum install gcc-c++ 2.PCRE ...
- js实现二分查找算法
二分查找:是一种搜索某个值的索引的算法. 基本条件:有序的数组. 思路:1.将数组折半,分成左右两个数组. 2.判断要查找的数和中间位置数值的大小,来判断要查找的数实在哪一半. 3.之后继续折半查找, ...
- Shell从入门到精通进阶之四:流程控制
流程控制是改变程序运行顺序的指令. 4.1 if语句 4.1.1 单分支 if 条件表达式; then 命令 fi 示例: #!/bin/bash N=10 if [ $N -gt 5 ]; then ...
- 从PRISM开始学WPF(三)Prism-Region-更新至Prism7.1
[7.1update]在开始前,我们先看下版本7.1中在本实例中的改动. 首先,项目文件中没有了Bootstrapper.cs,在上一篇的末尾,我们说过了,在7.1中,不见推荐使用Bootstrapp ...
- 使用JsonProperty Attribute修改返回json
使用JsonProperty Attribute修改返回 json 值的name 本例使用JsonPropertyAttribute在序列化为JSON时更改属性的名称. public class Vi ...
- 包、继承以及 LeetCode 27、28题
1 package.import 和 import static 1.1 Package Java 引入了包(Package)机制,提供了类的多层命名空间,用于解决类的命名冲突.类文件管理问题.Jav ...
- C++系列总结——继承
前言 前面讲了封装,但封装只是隐藏了类内部实现.如果使用多态隐藏类本身的话,只有封装是不够的,还需要继承. 继承 通过封装.我们把一些相关的函数和变量包裹在了一起,这些函数和变量就叫做类的成员函数和成 ...
- 将传统 WPF 程序迁移到 DotNetCore 3.0
介绍 由于历史原因,基于 Windows 平台存在着大量的基于 .NetFramework 开发的 WPF 和 WinForm 相关程序,如果将这些程序全部基于 DotNetCore 3.0 重写一遍 ...
- 禁用事件event默认行为
在大多数情况下,为事件处理函数返回false,可以防止默认的事件行为.例如,默认情况下点击一个<a>元素,页面会跳转到该元素href属性指定的页. js中return false作用一般是 ...