使用WCF的Trace与Message Log功能
原创地址:http://www.cnblogs.com/jfzhu/p/4030008.html
转载请注明出处
前面介绍过如何创建一个WCF Service http://www.cnblogs.com/jfzhu/p/4025448.html,本文介绍一下如何开启与查看WCF的Message Log和Trace Log。
(一)使用WCF Service Configuration Editor开启Trace与Message Log功能
如果安装了Visual Studio,我们可以使用WCF Service Configuration Editor来开启WCF的Trace和Message Log的功能。Trace和Log既可以在客户端做,也可以在服务器端做。
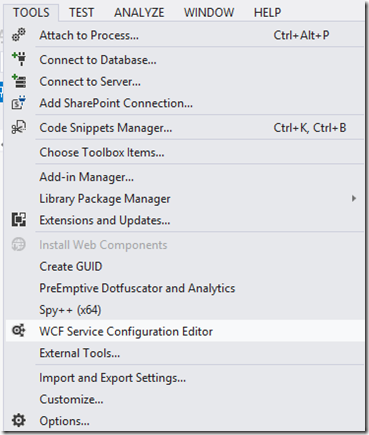
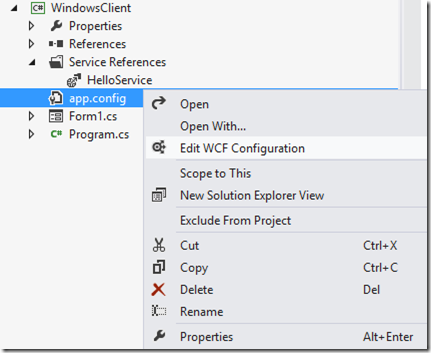
有两种方式可以打开WCF Service Configuration Editor
(1)Visual Studio Tools –> WCF Service Configuration Editor:
(2)直接在Solution Explorer中右键点击app.config –> Edit WCF Configuration:
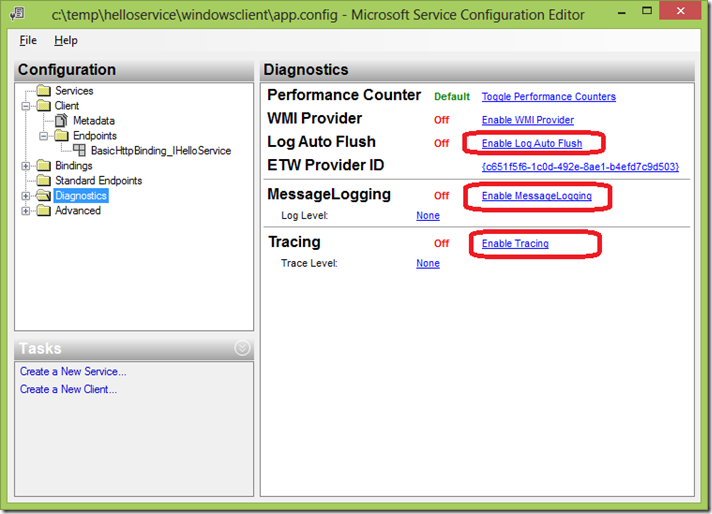
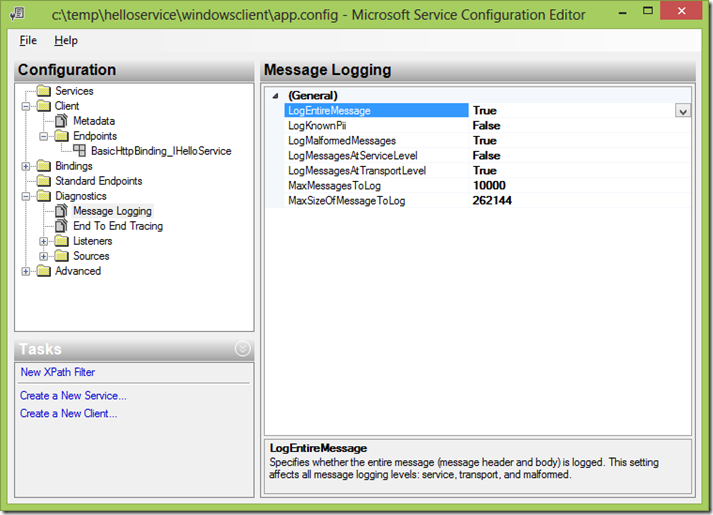
打开WCF Service Configuration Editor后,我们需要点击
- Enable Log Auto-Flush
- Enable MessageLogging
- Enable Tracing
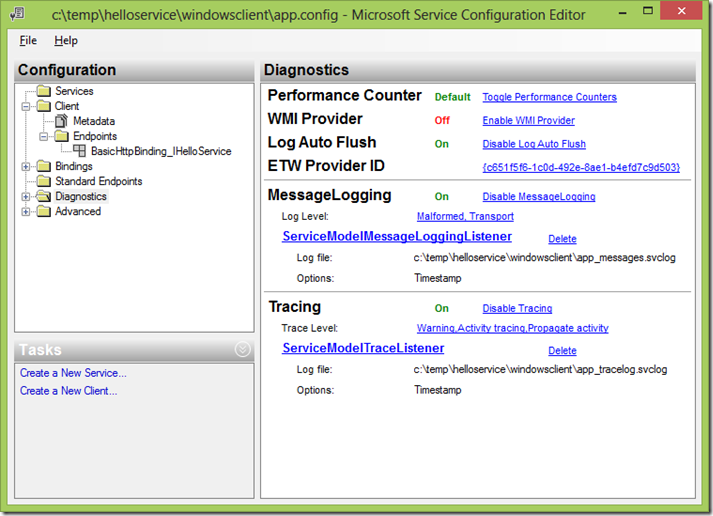
还要将LogEntireMessage改为True:
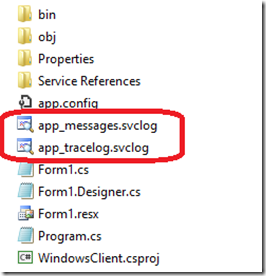
保存配置文件,可以看到文件夹中多了两个文件,一个是message log文件,另一个是trace log文件:
(二)调用WCF Service
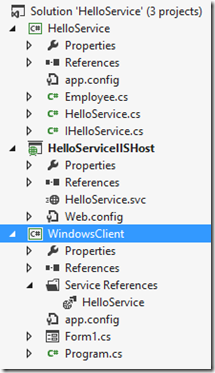
演示的解决方案如下:
Employee.cs:
namespace HelloService

{

    [DataContract(Namespace="http://jfzhu.com/2014/10/16/Employee")]

    public class Employee

    {

        private int id;

        private string name;

        private DateTime birthdate;

        [DataMember(Name="Id", Order=)]

        public int Id

        {

            get { return id; }

            set { id = value; }

        }

        [DataMember(Order = )]

        public string Name

        {

            get { return name; }

            set { name = value; }

        }

        [DataMember(Order = )]

        public DateTime Birthdate

        {

            get { return birthdate; }

            set { birthdate = value; }

        }

    }

}
IHelloService.cs
namespace HelloService

{

    [ServiceContract(Name = "IHelloService")]

    public interface IHelloService

    {

        [OperationContract(Name="GetMessage")]

        string GetMessage(string name);

        [OperationContract]

        Employee GetEmployee(int id);

    }

}
HelloService.cs
namespace HelloService

{

    public class HelloService : IHelloService

    {

        public string GetMessage(string name)

        {

            return "Hello " + name;

        }

        public Employee GetEmployee(int id)

        {

            return new Employee() { Id = id, Name="Neil Klugman", Birthdate=new DateTime(, , )};

        }

    }

}
Host的web.config
<?xml version="1.0" encoding="utf-8"?>

<configuration>

  <system.serviceModel>

    <diagnostics>

      <messageLogging logEntireMessage="true" logMalformedMessages="true"

        logMessagesAtTransportLevel="true" />

    </diagnostics>

    <services>

      <service name="HelloService.HelloService" behaviorConfiguration="metaBehavior">

        <endpoint address="HelloService" binding="basicHttpBinding" contract="HelloService.IHelloService"></endpoint>

        <endpoint address="mex" binding="mexHttpBinding" contract="IMetadataExchange"></endpoint>

        <host>

          <baseAddresses>

            <add baseAddress="http://localhost:8080"/>

          </baseAddresses>

        </host>

      </service>

    </services>

    <behaviors>

      <serviceBehaviors>

        <behavior name="metaBehavior">

          <serviceMetadata httpGetEnabled="true"/>

        </behavior>

      </serviceBehaviors>

    </behaviors>

  </system.serviceModel>

</configuration>
Client的Form1.cs
namespace WindowsClient

{

    public partial class Form1 : Form

    {

        public Form1()

        {

            InitializeComponent();

        }

        private void buttonGetMessage_Click(object sender, EventArgs e)

        {

            HelloService.HelloServiceClient client = new HelloService.HelloServiceClient();

            labelGetMessage.Text = client.GetMessage(textBoxGetMessage.Text);

        }

        private void buttonGetEmployee_Click(object sender, EventArgs e)

        {

            HelloService.HelloServiceClient client = new HelloService.HelloServiceClient();

            HelloService.Employee employee = client.GetEmployee(Convert.ToInt32(textBoxGetEmployee.Text));

            labelId.Text = "Id: " + employee.Id.ToString();

            labelName.Text = "Name: " + employee.Name;

            labelBirthdate.Text = "Birthdate: " + employee.Birthdate.ToString("yyyy-MM-dd");

        }

    }

}
Client的app.config
<?xml version="1.0" encoding="utf-8" ?>

<configuration>

    <system.diagnostics>

        <sources>

            <source name="System.ServiceModel.MessageLogging" switchValue="Warning,ActivityTracing">

                <listeners>

                    <add type="System.Diagnostics.DefaultTraceListener" name="Default">

                        <filter type="" />

                    </add>

                    <add name="ServiceModelMessageLoggingListener">

                        <filter type="" />

                    </add>

                </listeners>

            </source>

            <source propagateActivity="true" name="System.ServiceModel" switchValue="Warning,ActivityTracing">

                <listeners>

                    <add type="System.Diagnostics.DefaultTraceListener" name="Default">

                        <filter type="" />

                    </add>

                    <add name="ServiceModelTraceListener">

                        <filter type="" />

                    </add>

                </listeners>

            </source>

        </sources>

        <sharedListeners>

            <add initializeData="c:\temp\helloservice\windowsclient\app_messages.svclog"

                type="System.Diagnostics.XmlWriterTraceListener, System, Version=4.0.0.0, Culture=neutral, PublicKeyToken=b77a5c561934e089"

                name="ServiceModelMessageLoggingListener" traceOutputOptions="Timestamp">

                <filter type="" />

            </add>

            <add initializeData="c:\temp\helloservice\windowsclient\app_tracelog.svclog"

                type="System.Diagnostics.XmlWriterTraceListener, System, Version=4.0.0.0, Culture=neutral, PublicKeyToken=b77a5c561934e089"

                name="ServiceModelTraceListener" traceOutputOptions="Timestamp">

                <filter type="" />

            </add>

        </sharedListeners>

        <trace autoflush="true" />

    </system.diagnostics>

    <system.serviceModel>

        <diagnostics>

            <messageLogging logEntireMessage="true" logMalformedMessages="true"

                logMessagesAtTransportLevel="true" />

        </diagnostics>

        <bindings>

            <basicHttpBinding>

                <binding name="BasicHttpBinding_IHelloService" />

            </basicHttpBinding>

        </bindings>

        <client>

            <endpoint address="http://192.168.6.47:8080/HelloService.svc/HelloService"

                binding="basicHttpBinding" bindingConfiguration="BasicHttpBinding_IHelloService"

                contract="HelloService.IHelloService" name="BasicHttpBinding_IHelloService" />

        </client>

    </system.serviceModel>

</configuration>
可以看到整个<system.diagnostics>部分都是用来配置Message Log和Trace Log的。
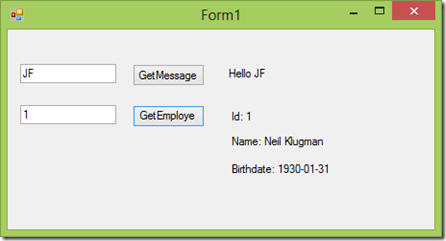
运行客户端,分别点击GetMessage按钮和GetEmployee按钮,调用两个WCF Service。
(三)使用Microsoft Service Trace Viewer查看Message Log
使用Microsoft Service Trace Viewer来看Message Log文件app_messages.svclog(除了直接双击文件可以打开查看之外,也可以在VS Command Prompt上键入命令 SVCTRACEVIWER)。
因为调用了两次WCF Service,所以在左边面板看到两个Activity。
右边面板上面的第一条记录是Request,第二条记录是Reponse。
GetMessage的request
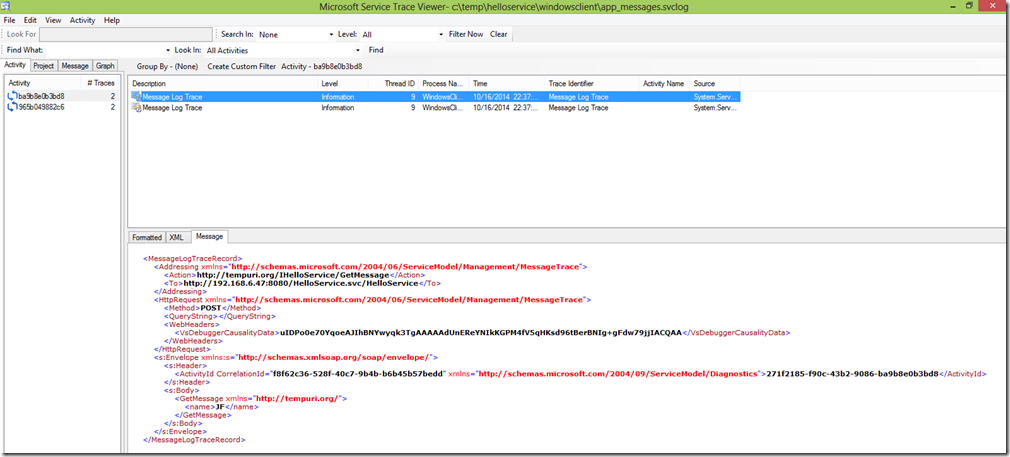
<MessageLogTraceRecord>

  <Addressing xmlns="http://schemas.microsoft.com/2004/06/ServiceModel/Management/MessageTrace">

    <Action>http://tempuri.org/IHelloService/GetMessage</Action>

    <To>http://192.168.6.47:8080/HelloService.svc/HelloService</To>

  </Addressing>

  <HttpRequest xmlns="http://schemas.microsoft.com/2004/06/ServiceModel/Management/MessageTrace">

    <Method>POST</Method>

    <QueryString></QueryString>

    <WebHeaders>

      <VsDebuggerCausalityData>uIDPo0e70YqoeAJIhBNYwyqk3TgAAAAAdUnEReYNIkKGPM4fV5qHKsd96tBerBNIg+gFdw79jjIACQAA</VsDebuggerCausalityData>

    </WebHeaders>

  </HttpRequest>

  <s:Envelope xmlns:s="http://schemas.xmlsoap.org/soap/envelope/">

    <s:Header>

      <ActivityId CorrelationId="f8f62c36-528f-40c7-9b4b-b6b45b57bedd" xmlns="http://schemas.microsoft.com/2004/09/ServiceModel/Diagnostics">271f2185-f90c-43b2-9086-ba9b8e0b3bd8</ActivityId>

    </s:Header>

    <s:Body>

      <GetMessage xmlns="http://tempuri.org/">

        <name>JF</name>

      </GetMessage>

    </s:Body>

  </s:Envelope>

</MessageLogTraceRecord>
GetMessage的response
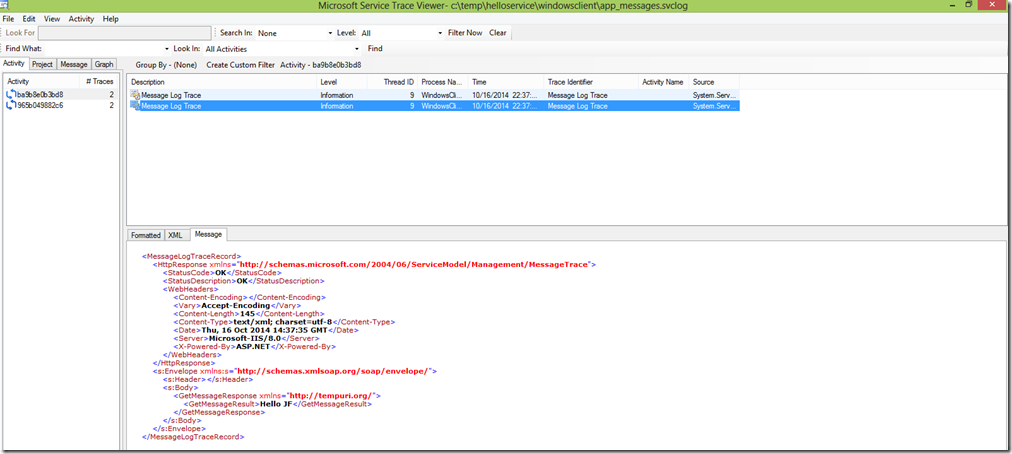
<MessageLogTraceRecord>

  <HttpResponse xmlns="http://schemas.microsoft.com/2004/06/ServiceModel/Management/MessageTrace">

    <StatusCode>OK</StatusCode>

    <StatusDescription>OK</StatusDescription>

    <WebHeaders>

      <Content-Encoding></Content-Encoding>

      <Vary>Accept-Encoding</Vary>

      <Content-Length>145</Content-Length>

      <Content-Type>text/xml; charset=utf-8</Content-Type>

      <Date>Thu, 16 Oct 2014 14:37:35 GMT</Date>

      <Server>Microsoft-IIS/8.0</Server>

      <X-Powered-By>ASP.NET</X-Powered-By>

    </WebHeaders>

  </HttpResponse>

  <s:Envelope xmlns:s="http://schemas.xmlsoap.org/soap/envelope/">

    <s:Header></s:Header>

    <s:Body>

      <GetMessageResponse xmlns="http://tempuri.org/">

        <GetMessageResult>Hello JF</GetMessageResult>

      </GetMessageResponse>

    </s:Body>

  </s:Envelope>

</MessageLogTraceRecord>
GetEmployee的request
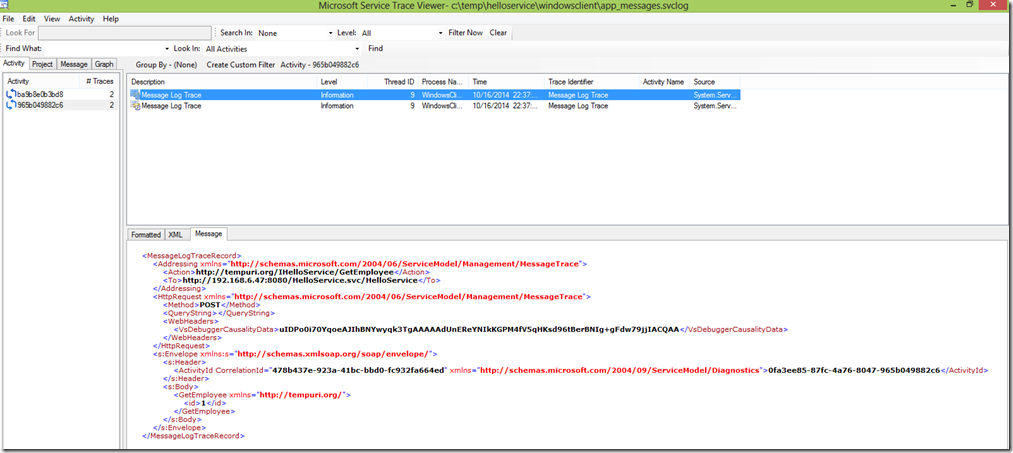
<MessageLogTraceRecord>

  <Addressing xmlns="http://schemas.microsoft.com/2004/06/ServiceModel/Management/MessageTrace">

    <Action>http://tempuri.org/IHelloService/GetEmployee</Action>

    <To>http://192.168.6.47:8080/HelloService.svc/HelloService</To>

  </Addressing>

  <HttpRequest xmlns="http://schemas.microsoft.com/2004/06/ServiceModel/Management/MessageTrace">

    <Method>POST</Method>

    <QueryString></QueryString>

    <WebHeaders>

      <VsDebuggerCausalityData>uIDPo0i70YqoeAJIhBNYwyqk3TgAAAAAdUnEReYNIkKGPM4fV5qHKsd96tBerBNIg+gFdw79jjIACQAA</VsDebuggerCausalityData>

    </WebHeaders>

  </HttpRequest>

  <s:Envelope xmlns:s="http://schemas.xmlsoap.org/soap/envelope/">

    <s:Header>

      <ActivityId CorrelationId="478b437e-923a-41bc-bbd0-fc932fa664ed" xmlns="http://schemas.microsoft.com/2004/09/ServiceModel/Diagnostics">0fa3ee85-87fc-4a76-8047-965b049882c6</ActivityId>

    </s:Header>

    <s:Body>

      <GetEmployee xmlns="http://tempuri.org/">

        <id>1</id>

      </GetEmployee>

    </s:Body>

  </s:Envelope>

</MessageLogTraceRecord>
GetEmployee的response
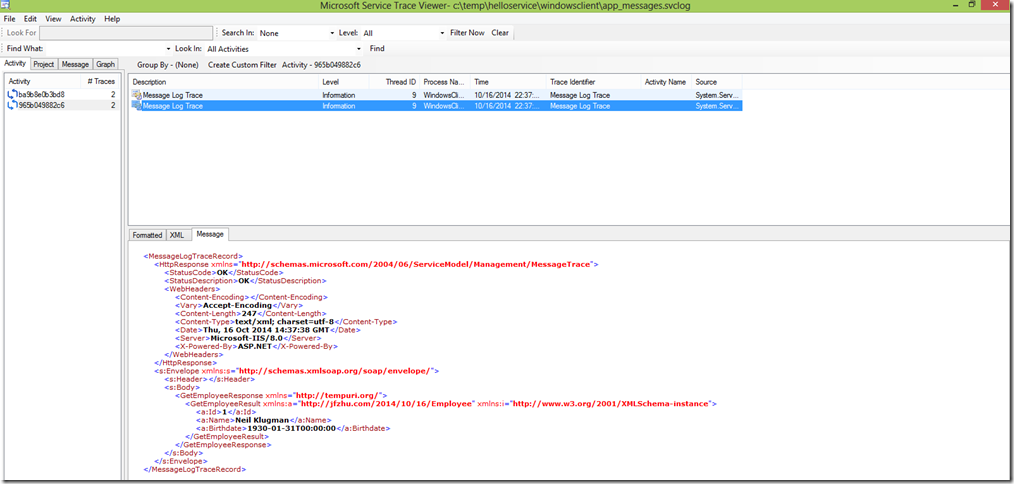
<MessageLogTraceRecord>

  <HttpResponse xmlns="http://schemas.microsoft.com/2004/06/ServiceModel/Management/MessageTrace">

    <StatusCode>OK</StatusCode>

    <StatusDescription>OK</StatusDescription>

    <WebHeaders>

      <Content-Encoding></Content-Encoding>

      <Vary>Accept-Encoding</Vary>

      <Content-Length>247</Content-Length>

      <Content-Type>text/xml; charset=utf-8</Content-Type>

      <Date>Thu, 16 Oct 2014 14:37:38 GMT</Date>

      <Server>Microsoft-IIS/8.0</Server>

      <X-Powered-By>ASP.NET</X-Powered-By>

    </WebHeaders>

  </HttpResponse>

  <s:Envelope xmlns:s="http://schemas.xmlsoap.org/soap/envelope/">

    <s:Header></s:Header>

    <s:Body>

      <GetEmployeeResponse xmlns="http://tempuri.org/">

        <GetEmployeeResult xmlns:a="http://jfzhu.com/2014/10/16/Employee" xmlns:i="http://www.w3.org/2001/XMLSchema-instance">

          <a:Id>1</a:Id>

          <a:Name>Neil Klugman</a:Name>

          <a:Birthdate>1930-01-31T00:00:00</a:Birthdate>

        </GetEmployeeResult>

      </GetEmployeeResponse>

    </s:Body>

  </s:Envelope>

</MessageLogTraceRecord>
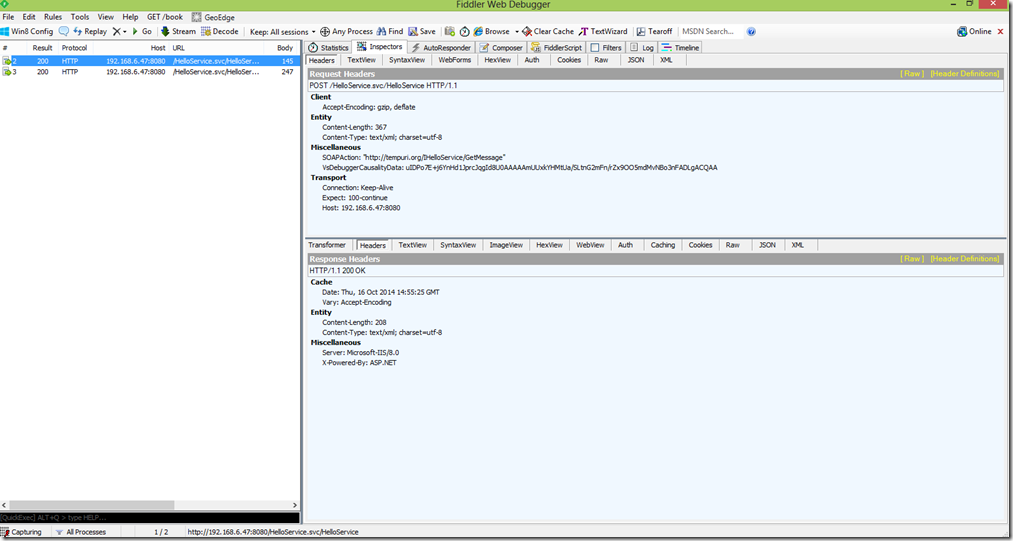
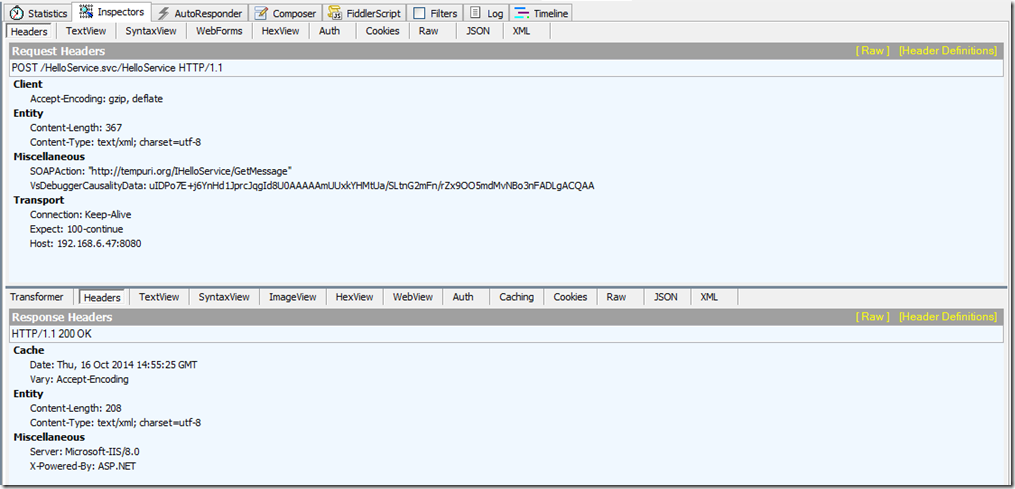
(四)使用Fiddler来查看Message Log
如果使用Fiddler来查看Message Log的话,就不需要使用WCF Service Configuration Editor开启Log功能了。下图Fiddler中左边面板的两条记录分表表示两次WCF Service的调用。
右边面板上半部分表示request,下半部分表示response,基本和Microsoft Service Trace Viewer的布局差不多。
GetMessage的调用:
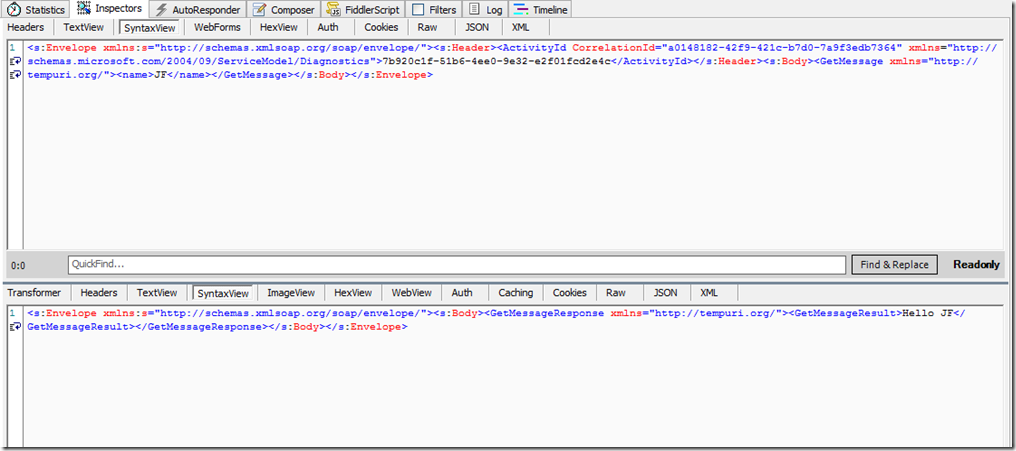
request:
<s:Envelope xmlns:s="http://schemas.xmlsoap.org/soap/envelope/">

  <s:Header>

    <ActivityId CorrelationId="a0148182-42f9-421c-b7d0-7a9f3edb7364" xmlns="http://schemas.microsoft.com/2004/09/ServiceModel/Diagnostics">7b920c1f-51b6-4ee0-9e32-e2f01fcd2e4c</ActivityId>

  </s:Header>

  <s:Body>

    <GetMessage xmlns="http://tempuri.org/">

      <name>JF</name>

    </GetMessage>

  </s:Body>

</s:Envelope>
response:
<s:Envelope xmlns:s="http://schemas.xmlsoap.org/soap/envelope/">

  <s:Body>

    <GetMessageResponse xmlns="http://tempuri.org/">

      <GetMessageResult>Hello JF</GetMessageResult>

    </GetMessageResponse>

  </s:Body>

</s:Envelope>
GetEmployee的调用:
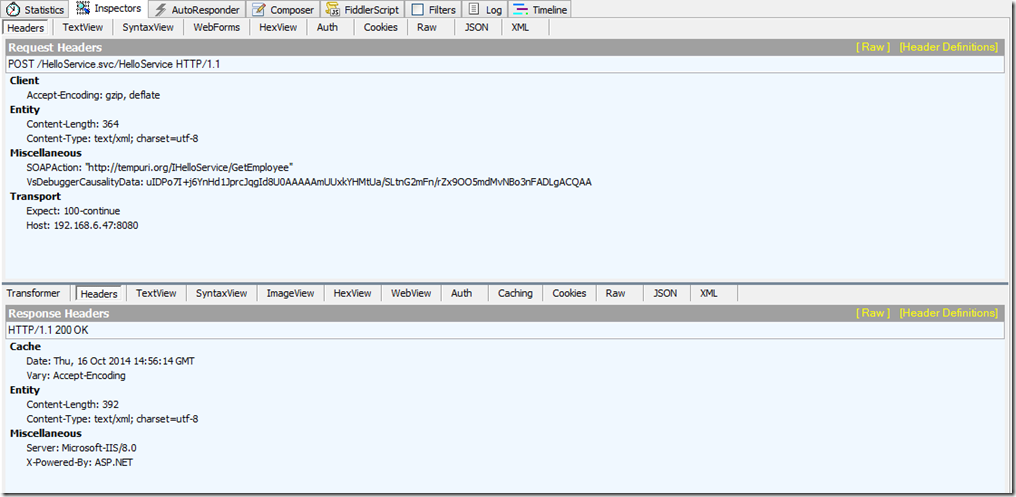
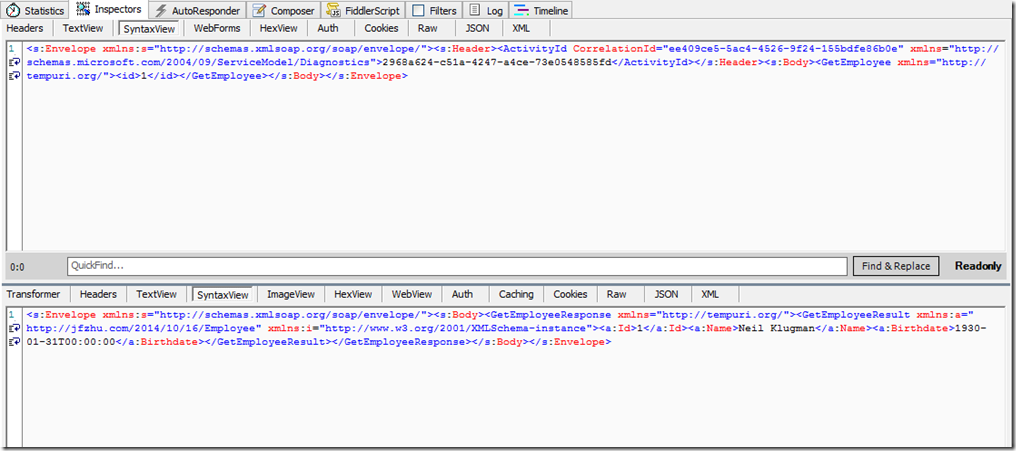
request:
<s:Envelope xmlns:s="http://schemas.xmlsoap.org/soap/envelope/">

  <s:Header>

    <ActivityId CorrelationId="ee409ce5-5ac4-4526-9f24-155bdfe86b0e" xmlns="http://schemas.microsoft.com/2004/09/ServiceModel/Diagnostics">2968a624-c51a-4247-a4ce-73e0548585fd</ActivityId>

  </s:Header>

  <s:Body>

    <GetEmployee xmlns="http://tempuri.org/">

      <id>1</id>

    </GetEmployee>

  </s:Body>

</s:Envelope>
response:
<s:Envelope xmlns:s="http://schemas.xmlsoap.org/soap/envelope/">

  <s:Body>

    <GetEmployeeResponse xmlns="http://tempuri.org/">

      <GetEmployeeResult xmlns:a="http://jfzhu.com/2014/10/16/Employee" xmlns:i="http://www.w3.org/2001/XMLSchema-instance">

        <a:Id>1</a:Id>

        <a:Name>Neil Klugman</a:Name>

        <a:Birthdate>1930-01-31T00:00:00</a:Birthdate>

      </GetEmployeeResult>

    </GetEmployeeResponse>

  </s:Body>

</s:Envelope>
(五)总结
- Visual Studio提供了自己的Message Log和Trace Log的功能,本文主要演示了如何开启他们,以及如何查看Message Log。
- 开启这些功能可以使用WCF Service Configuration Editor。
- 查看这些Log可以使用Microsoft Service Trace Viewer。
- Logging功能可以在客户端做也可以在服务器端做。
- 不使用微软提供的工具,使用Fiddler也可以监控到调用WCF Service时发送和收到的消息。

使用WCF的Trace与Message Log功能的更多相关文章
- 关于Quartz.NET作业调度框架的一点小小的封装,实现伪AOP写LOG功能
Quartz.NET是一个非常强大的作业调度框架,适用于各种定时执行的业务处理等,类似于WINDOWS自带的任务计划程序,其中运用Cron表达式来实现各种定时触发条件是我认为最为惊喜的地方. Quar ...
- how to do error handing with WCF by using attributes to log your errors z
There are multiple ways to do error handling in WCF as listed by Pedram Rezaei Blog. The default way ...
- XDebug 自动开启PHP Stack Trace, 导致PHP Log 超1G
昨天早上突然发现测试服务器空间满了,用du挨个文件夹查看,发现是php debug log占地极大,有的log直接有1G,打开后发现极其多的php stack trace. 立刻到主服务器查看,主服务 ...
- firefox的console log功能
http://www.ruanyifeng.com/blog/2011/03/firebug_console_tutorial.html Firebug是网页开发的利器,能够极大地提升工作效率. 但是 ...
- 如何修改SVN已提交项目的message log
直接在TortoiseSVN中修改过往日志,会提示: DAV request failed;it's possible that the repository's pre-revprop-change ...
- WCF安全3-Transport与Message安全模式
概述: WCF的安全传输主要涉及认证.消息一致性和机密性三个主题.WCF采用两种不同的机制来解决这三个涉及传输安全的问题,一般将它们成为不同的安全模式,即Transport安全模式和Message安全 ...
- Log功能
目录控制开关,若存在则创建log文件,输出. 宏函数,若debug打开,则输出. 多线程输出到同一文件. 通过mutex控制多个进程同时创建log文件.
- scrapy 的log功能
只需要在配置文件 setting.py文件中加入LOG_FILE = "mySpider.log"LOG_LEVEL = "INFO" Scrapy提供5层lo ...
- 使用Vuex打开log功能
vuex是一个比较好用的数据流管理库,可以用统一的流程来处理状态数据,但是,也正是因为这些流程,我们需要打一些log来观察流程是否会出现问题,具体方法如下: import Vue from 'vue' ...
随机推荐
- FMDB 排它锁
-------------------------------------基本操作------------------------------------- #import "ViewCon ...
- Centos 6.5 x64环境下 spark 1.6 maven 编译-- 已验证
Centos 6.5 x64 jdk 1.7 scala 2.10 maven 3.3.3 cd spark-1.6 export MAVEN_OPTS="-Xmx2g -XX:MaxPer ...
- [算法总结]partition (quicksort)
private int partition(int[] nums, int lo, int hi) { if (lo >= hi) { return lo; } int i = lo; int ...
- Mac AppleScript 自动完成按键
本人用AppleScript成功实现了打开锐捷app,并且在用户验证框输入我的用户密码,然后强制退出锐捷.(至于为什么这么做呢?用校园网的痛苦,一言难尽啊!) 学习以下内容,首先你要自行百度资料来学习 ...
- Cucumber(一): Preparation
Every time I wrote some code in ruby and executed our cucumber features I craved for something simil ...
- java中的反射简单实例
package club.reflection.entity.User; /** * 实体类 * */ public class User { public String name; private ...
- vsftp匿名用户搭建
./configure出现: 请装: 出现这个: 请装 然后: ln -sv /lib/security/pam_mysql.so /lib64/security/
- 2016 Multi-University Training Contest 2 D. Differencia
Differencia Time Limit: 10000/10000 MS (Java/Others) Memory Limit: 65536/65536 K (Java/Others)Tot ...
- MacOS下Express安装过程中遇到的问题
问题描述: 使用nmp install express -g命令全局安装express后,在终端使用express -V命令可以获取到express的版本号,但在引用express的项目运行时,会报缺 ...
- oracle 和c3p0 数据库的Time_Wait 过多问题的一个解决方案。
项目是B/S模式,放在linux服务器上,tomcat和oracle11g在一台服务器上,tomcat读取数据库采用C3P0连接池,一直比较稳定,所以也没有去管.后来把tomcat放在一台win200 ...