记一次查内存异常问题(续《记一次Web应用CPU偏高》)
继上一次查应用的CPU飙高问题(http://www.cnblogs.com/hzmark/p/JVM_CPU.html)过去10天了。上次只是定位到了是一个第三方包占用了大量的CPU使用,但没有细致的去查第三方包为什么占用了这么高的CPU,并且内存为什么如此诡异。总的来说上一次排查带来的收获是熟悉了JVM的工具使用和大致定位到了问题。
在上次排查问题之后,应用出现异常的频率还是较高,终下定决心再查一次,而这次排查的重点落在内存方面。因为怀疑CPU偏高是因为内存的异常导致频繁的GC引起的。
首先是JVM内存的状态:
S0和S1交替的用满,不停的在进行YGC。
使用jmap可以看到内存中那些对象使用了大量的内存:
下面是列出内存占用的方法(下图不是异常状态的时候的现象):
在异常状态的情况下看到的现象是class name:[B占用好几个G的内存,也就是byte数组占用了很大的内存。
结合上一次查CPU问题时定位到的问题代码:
仔细看出问题的线程:com.trilead.ssh2.StreamGobbler$GobblerThread.run
到这里为止都是通过上次排查CPU问题可以推测出来的,其实仔细一点耐心一点顺着com.trilead.ssh2.StreamGobbler$GobblerThread.run继续往下分析能定位到具体问题,但是到这里之后我才用了另一种方式去定位问题,那就是分析出现问题时的堆内存使用情况,下面是我的分析过程。
首先dump内存数据:
jmap -dump:format=b,file=xxx.bin 3230
其中xxx.bin是dump出来的文件,3230是pid
之后使用mat打开该文件(这边不介绍MAT的使用,可以自己查找帮助文档;我使用的是eclipse的mat插件,可以在官网上找到update的地址在线安装就可以了http://download.eclipse.org/mat/1.3.1/update-site/)
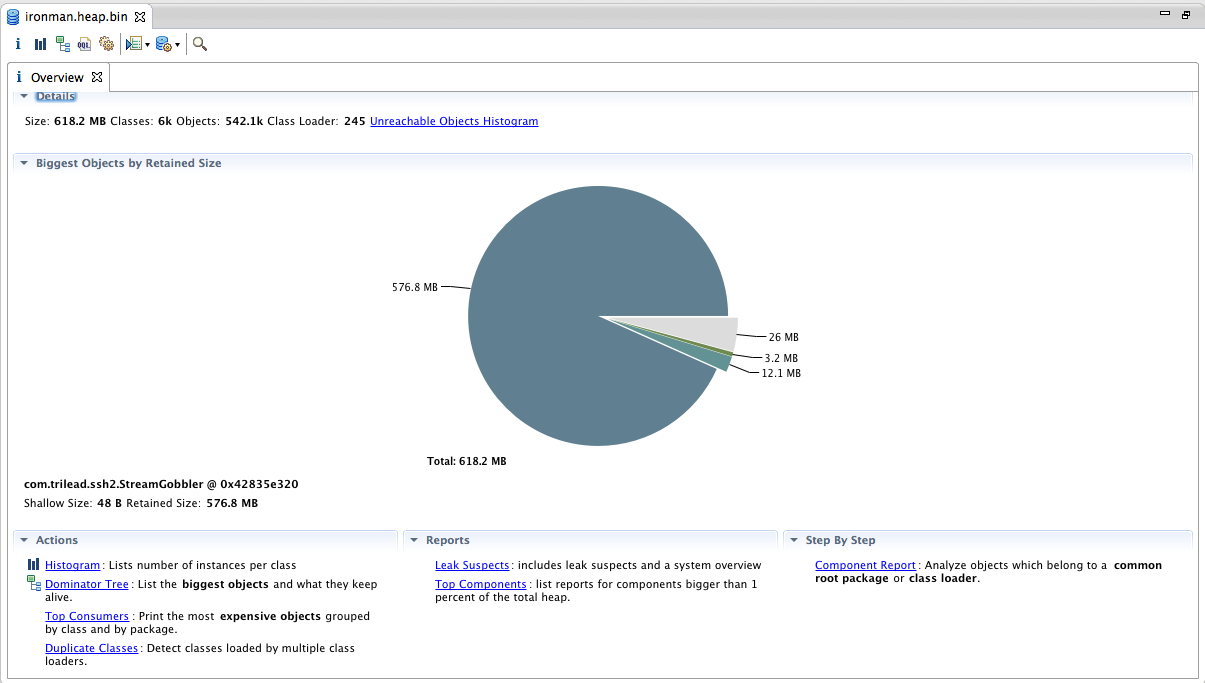
这是一个概览信息,可以看到总共使用了618M内存,而有一块直接占用了576M,那么问题肯定出现在这块内存中。
点到leak suspects会有一个系统分析的怀疑问题:
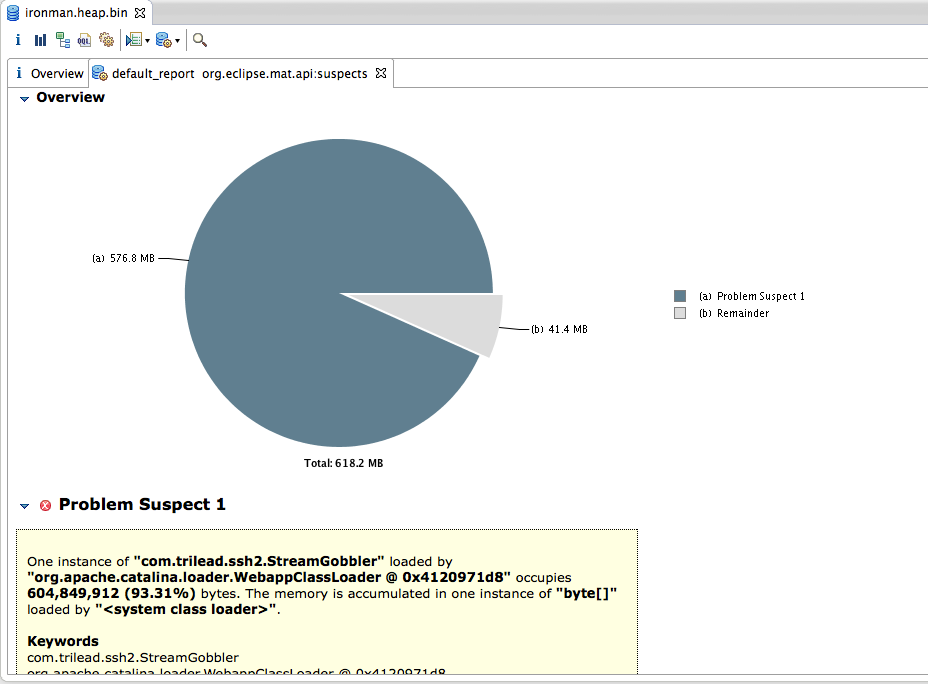
和上一步我们的猜想是一致的,问题出在最大的这个内存这里。和排查CPU时得出的结论也是一致的,问题出在第三方的包内。
点击detail内容可以看到具体是哪里占用了内存。
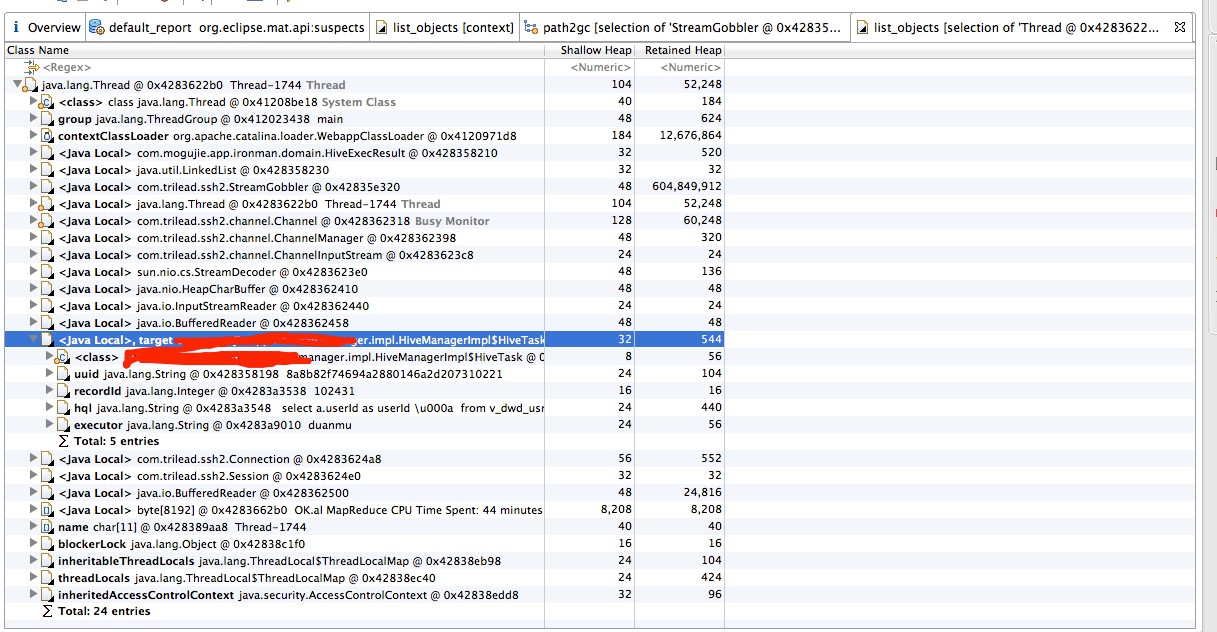
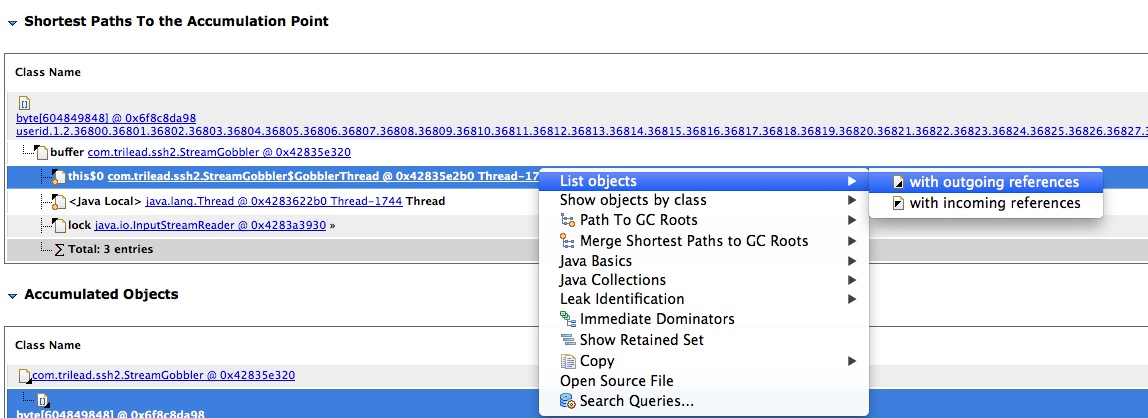 通过with outgoing references查看线程引用的对象,如下图所示:
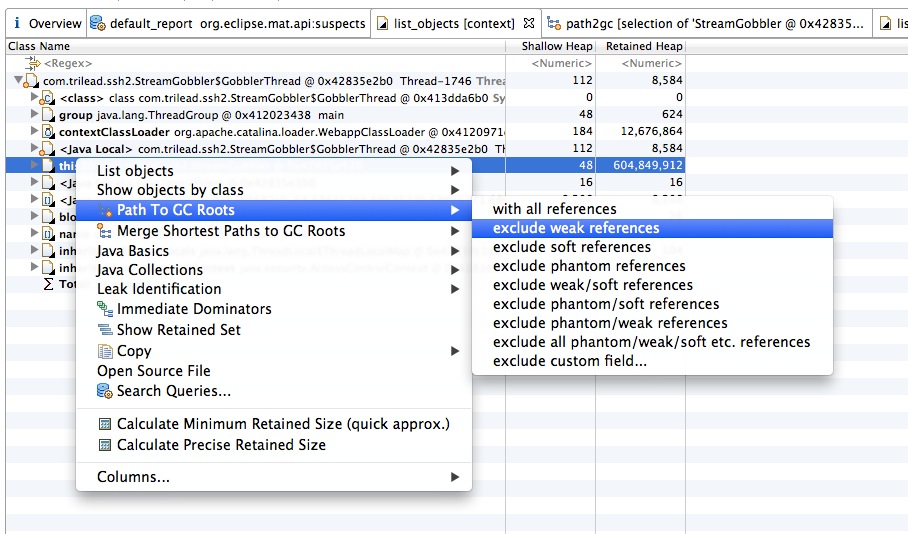
在找到使用内存最大的对象,查找他的引用,可以看到代码中是哪里引用了这块内存导致无法被回收
到这里位置就可以知道是自己起的线程保持了对内存的引用导致无法别回收。查自己写的代码已经可以精确的定位到问题。
(其实根据上次使用到一些JVM的工具已经可以发现问题,但是问了跟精确,顺便学习内存排查,所以有了MAT分析的过程)
下面是定位到问题代码之后的处理。
查看具体的代码:
 package com.trilead.ssh2;

 import java.io.IOException;

 import java.io.InputStream;

 import java.io.InterruptedIOException;

 /**

  * A <code>StreamGobbler</code> is an InputStream that uses an internal worker

  * thread to constantly consume input from another InputStream. It uses a buffer

  * to store the consumed data. The buffer size is automatically adjusted, if needed.

  * <p>

  * This class is sometimes very convenient - if you wrap a session's STDOUT and STDERR

  * InputStreams with instances of this class, then you don't have to bother about

  * the shared window of STDOUT and STDERR in the low level SSH-2 protocol,

  * since all arriving data will be immediatelly consumed by the worker threads.

  * Also, as a side effect, the streams will be buffered (e.g., single byte

  * read() operations are faster).

  * <p>

  * Other SSH for Java libraries include this functionality by default in

  * their STDOUT and STDERR InputStream implementations, however, please be aware

  * that this approach has also a downside:

  * <p>

  * If you do not call the StreamGobbler's <code>read()</code> method often enough

  * and the peer is constantly sending huge amounts of data, then you will sooner or later

  * encounter a low memory situation due to the aggregated data (well, it also depends on the Java heap size).

  * Joe Average will like this class anyway - a paranoid programmer would never use such an approach.

  * <p>

  * The term "StreamGobbler" was taken from an article called "When Runtime.exec() won't",

  * see http://www.javaworld.com/javaworld/jw-12-2000/jw-1229-traps.html.

  *

  * @author Christian Plattner, plattner@trilead.com

  * @version $Id: StreamGobbler.java,v 1.1 2007/10/15 12:49:56 cplattne Exp $

  */

 public class StreamGobbler extends InputStream

 {

     class GobblerThread extends Thread

     {

         public void run()

         {

             byte[] buff = new byte[8192];

             while (true)

             {

                 try

                 {

                     int avail = is.read(buff);

                     synchronized (synchronizer)

                     {

                         if (avail <= 0)

                         {

                             isEOF = true;

                             synchronizer.notifyAll();

                             break;

                         }

                         int space_available = buffer.length - write_pos;

                         if (space_available < avail)

                         {

                             /* compact/resize buffer */

                             int unread_size = write_pos - read_pos;

                             int need_space = unread_size + avail;

                             byte[] new_buffer = buffer;

                             if (need_space > buffer.length)

                             {

                                 int inc = need_space / 3;

                                 inc = (inc < 256) ? 256 : inc;

                                 inc = (inc > 8192) ? 8192 : inc;

                                 new_buffer = new byte[need_space + inc];

                             }

                             if (unread_size > 0)

                                 System.arraycopy(buffer, read_pos, new_buffer, 0, unread_size);

                             buffer = new_buffer;

                             read_pos = 0;

                             write_pos = unread_size;

                         }

                         System.arraycopy(buff, 0, buffer, write_pos, avail);

                         write_pos += avail;

                         synchronizer.notifyAll();

                     }

                 }

                 catch (IOException e)

                 {

                     synchronized (synchronizer)

                     {

                         exception = e;

                         synchronizer.notifyAll();

                         break;

                     }

                 }

             }

         }

     }

     private InputStream is;

     private final GobblerThread t;

     private final Object synchronizer = new Object();

     private boolean isEOF = false;

     private boolean isClosed = false;

     private IOException exception = null;

     private byte[] buffer = new byte[2048];

     private int read_pos = 0;

     private int write_pos = 0;

     public StreamGobbler(InputStream is)

     {

         this.is = is;

         t = new GobblerThread();

         t.setDaemon(true);

         t.start();

     }

     public int read() throws IOException

     {

         synchronized (synchronizer)

         {

             if (isClosed)

                 throw new IOException("This StreamGobbler is closed.");

             while (read_pos == write_pos)

             {

                 if (exception != null)

                     throw exception;

                 if (isEOF)

                     return -1;

                 try

                 {

                     synchronizer.wait();

                 }

                 catch (InterruptedException e)

                 {

                     throw new InterruptedIOException();

                 }

             }

             int b = buffer[read_pos++] & 0xff;

             return b;

         }

     }

     public int available() throws IOException

     {

         synchronized (synchronizer)

         {

             if (isClosed)

                 throw new IOException("This StreamGobbler is closed.");

             return write_pos - read_pos;

         }

     }

     public int read(byte[] b) throws IOException

     {

         return read(b, 0, b.length);

     }

     public void close() throws IOException

     {

         synchronized (synchronizer)

         {

             if (isClosed)

                 return;

             isClosed = true;

             isEOF = true;

             synchronizer.notifyAll();

             is.close();

         }

     }

     public int read(byte[] b, int off, int len) throws IOException

     {

         if (b == null)

             throw new NullPointerException();

         if ((off < 0) || (len < 0) || ((off + len) > b.length) || ((off + len) < 0) || (off > b.length))

             throw new IndexOutOfBoundsException();

         if (len == 0)

             return 0;

         synchronized (synchronizer)

         {

             if (isClosed)

                 throw new IOException("This StreamGobbler is closed.");

             while (read_pos == write_pos)

             {

                 if (exception != null)

                     throw exception;

                 if (isEOF)

                     return -1;

                 try

                 {

                     synchronizer.wait();

                 }

                 catch (InterruptedException e)

                 {

                     throw new InterruptedIOException();

                 }

             }

             int avail = write_pos - read_pos;

             avail = (avail > len) ? len : avail;

             System.arraycopy(buffer, read_pos, b, off, avail);

             read_pos += avail;

             return avail;

         }

     }

 }
如果使用这个类之前知悉读类的说明信息是可以看明白这个类存在的问题的。当然也可以从源码上看出来,我就是从源码看出问题的,当时花的时间肯定比看说明耗费的时间长。
下面是产生问题的代码:
 class GobblerThread extends Thread

     {

         public void run()

         {

             byte[] buff = new byte[8192];

             while (true)

             {

                 try

                 {

                     int avail = is.read(buff);

                     synchronized (synchronizer)

                     {

                         if (avail <= 0)

                         {

                             isEOF = true;

                             synchronizer.notifyAll();

                             break;

                         }

                         int space_available = buffer.length - write_pos;

                         if (space_available < avail)

                         {

                             /* compact/resize buffer */

                             int unread_size = write_pos - read_pos;

                             int need_space = unread_size + avail;

                             byte[] new_buffer = buffer;

                             if (need_space > buffer.length)

                             {

                                 int inc = need_space / 3;

                                 inc = (inc < 256) ? 256 : inc;

                                 inc = (inc > 8192) ? 8192 : inc;

                                 new_buffer = new byte[need_space + inc];

                             }

                             if (unread_size > 0)

                                 System.arraycopy(buffer, read_pos, new_buffer, 0, unread_size);

                             buffer = new_buffer;

                             read_pos = 0;

                             write_pos = unread_size;

                         }

                         System.arraycopy(buff, 0, buffer, write_pos, avail);

                         write_pos += avail;

                         synchronizer.notifyAll();

                     }

                 }

                 catch (IOException e)

                 {

                     synchronized (synchronizer)

                     {

                         exception = e;

                         synchronizer.notifyAll();

                         break;

                     }

                 }

             }

         }

     }
StreamGobbler类的buffer属性是一个只会不断增长,且不会清空的byte数组,问题就出在这里。
当一个Hive查询的执行时间非常的长(比如出现数据倾斜导致查询进行不下去、执行任务很多需要排队导致时间边长),那么这个线程将持续很长时间,而它将hold这个buffer永远不会被回收,虽然它里面的内容再也不会被使用。
那么这就是不合理的地方。StreamGobbler类的设计就是启动一个线程将一个输入流的内容不停的清空,读到自己的缓存中。这样的目的是不要造成流的堵塞,但这样就不适用长任务且日志不停输出的场景。
至此排查分析结束,原因就是第三方的StreamGobbler并不适合当前的场景。解决的办法就是自己实现读取流的线程及时的处理掉流中的内容,和StreamGobbler起一个线程去读试一致的,只是不做缓存处理。
经过这次CPU飙高查到原因,基本已经熟悉了JVM工具的使用,CPU问题及内存问题的排查流程,算是有些收获。看问题,排查定位问题,看源码分析,最终解决掉问题的过程让自己非常的“爽”,并且得到成长。
和各位博友一起成长,加油。
记一次查内存异常问题(续《记一次Web应用CPU偏高》)的更多相关文章
- 记一次Web应用CPU偏高
LZ开发的一个公司内部应用供查询HIVE数据使用.部署上线后总是会出现CPU偏高的情况,而且本地测试很难重现.之前出现几次都是通过直接重启后继续使用,因为是内部使用,重启一下也没有很大影响(当然,每次 ...
- 记一次Task抛异常,调用线程处理而引发的一些随想
记一次Task抛异常,调用线程处理而引发的一些随想 多线程调用,任务线程抛出异常如何在另一个线程(调用线程)中捕获并进行处理的问题. 1.任务线程在任务线程执行语句上抛出异常. 例如: private ...
- 记录特殊情况的Python脚本的内存异常与处理
问题 Python 脚本使用 requests 模块做 HTTP 请求,验证代理 IP 的可用性,速度等. 设定 HTTP 请求的 connect timeout 与 read response ti ...
- GC-ALLOC 的另一个重要作用,查内存泄漏
平时我们用U3d profiler的Gc alloc 选项是为了查找一些动态的内存分配,多数是为了防止动态分配造成不定时的垃圾回收,形成CPU波峰. GC ALLOC 选项还可以用来查内存泄漏.
- C#连接solr时提示 java内存异常 (jetty和tomcat哪个更High) java.lang.OutOfMemoryError
C#连接solr时提示 java内存异常 java.lang.OutOfMemoryError 时间:20180130 09:51:13.329,消息:异常消息<?xml version=& ...
- java的可查的异常和不可查的异常讲解
java的可查的异常和不可查的异常讲解: Java的异常(包括Exception和Error)分为:可查的异常(checked exceptions)和不可查的异常(unchecked excepti ...
- 记一次共享内存/dev/shm 小于memory_target 引发的客户DB 宕机问题
1> 记一次共享内存/dev/shm 小于memory_target 引发的客户DB 宕机问题(处理心得)
- 深入理解JVM虚拟机11:Java内存异常原理与实践
本文转自互联网,侵删 本系列文章将整理到我在GitHub上的<Java面试指南>仓库,更多精彩内容请到我的仓库里查看 https://github.com/h2pl/Java-Tutori ...
- 记一次golang内存泄露
记一次golang内存泄露 最近在QA环境上验证功能时,发现机器特别卡,查看系统内存,发现可用(available)内存仅剩200多M,通过对进程耗用内存进行排序,发现有一个名为application ...
随机推荐
- Unity3D脚本语言UnityScript初探
译者注: Unity3D中支持三种语言:JavaScript.C#.Boo,很多人不知道如何选择,通过这篇译文,我们可以搞清楚这三者语言的来龙去脉,对选择主语言有一定的借鉴意义. 首先,Unity是基 ...
- mysql select语句解析
select语句用于从一个或多个数据表选出特定行.特定列的交集 最简单的select语句的语法格式如下: select column1,column2 ........ (列) from 数 ...
- linux服务开机启动顺序
今天遇到了一个问题,我们写了一个服务脚本A,该服务需要优先于mysql启动.脚本是从其他地方拷来的模板,前面的默认配置没改,只是实现了自己的功能.写完,chkconfig A on,reboot,启动 ...
- Window下生成OpenSSL自签证书
:OPenSSL下载地址:https://www.openssl.org/source/ 编译好的OpenSSL下载地址: http://slproweb.com/products/Win32Open ...
- mybatis中#和$符号的区别
mybatis做为一个轻量级ORM框架在许多项目中使用,因其简单的入门受到了广大开发者的热爱.在近期项目中再做一个相关的开发,碰到了#.$符号这样的问题,之前没怎么注意过,通过学习之后,有了点感悟,分 ...
- 常用Keytool 命令
常用Keytool 命令Keytool 是一个JAVA环境下的安全钥匙与证书的管理工具.它管理一个存储了私有钥匙和验证相应公共钥匙的与它们相关联的X.509 证书链的keystore(相当一个数据库, ...
- [Android]ViewPager如何只初始化一个页面
使用过ViewPager的应该都知道,ViewPager的setoffscreenpagelimit()方法,使用该方法可以设置在ViewPager滑动时,左右两侧各保存多少个页面,那我们直接设置se ...
- IOS沙盒
可以先在程序打印沙盒路径: NSLog(@"路径%@",NSHomeDirectory()); ------------------------------------------ ...
- 在Eclipse设置打开项目或文件目录
Run-->External Tools-->Open External Tools Dialog... new 一个 program location 里面填 :C:\WINDOWS ...
- 异步get请求之代理方法
#import "ViewController.h" #import "Header.h" @interface ViewController ()<NS ...