Prometheus + Grafana 监控 Redis
Prometheus安装
wget https://github.com/prometheus/prometheus/releases/download/v2.1.0/prometheus-2.1..linux-amd64.tar.gz
tar -zxvf prometheus-2.1..linux-amd64.tar.gz -C /prometheus --strip-components=
cd /prometheus
# Start Prometheus.

# By default, Prometheus stores its database in ./data (flag --storage.tsdb.path).

./prometheus --config.file=prometheus.yml
在浏览器输入localhost:9090
Grafana安装
wget https://s3-us-west-2.amazonaws.com/grafana-releases/release/grafana-4.6.3-1.x86_64.rpm

sudo yum localinstall grafana-4.6.-.x86_64.rpm
启动服务
$ sudo service grafana-server start
开机启动
$ sudo /sbin/chkconfig --add grafana-server
安装完成。浏览器打开 http://192.168.0.15:3000 ,输入默认用户名密码 (admin/admin) 可以进入 Grafana 。
Prometheus 和 Grafana 对接
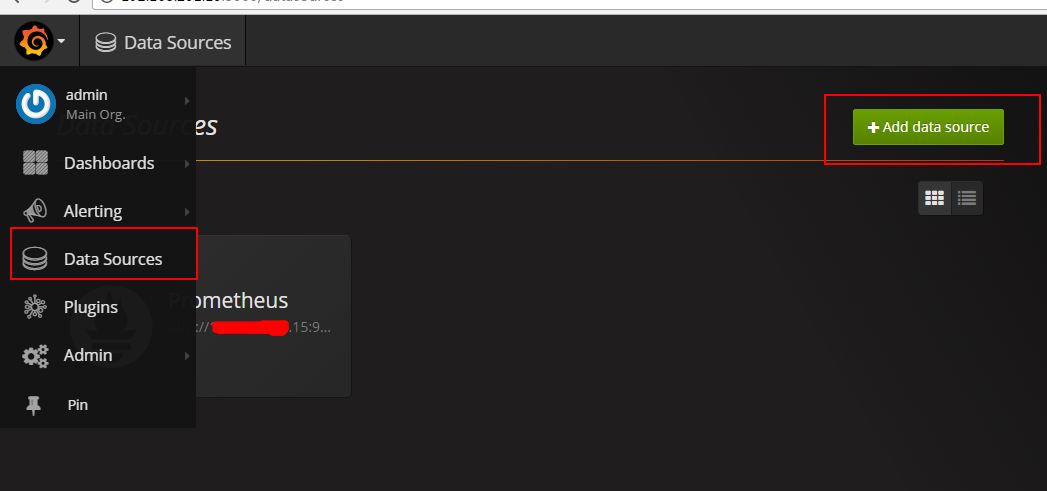
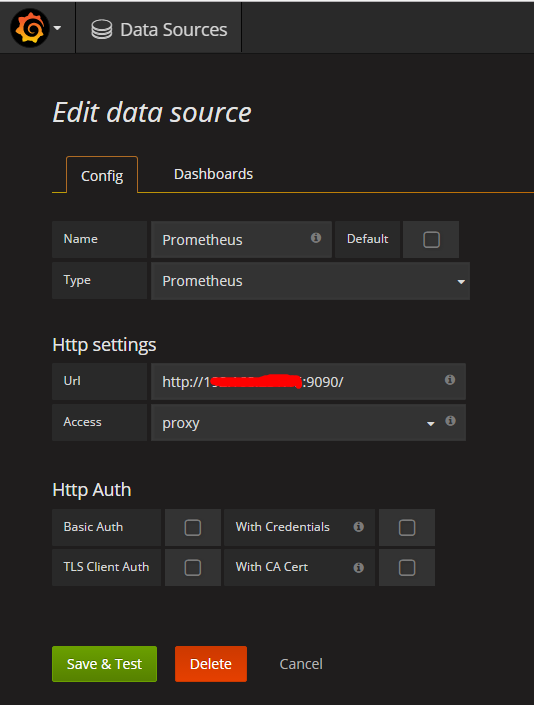
Prometheus: URL: localhost:9090/
即可完成 Prometheus 和 Grafana 的对接。
在redis服务器安装node_exporter和redis_exporter
redis_exporter安装
wget https://github.com/oliver006/redis_exporter/releases/download/v0.15.0/redis_exporter-v0.15.0.linux-amd64.tar.gz
tar -zxvf redis_exporter-v0.15.0.linux-amd64.tar.gz -C /prometheus_exporters --strip-components=
wget https://github.com/prometheus/node_exporter/releases/download/v0.15.2/node_exporter-0.15.2.linux-amd64.tar.gz
tar -zxvf redis_exporter-v0.15.2.linux-amd64.tar.gz -C /prometheus_exporters --strip-components=
启动
cd /prometheus_exporters
./node_exporter &
./redis_exporter redis//localhost:6379 & -web.listenaddress 0.0.0.0:9122
配置prometheus.yml 加入
- job_name: redis_exporter

  static_configs:

  - targets: ['192.168.0.17:9122']
注意prometheus.yml中缩进不能有tab。
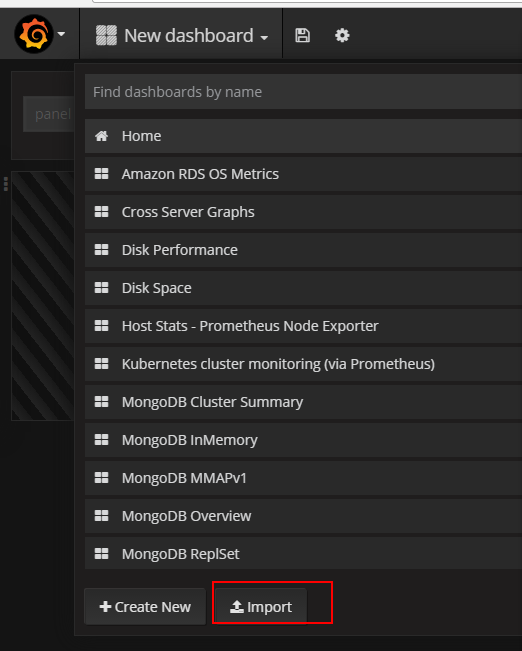
导入json模板
下载grafana的redis的prometheus-redis_rev1.json模板
wget https://grafana.com/api/dashboards/763/revisions/1/download
在grafana中导入json模板
启动redis
在redis安装路径执行
src/redis-server

Prometheus + Grafana 监控 Redis的更多相关文章
- prometheus+grafana监控redis
prometheus+grafana监控redis redis安装配置 https://www.cnblogs.com/autohome7390/p/6433956.html redis_export ...
- [转帖]安装prometheus+grafana监控mysql redis kubernetes等
安装prometheus+grafana监控mysql redis kubernetes等 https://www.cnblogs.com/sfnz/p/6566951.html plug 的模式进行 ...
- Grafana Prometheus系统监控Redis服务
Grafana Prometheus系统监控Redis服务 一.Grafana Prometheus系统监控Redis服务 1.1流程 1.2安装redis_exporter 1.3配置prometh ...
- Prometheus + Grafana 监控系统搭
本文主要介绍基于Prometheus + Grafana 监控Linux服务器. 一.Prometheus 概述(略) 与其他监控系统对比 1 Prometheus vs. Zabbix Zabbix ...
- Prometheus+Grafana监控SpringBoot
Prometheus+Grafana监控SpringBoot 一.Prometheus监控SpringBoot 1.1 pom.xml添加依赖 1.2 修改application.yml配置文件 1. ...
- cAdvisor+Prometheus+Grafana监控docker
cAdvisor+Prometheus+Grafana监控docker 一.cAdvisor(需要监控的主机都要安装) 官方地址:https://github.com/google/cadvisor ...
- [转帖]Prometheus+Grafana监控Kubernetes
原博客的位置: https://blog.csdn.net/shenhonglei1234/article/details/80503353 感谢原作者 这里记录一下自己试验过程中遇到的问题: . 自 ...
- prometheus+grafana监控mysql
prometheus+grafana监控mysql 1.安装配置MySQL官方的 Yum Repository(有mysql只需设置监控账号即可) [root@localhost ~]# wget - ...
- 【Springboot】用Prometheus+Grafana监控Springboot应用
1 简介 项目越做越发觉得,任何一个系统上线,运维监控都太重要了.关于Springboot微服务的监控,之前写过[Springboot]用Springboot Admin监控你的微服务应用,这个方案可 ...
随机推荐
- 国内Maven镜像仓库
<mirror> <id>alimaven</id> <name>aliyun maven</name> <url>http:/ ...
- virtualBox中有线和无线两种情况下centos虚拟机和本地机互ping的方案
之前写微信点餐系统的时候,刚开始是无线连接,然后每次进去虚拟机ip和本地ip都会改变,所以每次都需要配置一下nginx,还有本地的路径.之后换有线连接,就研究了一下桥接模式有线情况下虚拟机静态ip设置 ...
- linux manual free memory
/proc/sys/vm/drop_caches (since Linux 2.6.16)Writing to this file causes the kernel to drop clean ca ...
- 小米oj 不要乱改代码(并查集)
不要乱改代码 序号:#91难度:非常难时间限制:2000ms内存限制:50M 描述 最近小米公司内爆发了一种名叫"瞎改我代码就会死"的传染病. 传播方式是只要与染病者共同编辑过一 ...
- HZOJ 20190819 NOIP模拟26题解
考试过程: 照例开题,然后觉得三道题都挺难,比昨天难多了(flag×1),T1 dp?T2 数据结构? T3 dp?事实证明我是sb然后决定先搞T2,但是,woc,这题在说什么啊,我怎么看不懂题啊,连 ...
- 平衡Dom总结
介绍: 新的项目中有些Dom元素需要和画布保持统一个适配比例 项目地址: 宝岛之光-台湾偶像剧 遇到的问题 H5项目使用Canvas, 适配采用保持宽高比例, 上下或者左右留白方式 在项目中有些Dom ...
- 项目中遇到的关于Java的问题
1.Collections对List集合中的数据进行排序 http://blog.csdn.net/veryisjava/article/details/51675036 2.Java随机数 http ...
- koa 项目实战(八)生成token
1.安装模块 npm install jsonwebtoken --save 2.引用 const jwt = require('jsonwebtoken'); ... // 返回token cons ...
- sentinel控制台监控数据持久化【InfluxDB】
根据官方wiki文档,sentinel控制台的实时监控数据,默认仅存储 5 分钟以内的数据.如需持久化,需要定制实现相关接口. https://github.com/alibaba/Sentinel/ ...
- vuejs2从入门到精通与项目开发实战
vuejs2从入门到精通:一.基础部分0.课件1.介绍2.vue实例3.模板语法4.计算属性和观察者5.Class与Style绑定6.条件渲染7.列表渲染8.事件处理9.表单输入绑定10.1.组件(1 ...