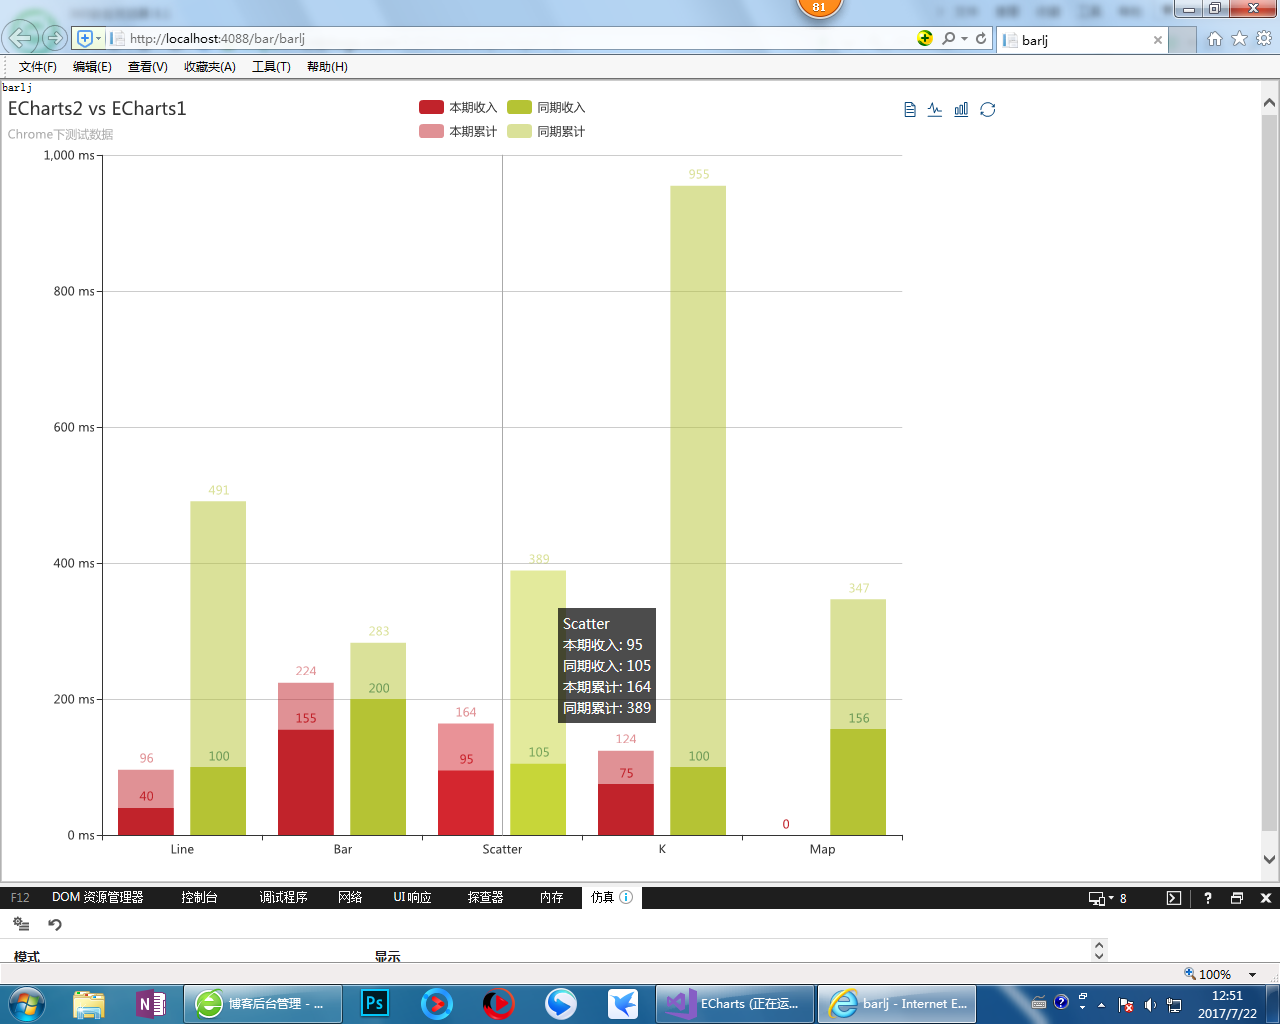
echarts3.0 本期累计堆叠
@{

    ViewBag.Title = "barlj";

}

<h2>barlj</h2>

<div id="main" style="width: 1000px;height:800px;"></div>

<script type="text/javascript">

    // 基于准备好的dom,初始化echarts实例

    var myChart = echarts.init(document.getElementById('main'), 'shine', { width:  });

    option = {

        title: {

            text: 'ECharts2 vs ECharts1',

            subtext: 'Chrome下测试数据'

        },

        tooltip: {

            trigger: 'axis',

            formatter: function (params) {

                var s = '';

                s += params[].name + '<br />';

                var l = params.length;

                for (var i = ; i < l; i++) {

                    s += params[i].seriesName + ': ' + params[i].value + '<br />';

                }

                return s;

            }

        },

        legend: {

            //中间空字符为换行???

            data: ['本期收入', '同期收入', '', '本期累计', '同期累计'],

            selected: {

                '本期收入': true,

                '同期收入': true,

                '本期累计': true,

                '同期累计': true

            }

        },

        toolbox: {

            show: true,

            feature: {

                mark: { show: true },

                dataView: { show: true, readOnly: false },

                magicType: { show: true, type: ['line', 'bar'] },

                restore: { show: true },

                saveAsImage: { show: true }

            }

        },

        //拖动项,3.0不支持

        calculable: true,

        //grid: { y: 70, y2: 30, x2: 20 },

        xAxis: [

            {

                type: 'category',

                data: ['Line', 'Bar', 'Scatter', 'K', 'Map']

            },

            {

                type: 'category',

                axisLine: { show: false },

                axisTick: { show: false },

                axisLabel: { show: false },

                splitArea: { show: false },

                splitLine: { show: false },

                data: ['Line', 'Bar', 'Scatter', 'K', 'Map']

            }

        ],

        yAxis: [

            {

                type: 'value',

                axisLabel: { formatter: '{value} ms' }

            }

        ],

        series: [

            {

                name: '本期收入',

                type: 'bar',

                itemStyle: { normal: { color: 'rgba(193,35,43,1)', label: { show: true, position: 'top' } } },

                data: [, , , , ]

            },

            {

                name: '同期收入',

                type: 'bar',

                itemStyle: { normal: { color: 'rgba(181,195,52,1)', label: { show: true, position: 'top', textStyle: { color: '#27727B' } } } },

                data: [, , , , ]

            },

            {

                name: '本期累计',

                type: 'bar',

                xAxisIndex: ,

                itemStyle: { normal: { color: 'rgba(193,35,43,0.5)', label: { show: true, position: 'top', formatter: function (p) { return p.value >  ? (p.value /*+ '\n'*/) : ''; } } } },

                data: [, , , , ]

            },

            {

                name: '同期累计',

                type: 'bar',

                xAxisIndex: ,

                itemStyle: { normal: { color: 'rgba(181,195,52,0.5)', label: { show: true, position: 'top' } } },

                data: [, , , , ]

            }

        ]

    };

    myChart.on('legendselectchanged', function (params) {

        if (params.name == '本期收入') {

            if (params.selected['本期收入']) {

                option.legend.selected['本期收入'] = true;

                option.legend.selected['同期收入'] = true;

            }

            else {

                option.legend.selected['本期收入'] = false;

                option.legend.selected['同期收入'] = false;

            }

        }

        if (params.name == '同期收入') {

            if (params.selected['同期收入']) {

                option.legend.selected['本期收入'] = true;

                option.legend.selected['同期收入'] = true;

            }

            else {

                option.legend.selected['本期收入'] = false;

                option.legend.selected['同期收入'] = false;

            }

        }

        if (params.name == '本期累计') {

            if (params.selected['本期累计']) {

                option.legend.selected['本期累计'] = true;

                option.legend.selected['同期累计'] = true;

            }

            else {

                option.legend.selected['本期累计'] = false;

                option.legend.selected['同期累计'] = false;

            }

        }

        if (params.name == '同期累计') {

            if (params.selected['同期累计']) {

                option.legend.selected['本期累计'] = true;

                option.legend.selected['同期累计'] = true;

            }

            else {

                option.legend.selected['本期累计'] = false;

                option.legend.selected['同期累计'] = false;

            }

        }

        myChart.setOption(option);

    });

    myChart.setOption(option);

</script>
路过的感觉对你有用的帮忙配下色 :)
echarts3.0 本期累计堆叠的更多相关文章
- asp.net mvc5+Echarts3.0+AspNet.SignalR2.0 实时监控cpu占用率推送
先看看效果: 感谢QQ群18668853的群主,无私的公开课,全是干货,当初学的时候,群主用的是jquery.flot做图表,我这里改成百度的Echarts3.0,这算是自己的修改吧,喜欢的可以去下载 ...
- Echarts3.0 引入百度地图(转载)
转载来源: https://blog.csdn.net/yc_1993/article/details/52431989 Echarts3.0引入百度地图 update: 由于目前echarts3.8 ...
- vue cli3.0 结合echarts3.0和地图的使用方法
echarts 提供了直观,交互丰富,可高度个性化定制的数据可视化图表.而vue更合适操纵数据. 最近一直忙着搬家,就没有更新博客,今天抽出空来写一篇关于vue和echarts的博客.下面是结合地图的 ...
- vue中使用 echarts3.0 或 echarts2.0 (模拟迁徙图,折线图)
一.echarts3.0(官网: http://echarts.baidu.com/) 首先通过npm安装echarts依赖,安装的为3.0版本 npm install echarts -s 也可以使 ...
- echarts3.0 仪表盘实例更改完成占用率实例
需要完成的项目效果 官方实例效果 基本思路: 首先引入jquery和echarts3.0库. 需要两个仪表盘,一个仪表盘是纯色灰色,在底部.startAngle 和endAngle永远是最大值,默认为 ...
- echarts3.0之关系图详解
近期需要使用echarts关系图,当我打开echarts3.0官方demo后发现,对于新手而言,直接看懂有点儿难度,固写这样一篇文章让自己加深记忆,也便新手迅速上手.话不多说,开整生气! echart ...
- 基于SpringMVC框架使用ECharts3.0实现堆叠条形图的绘制(下篇)
<script type="text/javascript"> $().ready(function() { var myChart = echarts.init(do ...
- echarts3.0使用总结
echarts的使用和例子传送门 1.安装echarts npm install echarts --save 这里配置好了,直接输入 npm install //下载插件 npm start //运 ...
- ECharts3.0饼状图使用问题总结
前提:本人使用的是IE9浏览器 1.IE中无法显示,谷歌却显示正常的问题: 1)情况一 var myChart_cols<%=i%> = echarts.init(document.get ...
随机推荐
- Solr常用命令总结
前提条件: 安装solr版本:4.8.0 部署solr路径:/data/solr-4.8.0 1. 通过zookeeper上传一些配置信息: 通过zk命令将配置信息上传到zk环境中: /data/so ...
- expect嵌套shell循环
#!/bin/bash Detailtxt="test.txt" while read line do dest=`echo $line|awk '{print $1}'` ip= ...
- java并发实践笔记
底层的并发功能与并发语义不存在一一对应的关系.同步和条件等底层机制在实现应用层协议与策略须始终保持一致.(需要设计级别策略.----底层机制与设计级策略不一致问题). 简介 1.并发简史.(资源利用率 ...
- Clockwise/Spiral Rule
[Clockwise/Spiral Rule] There is a technique known as the ``Clockwise/Spiral Rule''. (顺时针螺旋法则). Ther ...
- [整理]内存重叠之memcpy、memmove
函数原型: void *memcpy( void *dest, const void *src, size_t count ); void *memmove( void* dest, const vo ...
- CodeForces - 1042B
Berland shop sells nn kinds of juices. Each juice has its price cici. Each juice includes some set o ...
- [Openwrt 扩展上篇]USB挂载&U盘启动&Samba共享
最近偷懒,没学习,反想起自己的路由刷了Openwrt,正好闲置了一个硬盘想拿来做个网络硬盘,于是开始了折腾....这里将不谈论如何刷Openwrt,如何ssh,如何添加PPOE,如何添加相对应服务的包 ...
- Django 安装 —Django学习 (一)
Django Django 是一个python 框架, 采用MTV的模式,模型,模板,视图 注意事项 Django 版本和 python 的版本是一一对应的,安装时一定要注意相应的版本信息. 如下图: ...
- 自动检测SOCKET链接断开
如何判断SOCKET已经断开 最近在做一个服务器端程序,C/S结构.功能方面比较简单就是client端与server端建立连接,然后发送消息给server.我在server端会使用专门的线程处理一条s ...
- Once you eliminate all the other factors,the only thing remaining must be the truth.
Once you eliminate all the other factors,the only thing remaining must be the truth. 一旦你排除了杂因,剩下的一定是 ...