ZABBIX 3.4 监控Nginx 状态(七)
一、环境准备
1、在nginx的配置文件中,添加status配置
location /nginx_status {
stub_status on;
access_log off;
allow 127.0.0.1;
allow 172.17.19.19; //zabbix服务器的IP地址,一般是内网地址
deny all;
}
//在虚拟主机 server {} 中加入上面配置,也可以单独定义一个专门用于监控的虚拟主机。
//deny all , 拒绝除 allow 中的主机之外所有主机访问此 URL ,实现过程中如果遇到 403 ,有可能是你把自己测试的机器拒绝了
2、访问设置好的nginx-status链接,如图所示:
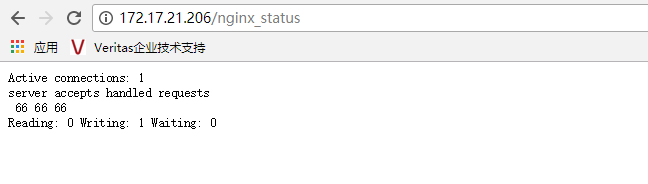
3、nginx Status 详细说明:
Activeconnections:对后端发起的活动连接数;
server accepts 66:nginx 总共处理了66个连接;
handled:成功创建了66次握手;
requests:总共处理了66请求。
Reading:nginx读取客户端的header数;
Writing: nginx 返回给客户端的header数;
Waiting: nginx 请求处理完成,正在等待下一请求指令的连接。
在访问效率很高,请求很快被处理完毕的情况下,Waiting 数比较多是正常的。如果 reading + writing 数较多,则说明并发访问量很大,正在处理过程中
二、监控脚本编写
1、编写脚本,放于 /etc/zabbix/zabbix_agentd.d/目录下
#!/bin/bash

#Script to fetch nginx statuses for monitoring systems

#Author Tony

    HOST="127.0.0.1"

    PORT=""

    function ping {

        /sbin/pidof nginx | wc -l

    }

    function active {

        /usr/bin/curl "http://$HOST:$PORT/nginx_status/" >/dev/null| grep 'Active' | awk '{print $NF}'

    }

    function reading {

        /usr/bin/curl "http://$HOST:$PORT/nginx_status/" >/dev/null| grep 'Reading' | awk '{print $2}'

    }

    function writing {

        /usr/bin/curl "http://$HOST:$PORT/nginx_status/" >/dev/null| grep 'Writing' | awk '{print $4}'

    }

    function waiting {

        /usr/bin/curl "http://$HOST:$PORT/nginx_status/" >/dev/null| grep 'Waiting' | awk '{print $6}'

    }

    function accepts {

        /usr/bin/curl "http://$HOST:$PORT/nginx_status/" >/dev/null| awk NR== | awk '{print $1}'

    }

    function handled {

        /usr/bin/curl "http://$HOST:$PORT/nginx_status/" >/dev/null| awk NR== | awk '{print $2}'

    }

    function requests {

        /usr/bin/curl "http://$HOST:$PORT/nginx_status/" >/dev/null| awk NR== | awk '{print $3}'

    }

    $
赋予脚本执行权限:
[root@Node1 zabbix_agentd.d]# chmod a+x nginx_status.sh  //赋予执行权限

[root@Node1 zabbix_agentd.d]# ll nginx_status.sh

-rwxr-xr-x  root root  Jan  : nginx_status.sh
2、添加zabbix配置文件,放于 /etc/zabbix/zabbix_agentd.d/目录下(agent的配置文件 /etc/zabbix/zabbix_agentd.conf 中定义了其他key的包含目录)创建配置文件nginx_status.conf
[root@Node1 zabbix_agentd.d]# cat nginx_status.conf

UserParameter=nginx.status[*],/etc/zabbix/zabbix_agentd.d/nginx_status.sh $
3、确保配置Agent配置文件开启自定义参数UnsafeUserParameters=1
[root@Node1 zabbix_agentd.d]# !grep

grep -n '^[a-Z]' /etc/zabbix/zabbix_agentd.conf

:PidFile=/var/run/zabbix/zabbix_agentd.pid

:LogFile=/var/log/zabbix/zabbix_agentd.log

:LogFileSize=

:DebugLevel=

:Server=172.17.21.208

:ServerActive=172.17.21.208

:Hostname=Node1.contoso.com

:Include=/etc/zabbix/zabbix_agentd.d/*.conf

286:UnsafeUserParameters=1    //1代表允许,0代表关闭
4、重启zabbix-agent服务
[root@Node1 ~]# systemctl restart zabbix-agent.service
5、在zabbix servere服务器上测试,是否能正常获取数据
[root@Node3 zabbix3.4.5]# zabbix_get -s 172.17.21.206 -p  -k nginx.status[ping]

[root@Node3 zabbix3.4.5]# zabbix_get -s 172.17.21.206 -p  -k nginx.status[accepts]

[root@Node3 zabbix3.4.5]# zabbix_get -s 172.17.21.206 -p  -k nginx.status[handled]

[root@Node3 zabbix3.4.5]# zabbix_get -s 172.17.21.206 -p  -k nginx.status[requests]

[root@Node3 zabbix3.4.5]#
三、WEB界面配置
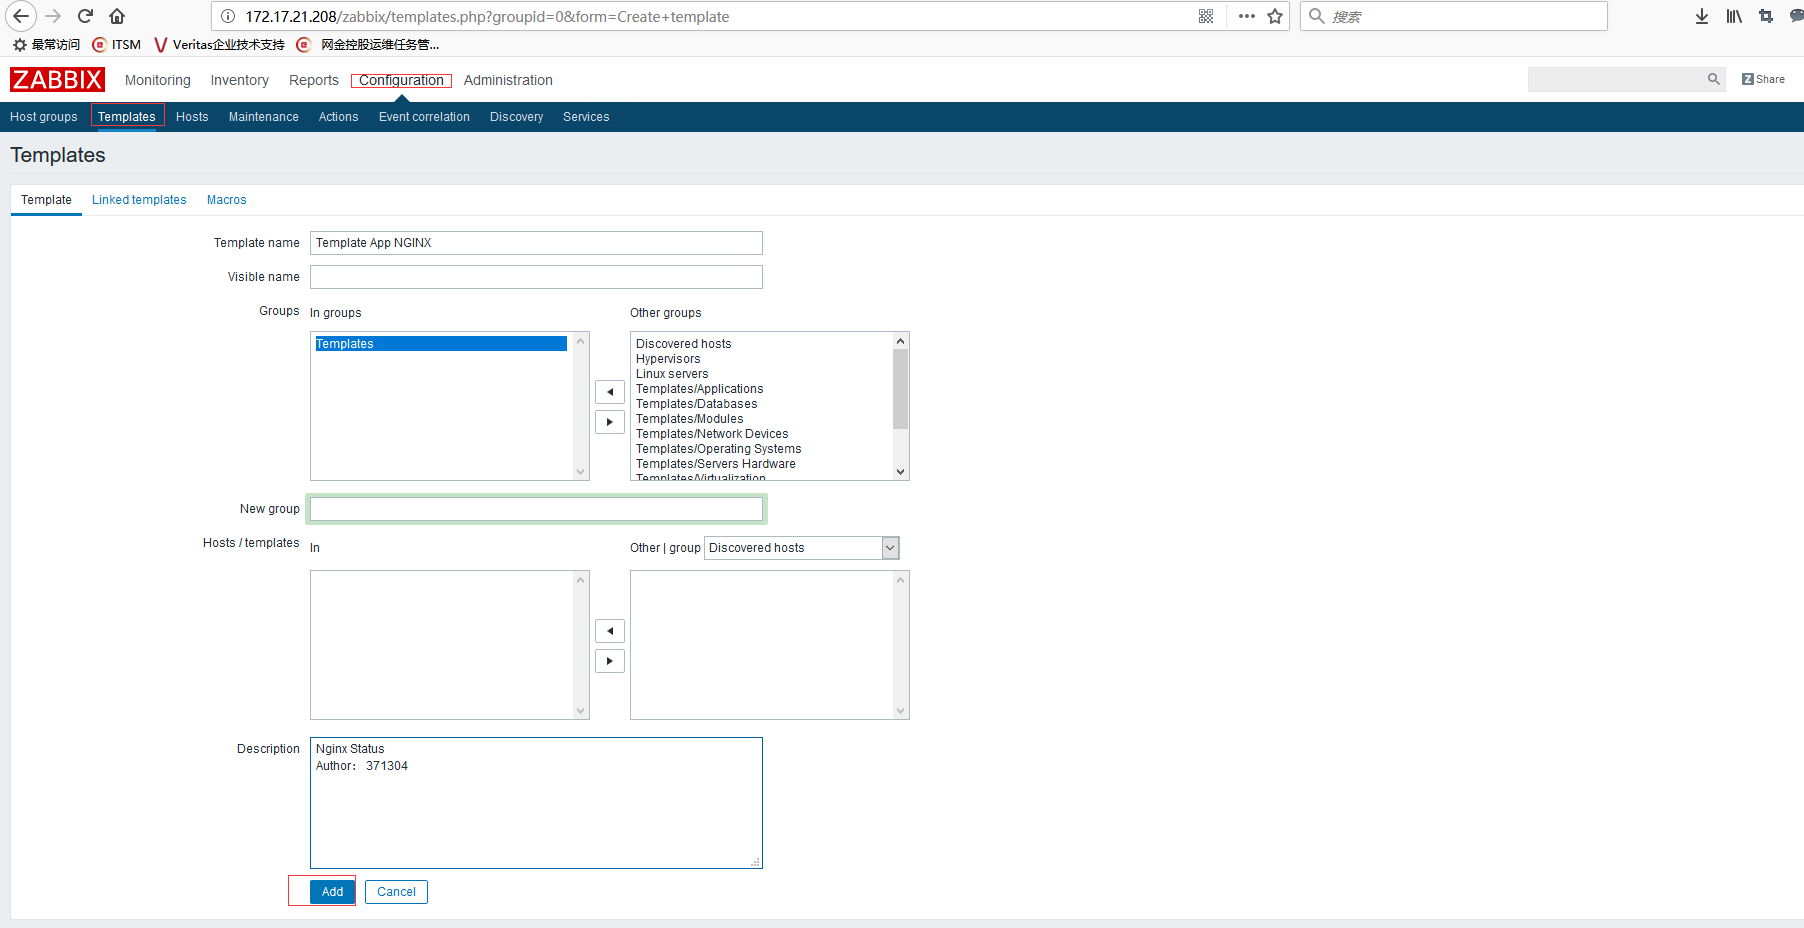
1、创建模板:Configuration-->Templates-->Greate template,创建模板名称:Template App NGINX,单击Add即可
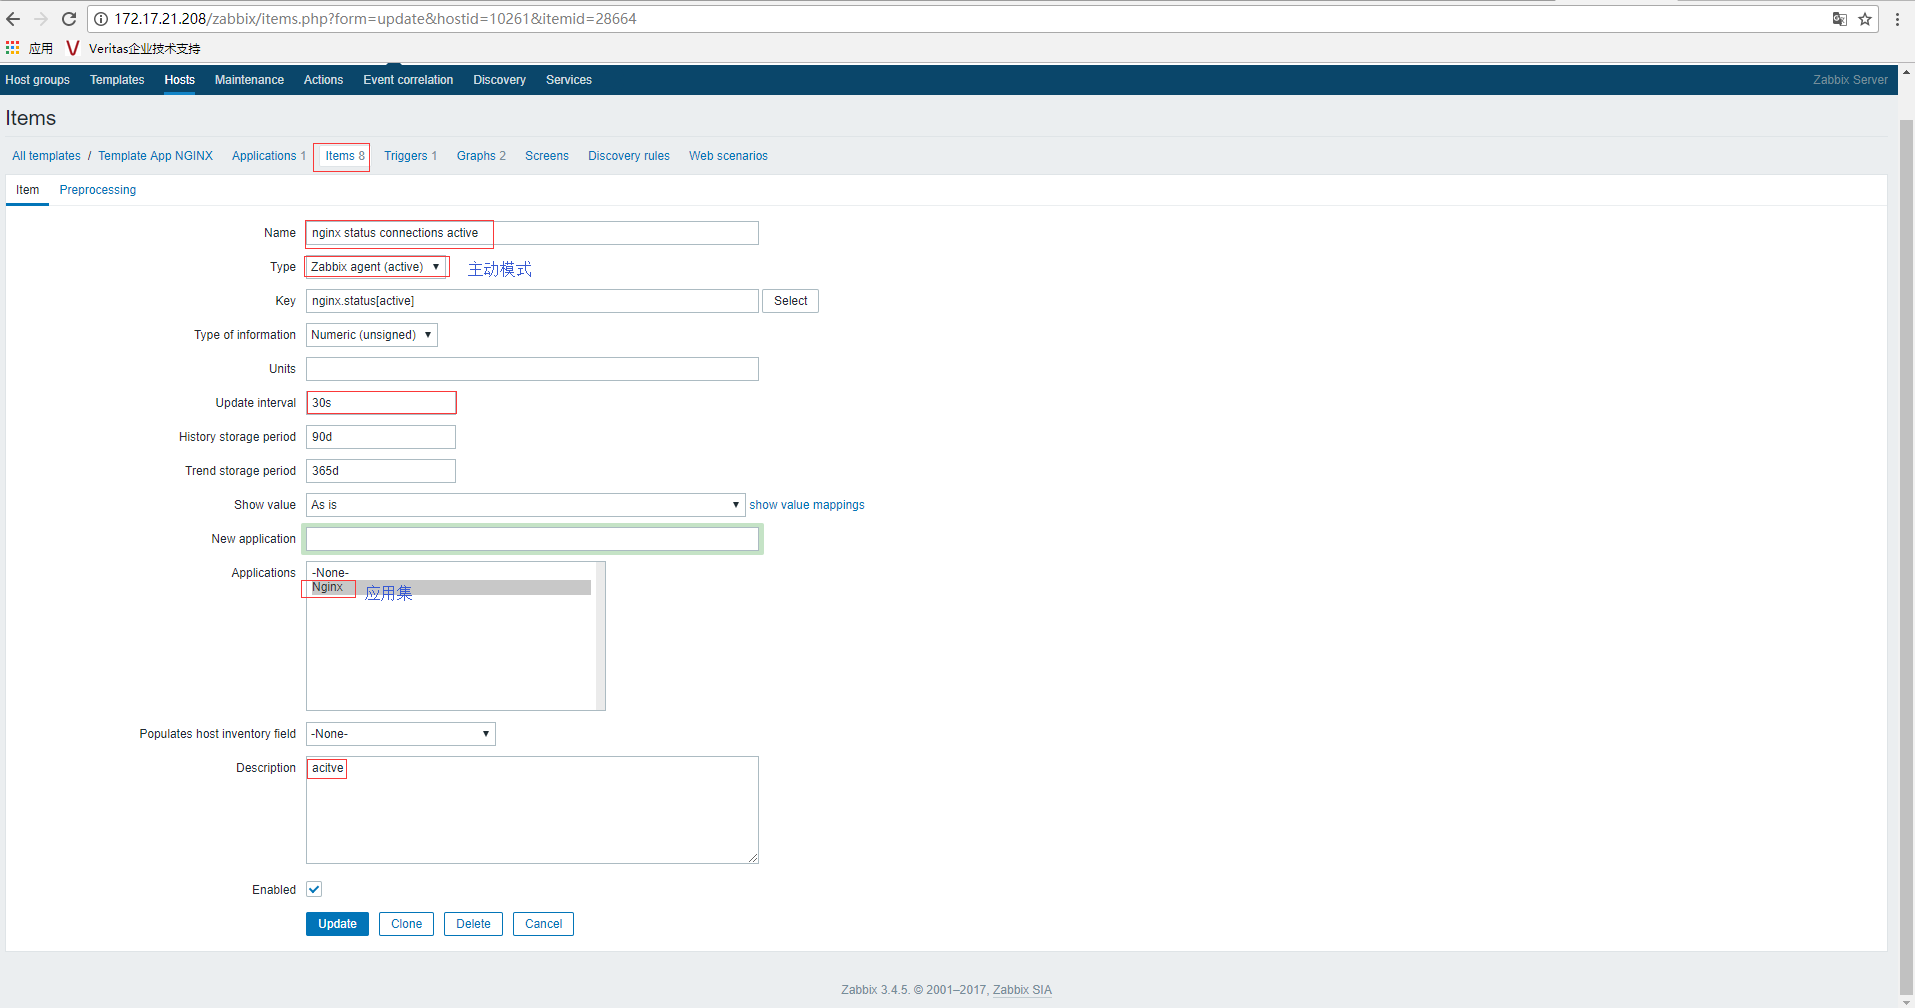
2、给模板依次添加相应Item、Trigger、Graphs,如下图所示
3、关联模板,Configuration-->Hosts-->Node1--Templates,选择模板,点击Updtae即可
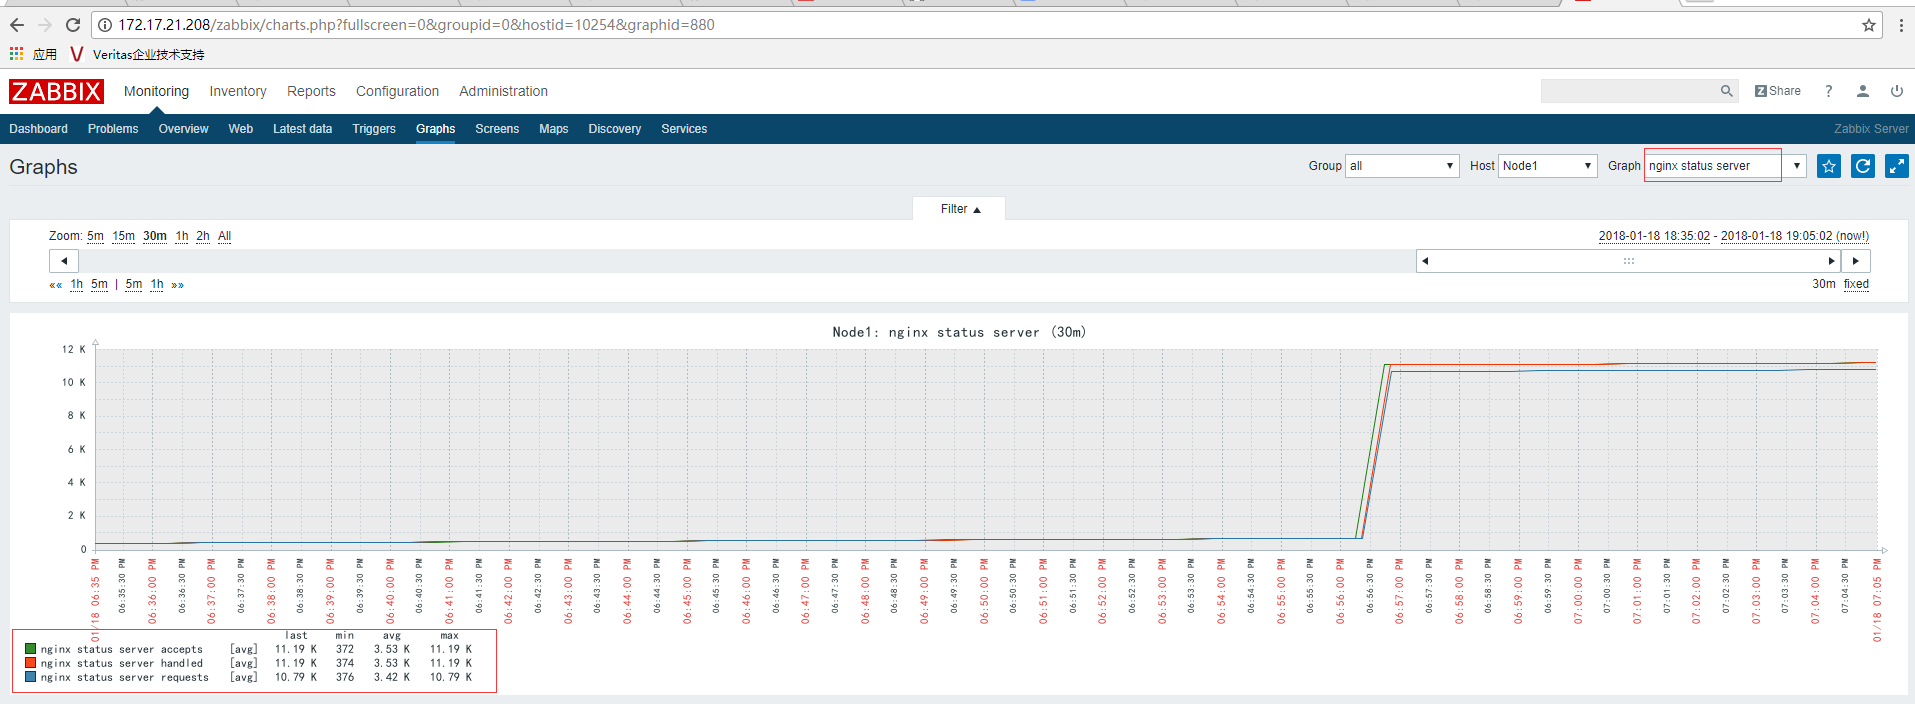
4、查看Nginx状态:Monitoring-->Graphs-->Host(Node1)-->Grahp(nginx status connections与nginx status server)

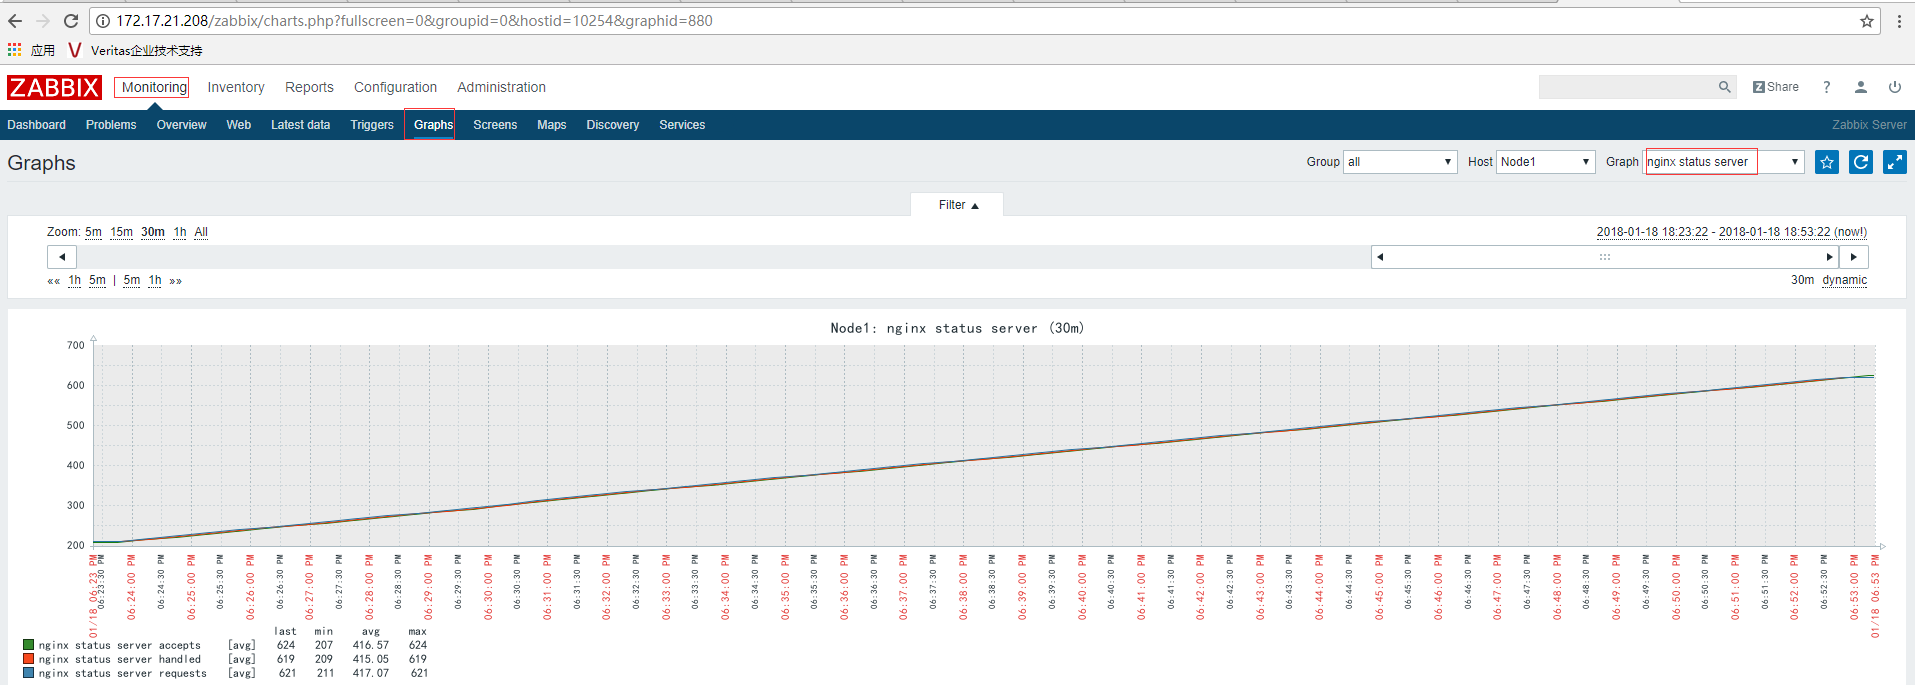
备注:若相关数据比较小的话,可以使用ab进行简单压测,然后再看数值变化
[root@Node1 zabbix_agentd.d]# ab -n -c http://Node1.contoso.com/
附模板:Template_Nginx_Status.xml
<?xml version="1.0" encoding="UTF-8"?>
<zabbix_export>
<version>3.4</version>
<date>2018-01-18T11:00:49Z</date>
<groups>
<group>
<name>Templates</name>
</group>
</groups>
<templates>
<template>
<template>Template App NGINX</template>
<name>Template App NGINX</name>
<description>nginx statuses
Author:371304</description>
<groups>
<group>
<name>Templates</name>
</group>
</groups>
<applications>
<application>
<name>Nginx</name>
</application>
</applications>
<items>
<item>
<name>nginx status server accepts</name>
<type>7</type>
<snmp_community/>
<snmp_oid/>
<key>nginx.status[accepts]</key>
<delay>30s</delay>
<history>90d</history>
<trends>365d</trends>
<status>0</status>
<value_type>3</value_type>
<allowed_hosts/>
<units/>
<snmpv3_contextname/>
<snmpv3_securityname/>
<snmpv3_securitylevel>0</snmpv3_securitylevel>
<snmpv3_authprotocol>0</snmpv3_authprotocol>
<snmpv3_authpassphrase/>
<snmpv3_privprotocol>0</snmpv3_privprotocol>
<snmpv3_privpassphrase/>
<params/>
<ipmi_sensor/>
<authtype>0</authtype>
<username/>
<password/>
<publickey/>
<privatekey/>
<port/>
<description>accepts</description>
<inventory_link>0</inventory_link>
<applications>
<application>
<name>Nginx</name>
</application>
</applications>
<valuemap/>
<logtimefmt/>
<preprocessing/>
<jmx_endpoint/>
<master_item/>
</item>
<item>
<name>nginx status connections active</name>
<type>7</type>
<snmp_community/>
<snmp_oid/>
<key>nginx.status[active]</key>
<delay>30s</delay>
<history>90d</history>
<trends>365d</trends>
<status>0</status>
<value_type>3</value_type>
<allowed_hosts/>
<units/>
<snmpv3_contextname/>
<snmpv3_securityname/>
<snmpv3_securitylevel>0</snmpv3_securitylevel>
<snmpv3_authprotocol>0</snmpv3_authprotocol>
<snmpv3_authpassphrase/>
<snmpv3_privprotocol>0</snmpv3_privprotocol>
<snmpv3_privpassphrase/>
<params/>
<ipmi_sensor/>
<authtype>0</authtype>
<username/>
<password/>
<publickey/>
<privatekey/>
<port/>
<description>acitve</description>
<inventory_link>0</inventory_link>
<applications>
<application>
<name>Nginx</name>
</application>
</applications>
<valuemap/>
<logtimefmt/>
<preprocessing/>
<jmx_endpoint/>
<master_item/>
</item>
<item>
<name>nginx status server handled</name>
<type>7</type>
<snmp_community/>
<snmp_oid/>
<key>nginx.status[handled]</key>
<delay>30s</delay>
<history>90d</history>
<trends>365d</trends>
<status>0</status>
<value_type>3</value_type>
<allowed_hosts/>
<units/>
<snmpv3_contextname/>
<snmpv3_securityname/>
<snmpv3_securitylevel>0</snmpv3_securitylevel>
<snmpv3_authprotocol>0</snmpv3_authprotocol>
<snmpv3_authpassphrase/>
<snmpv3_privprotocol>0</snmpv3_privprotocol>
<snmpv3_privpassphrase/>
<params/>
<ipmi_sensor/>
<authtype>0</authtype>
<username/>
<password/>
<publickey/>
<privatekey/>
<port/>
<description>handled</description>
<inventory_link>0</inventory_link>
<applications>
<application>
<name>Nginx</name>
</application>
</applications>
<valuemap/>
<logtimefmt/>
<preprocessing/>
<jmx_endpoint/>
<master_item/>
</item>
<item>
<name>nginx status PING</name>
<type>7</type>
<snmp_community/>
<snmp_oid/>
<key>nginx.status[ping]</key>
<delay>30s</delay>
<history>90d</history>
<trends>365d</trends>
<status>0</status>
<value_type>3</value_type>
<allowed_hosts/>
<units/>
<snmpv3_contextname/>
<snmpv3_securityname/>
<snmpv3_securitylevel>0</snmpv3_securitylevel>
<snmpv3_authprotocol>0</snmpv3_authprotocol>
<snmpv3_authpassphrase/>
<snmpv3_privprotocol>0</snmpv3_privprotocol>
<snmpv3_privpassphrase/>
<params/>
<ipmi_sensor/>
<authtype>0</authtype>
<username/>
<password/>
<publickey/>
<privatekey/>
<port/>
<description>ping</description>
<inventory_link>0</inventory_link>
<applications>
<application>
<name>Nginx</name>
</application>
</applications>
<valuemap/>
<logtimefmt/>
<preprocessing/>
<jmx_endpoint/>
<master_item/>
</item>
<item>
<name>nginx status connections reading</name>
<type>7</type>
<snmp_community/>
<snmp_oid/>
<key>nginx.status[reading]</key>
<delay>30s</delay>
<history>90d</history>
<trends>365d</trends>
<status>0</status>
<value_type>3</value_type>
<allowed_hosts/>
<units/>
<snmpv3_contextname/>
<snmpv3_securityname/>
<snmpv3_securitylevel>0</snmpv3_securitylevel>
<snmpv3_authprotocol>0</snmpv3_authprotocol>
<snmpv3_authpassphrase/>
<snmpv3_privprotocol>0</snmpv3_privprotocol>
<snmpv3_privpassphrase/>
<params/>
<ipmi_sensor/>
<authtype>0</authtype>
<username/>
<password/>
<publickey/>
<privatekey/>
<port/>
<description>reading</description>
<inventory_link>0</inventory_link>
<applications>
<application>
<name>Nginx</name>
</application>
</applications>
<valuemap/>
<logtimefmt/>
<preprocessing/>
<jmx_endpoint/>
<master_item/>
</item>
<item>
<name>nginx status server requests</name>
<type>7</type>
<snmp_community/>
<snmp_oid/>
<key>nginx.status[requests]</key>
<delay>30s</delay>
<history>90d</history>
<trends>365d</trends>
<status>0</status>
<value_type>3</value_type>
<allowed_hosts/>
<units/>
<snmpv3_contextname/>
<snmpv3_securityname/>
<snmpv3_securitylevel>0</snmpv3_securitylevel>
<snmpv3_authprotocol>0</snmpv3_authprotocol>
<snmpv3_authpassphrase/>
<snmpv3_privprotocol>0</snmpv3_privprotocol>
<snmpv3_privpassphrase/>
<params/>
<ipmi_sensor/>
<authtype>0</authtype>
<username/>
<password/>
<publickey/>
<privatekey/>
<port/>
<description>requests</description>
<inventory_link>0</inventory_link>
<applications>
<application>
<name>Nginx</name>
</application>
</applications>
<valuemap/>
<logtimefmt/>
<preprocessing/>
<jmx_endpoint/>
<master_item/>
</item>
<item>
<name>nginx status connections waiting</name>
<type>7</type>
<snmp_community/>
<snmp_oid/>
<key>nginx.status[waiting]</key>
<delay>30s</delay>
<history>90d</history>
<trends>365d</trends>
<status>0</status>
<value_type>3</value_type>
<allowed_hosts/>
<units/>
<snmpv3_contextname/>
<snmpv3_securityname/>
<snmpv3_securitylevel>0</snmpv3_securitylevel>
<snmpv3_authprotocol>0</snmpv3_authprotocol>
<snmpv3_authpassphrase/>
<snmpv3_privprotocol>0</snmpv3_privprotocol>
<snmpv3_privpassphrase/>
<params/>
<ipmi_sensor/>
<authtype>0</authtype>
<username/>
<password/>
<publickey/>
<privatekey/>
<port/>
<description>waiting</description>
<inventory_link>0</inventory_link>
<applications>
<application>
<name>Nginx</name>
</application>
</applications>
<valuemap/>
<logtimefmt/>
<preprocessing/>
<jmx_endpoint/>
<master_item/>
</item>
<item>
<name>nginx status connections writing</name>
<type>7</type>
<snmp_community/>
<snmp_oid/>
<key>nginx.status[writing]</key>
<delay>30s</delay>
<history>90d</history>
<trends>365d</trends>
<status>0</status>
<value_type>3</value_type>
<allowed_hosts/>
<units/>
<snmpv3_contextname/>
<snmpv3_securityname/>
<snmpv3_securitylevel>0</snmpv3_securitylevel>
<snmpv3_authprotocol>0</snmpv3_authprotocol>
<snmpv3_authpassphrase/>
<snmpv3_privprotocol>0</snmpv3_privprotocol>
<snmpv3_privpassphrase/>
<params/>
<ipmi_sensor/>
<authtype>0</authtype>
<username/>
<password/>
<publickey/>
<privatekey/>
<port/>
<description>writing</description>
<inventory_link>0</inventory_link>
<applications>
<application>
<name>Nginx</name>
</application>
</applications>
<valuemap/>
<logtimefmt/>
<preprocessing/>
<jmx_endpoint/>
<master_item/>
</item>
</items>
<discovery_rules/>
<httptests/>
<macros/>
<templates/>
<screens/>
</template>
</templates>
<triggers>
<trigger>
<expression>{Template App NGINX:nginx.status[ping].last()}=0</expression>
<recovery_mode>0</recovery_mode>
<recovery_expression/>
<name>nginx was down!</name>
<correlation_mode>0</correlation_mode>
<correlation_tag/>
<url/>
<status>0</status>
<priority>4</priority>
<description>nginx was down!</description>
<type>0</type>
<manual_close>0</manual_close>
<dependencies/>
<tags/>
</trigger>
</triggers>
<graphs>
<graph>
<name>nginx status connections</name>
<width>900</width>
<height>200</height>
<yaxismin>0.0000</yaxismin>
<yaxismax>100.0000</yaxismax>
<show_work_period>1</show_work_period>
<show_triggers>1</show_triggers>
<type>0</type>
<show_legend>1</show_legend>
<show_3d>0</show_3d>
<percent_left>0.0000</percent_left>
<percent_right>0.0000</percent_right>
<ymin_type_1>0</ymin_type_1>
<ymax_type_1>0</ymax_type_1>
<ymin_item_1>0</ymin_item_1>
<ymax_item_1>0</ymax_item_1>
<graph_items>
<graph_item>
<sortorder>0</sortorder>
<drawtype>0</drawtype>
<color>1A7C11</color>
<yaxisside>0</yaxisside>
<calc_fnc>2</calc_fnc>
<type>0</type>
<item>
<host>Template App NGINX</host>
<key>nginx.status[active]</key>
</item>
</graph_item>
<graph_item>
<sortorder>1</sortorder>
<drawtype>0</drawtype>
<color>F63100</color>
<yaxisside>0</yaxisside>
<calc_fnc>2</calc_fnc>
<type>0</type>
<item>
<host>Template App NGINX</host>
<key>nginx.status[reading]</key>
</item>
</graph_item>
<graph_item>
<sortorder>2</sortorder>
<drawtype>0</drawtype>
<color>2774A4</color>
<yaxisside>0</yaxisside>
<calc_fnc>2</calc_fnc>
<type>0</type>
<item>
<host>Template App NGINX</host>
<key>nginx.status[waiting]</key>
</item>
</graph_item>
<graph_item>
<sortorder>3</sortorder>
<drawtype>0</drawtype>
<color>A54F10</color>
<yaxisside>0</yaxisside>
<calc_fnc>2</calc_fnc>
<type>0</type>
<item>
<host>Template App NGINX</host>
<key>nginx.status[writing]</key>
</item>
</graph_item>
</graph_items>
</graph>
<graph>
<name>nginx status server</name>
<width>900</width>
<height>200</height>
<yaxismin>0.0000</yaxismin>
<yaxismax>100.0000</yaxismax>
<show_work_period>1</show_work_period>
<show_triggers>1</show_triggers>
<type>0</type>
<show_legend>1</show_legend>
<show_3d>0</show_3d>
<percent_left>0.0000</percent_left>
<percent_right>0.0000</percent_right>
<ymin_type_1>0</ymin_type_1>
<ymax_type_1>0</ymax_type_1>
<ymin_item_1>0</ymin_item_1>
<ymax_item_1>0</ymax_item_1>
<graph_items>
<graph_item>
<sortorder>0</sortorder>
<drawtype>0</drawtype>
<color>1A7C11</color>
<yaxisside>0</yaxisside>
<calc_fnc>2</calc_fnc>
<type>0</type>
<item>
<host>Template App NGINX</host>
<key>nginx.status[accepts]</key>
</item>
</graph_item>
<graph_item>
<sortorder>1</sortorder>
<drawtype>0</drawtype>
<color>F63100</color>
<yaxisside>0</yaxisside>
<calc_fnc>2</calc_fnc>
<type>0</type>
<item>
<host>Template App NGINX</host>
<key>nginx.status[handled]</key>
</item>
</graph_item>
<graph_item>
<sortorder>2</sortorder>
<drawtype>0</drawtype>
<color>2774A4</color>
<yaxisside>0</yaxisside>
<calc_fnc>2</calc_fnc>
<type>0</type>
<item>
<host>Template App NGINX</host>
<key>nginx.status[requests]</key>
</item>
</graph_item>
</graph_items>
</graph>
</graphs>
</zabbix_export>
ZABBIX 3.4 监控Nginx 状态(七)的更多相关文章
- Zabbix 监控 Nginx 状态
简介: 如何使用 Zabbix 监控 Nginx 状态 ? 1.获取 Nginx 状态( HTTP Stub Status ) shell > /usr/local/nginx/sbin/ngi ...
- Zabbix监控Nginx状态信息
首先要检查Nginx是否安装了 http_stub_status_module 模块,通过下面的命令可以看到编译参数.yum安装的默认会带有这个模块. [root@kafka60 ~]# /data/ ...
- zabbix自定义key监控nginx和fpm(网站并发数)
一. nginx编译参数 监控nginx,主要讲解监控并发数 --prefix=/usr/local/nginx --with-http_stub_status_module zabbix编译参数的查 ...
- zabbix 监控nginx状态
1. 安装nginx,参考其它 [root@iZ2zeapnvuohe8p14289u6Z /]# vim /etc/nginx/nginx.conf # 加上下面 location /nginx_s ...
- zabbix自定义key监控memcache状态及其他服务进程
一.在客户端 1.到/usr/loca/zabbix/conf/zabbix_agentd.conf里添加 UserParameter=memcached_stats[*],(echo ...
- ngxtop实时监控nginx状态
ngxtop实时解析nginx访问日志,并且将处理结果输出到终端,功能类似于系统命令top,所以这个软件起名ngxtop.有了ngxtop,你可以实时了解到当前nginx的访问状况,再也不需要tail ...
- (七)zabbix监控nginx
1.agent端配置 1)nginx编译安装需要加上该选项--with-http_stub_status_module 2)修改nginx配置文件 #vim /usr/local/nginx/conf ...
- Zabbix 监控 Nginx(四)
简介: 如何使用 Zabbix 监控 Nginx 状态 ? 1.获取 Nginx 状态( HTTP Stub Status ) [root@localhost ~]# /apps/product/ng ...
- zabbix监控nginx
nginx status详解 active connections – 活跃的连接数量server accepts handled requests — 总共处理了11989个连接 , 成功创建11 ...
随机推荐
- spring boot 使用及最佳实践
第一部分,spring boot 文档 Spring boot的使用 使用maven进行构建 用户可以通过继承spring-boot-starter-parent来获取默认的依赖. l 默认java ...
- PLSQL函数,存储过程
--创建一个函数,用来根据部门编号返回调薪幅度 create or replace function get_ratio_by_dept(deptno varchar2) return number ...
- Golang 2018.1.2激活及使用技巧
对于做Java开发的同学使用最熟练的开发工具应该当属Eclipse了吧,但是做到后面的话一般都会转用Intellij Idea.至于转用Intellij有什么好处我就不赘述了,简言之就是功能强大,使用 ...
- Annotation 使用备忘
title: Annotation 使用备忘 date: 2016-11-16 23:16:43 tags: [Annotation] categories: [Programming,Java] - ...
- dubbo实际应用中的完整的pom.xml
http://blog.csdn.net/rodjohnsondoctor/article/details/39030601
- 软件工程-东北师大站-第九次作业(PSP)
1.本周PSP 2.本周进度条 3.本周累计进度图 代码累计折线图 博文字数累计折线图 4.本周PSP饼状图
- OO学习总结与体会
前言 经过了对于面向对象程序设计的一个月的学习,我初尝了JAVA以及面向对象程序的魅力.经历了三次难度逐渐加大的课后编程作业,我对于工程化面向对象编程以及调试有了深刻的认识与颇多感想.我写下本篇文章以 ...
- 团队冲刺--Seven
昨天: 司宇航:测试功能版块,优化功能版块. 马佳慧:优化界面 . 王金萱:合并程序. 季方: 合并程序. 今天: 司宇航:优化功能版块. 马佳慧:优化界面 . 王金萱:优化界面. 季方: 完善功 ...
- Spring笔记④--spring整合hibernate链接数据库
整合hibernate 整合什么? 有ioc容器来管理hibernate的SessionFactory 让hibernate使用上spring的声明式事务 先加入hibernate 驱动包 新建hib ...
- ubuntu16.04安装cuda8.0试错锦集
ubuntu16.04安装cuda8.0试错锦集 参考文献: [http://www.jianshu.com/p/35c7fde85968] [http://blog.csdn.net/sinat_1 ...